Abstract
In this paper we investigate features and their combinations for food image analysis and a classification approach based on k-nearest neighbors and vocabulary trees. The system is evaluated on a food image dataset consisting of 1453 images of eating occasions in 42 food categories which were acquired by 45 participants in natural eating conditions. The same image dataset is used to test the classification system proposed in the previously reported work [1]. Experimental results indicate that using our combination of features and vocabulary trees for classification improves the food classification performance about 22% for the Top 1 classification accuracy and 10% for the Top 4 classification accuracy.
Keywords: Dietary Assessment, Image Classification, Food Identification, Vocabulary Trees
1. INTRODUCTION
There is a growing concern about chronic diseases and other health problems related to diet including hypertension, obesity, heart disease and cancer. The need of accurate methods and tools to measure food and nutrient intake becomes imperative for epidemiological and clinical research linking diet and disease. We aim to develop an image analysis system to automatically identify and quantify foods and beverages consumed at an eating occasion from images of foods and beverages acquired using a mobile device [2, 3].
Classifying foods in an image poses unique challenges because of the large visual similarity between food classes such as a brownie and a chocolate cake. In addition, foods are non-rigid objects that can deform in many ways, and consequently there is also a large variation within classes such as scrambled eggs and boiled eggs. Appearance variations may also arise from changes in illumination and viewpoint. There has been recent efforts to address the challenges in food identification. In [4] a method of food identification is described by exploiting the spatial relationship between different ingredients and learning the statistics of pairwise local features. An online food-logging system that distinguishes food images from other images, analyzes the food balance, and visualizes the log is presented in [5]. In [6] a multiple kernel learning method based on SVM is described for food image recognition.
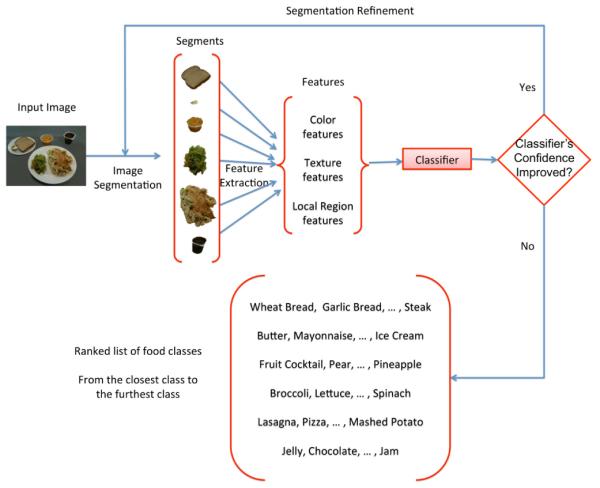
In this paper, we describe features and classification methods for food image analysis that extends our previous work[1, 7]. Figure 1 shows an example of our food classification system. Once an eating occasion image is acquired, image segmentation methods are first used to locate object boundaries for food items in the image. Then color, texture and local region features are extracted from each segmented area for food classification. We feedback the initial food classification result to refine the food segmentation and classification results until maximum food classification confidence score is achieved. Our image segmentation and classification method was tested on 1453 images of eating occasions acquired by 45 participants in natural eating conditions.
Fig. 1.

Our food classification system.
2. FEATURE EXTRACTION
Rabinovich et al. [8] have shown that it is possible to achieve good localization and multi-class recognition performance using image segmentation. Several segmentation methods have been investigated for food segmentation such as Active Contours [9], Normalized Cuts [10] and Local Variation [11]. Food image segmentation is beyond the scope of this paper. The image segments are then classified into a particular food label using the features extracted from that segment. Our goal in this paper is to find features that adequately represent the visual information of objects. We investigate color, texture and local region features for food classification.
Color descriptors have been extensively studied in image retrieval. We have used the following two color descriptors in MPEG-7 standard [12]:
Scalable Color Descriptor (SCD)
Dominant Color Descriptor (DCD)
SCD is a color histogram descriptor in HSV Color Space with a uniform quantization of the HSV space to 128 bins, that includes 8 levels in H, 4 levels in S, and 4 levels in V. DCD is most suitable for representing object features where a small number of colors are enough to characterize the color information in the region of interest. We use color clustering to extract a small number of representing colors and their percentages from a segmented region in the perceptually uniform CIE LUV color space.
Texture, similar to color, is a very descriptive low-level feature for image search and matching applications. In our system, we used the following two texture descriptors [1] for food classification:
Entropy-Based Categorization and Fractal Dimension Estimation (EFD)
Gabor-Based Image Decomposition and Fractal Dimension Estimation (GFD)
EFD can be seen as an attempt to characterize the variation of roughness of homogeneous parts of the texture in terms of complexity. Entropy is used as a measure of local signal complexity. Once the entropy is estimated for pixels in the texture image, the regions with similar entropy values are clustered to form a point categorization. The fractal dimension descriptor is, then, estimated for every point set according to this categorization. To extract GFD, the image is decomposed into sub-images in its spatial frequency dimension using Gabor filter-bank. The fractal dimension is estimated for each filtered response.
Local region features are described for points of interest and/or local regions. The idea is to find points in the object which can be reliably found in other samples of the same object regardless of variations between images. An invariant local region feature describes such points of interest in the same way in different images with illumination, scale and viewpoint changes. We investigated the following two local region features for food classification:
Scale Invariant Feature Transforms (SIFT)
Multi-scale Dense SIFT (MDSIFT)
The SIFT has been shown to be very successful in many object recognition applications [13]. Recent work has shown that better classification results are often obtained by examining the SIFT descriptor over dense grids in the image instead of at sparse keypoints [14]. The MDSIFT descriptor is a variant of the dense SIFT descriptor at multiple scales. To generate the MDSIFT descriptor, SIFT descriptors are computed at each grid point over four circular support patches with different radii, consequently each point is represented by four SIFT descriptors. Descriptors are computed at different scales to allow for scale variation between images [14].
3. FOOD CLASSIFICATION
After extracting color, texture and local region features from a segmented region, we use k-nearest neighbors [15] to classify color and texture features. The vocabulary tree classifier [16] is used to classify local region features.
The k-nearest neighbors (KNN) classifier [15] is widely used. Given a query feature vector, KNN predicts the classification label based on the k closest training vectors. The corresponding query object is classified by a majority vote of these k nearest neighbors, i.e. the object is assigned the training class which is most common amongst its k nearest neighbors. The distance measure chosen for the KNN classifier depends on the feature characteristics. According to [12], in similarity matching of histograms, the L1 norm (sum of absolute differences) usually results in good retrieval accuracy. In our system, we use the L1 norm for the SCD, EFD and GFD features and the Euclidean distance (L2 norm) for the DCD feature. We choose k to be 16 so that we have enough descriptor candidates to generate 4 most probable food classes without including too many “distant" points.
Suppose the number of trained food classes is N. Given a query feature vector (fq), and the food class ci of each of the k nearest training feature vectors (ft,i), we estimate the classification “confidence score” of each food class as in Equation 1. The confidence score φ(Sq, cn) describes the classifier’s confidence that its inferred class label cn is the correct label of the query feature vector fq [1].
| (1) |
where d(fq, ft,i) is the distance between the query feature vector and the training feature vector belonging to class ci. d1−NN is the distance between the query feature vector of the input segmented region and its nearest neighbor (1-NN). We added ε to denominator to avoid the case of division by zero.
Vocabulary trees have been shown to be efficient in large-scale image retrieval and object recognition [16]. A vocabulary tree is a hierarchical quantization that is based on hierarchical k-means clustering. To build a vocabulary tree, the training data is first partitioned into k clusters using an initial k-means clustering. Each cluster center serves as a branch for the root of the vocabulary tree. Then for each cluster, the same process is done recursively until the maximum number of leaves L has been reached. In our current implementation we consider the branching factor k = 3, and the maximum number of leaves (L = 10, 000).
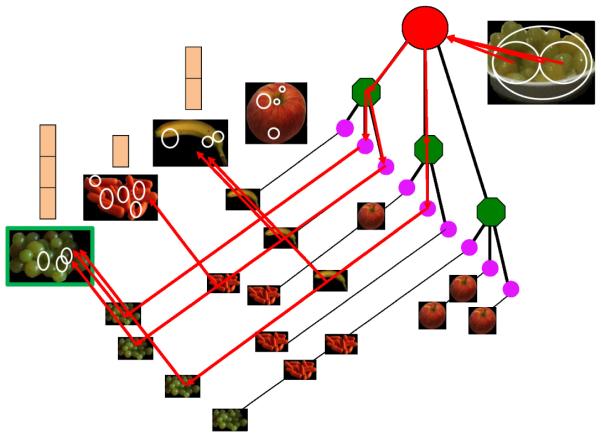
Given a trained vocabulary tree, the query feature vectors are classified by propagating them down the tree, up to the maximum level of the tree in the same manner as [16]. To find the best matching images in the database, the matching score of a segmented training region to the query is based on the similarity of their descriptor vectors’ paths down the vocabulary tree. Figure 2 illustrates the image classification process. Four training images (i.e. images of grapes, carrots, a banana, and an apple) and one query image (i.e. an image of grapes) are used in the example. For each training image a set of local region features are extracted and pushed down the vocabulary tree. The training features are then quantized and assigned to different leaves. When a query image arrives, a set of local region features are extracted in the same way as the training images. The closest match of the query image is found by similarity of their descriptor vectors’ paths down the vocabulary tree. After finding the matches in the training feature vectors, we derive the classification confidence scores for each food class as Equation 1.
Fig. 2.
Image classification process using a vocabulary tree.
4. EXPERIMENTAL RESULTS
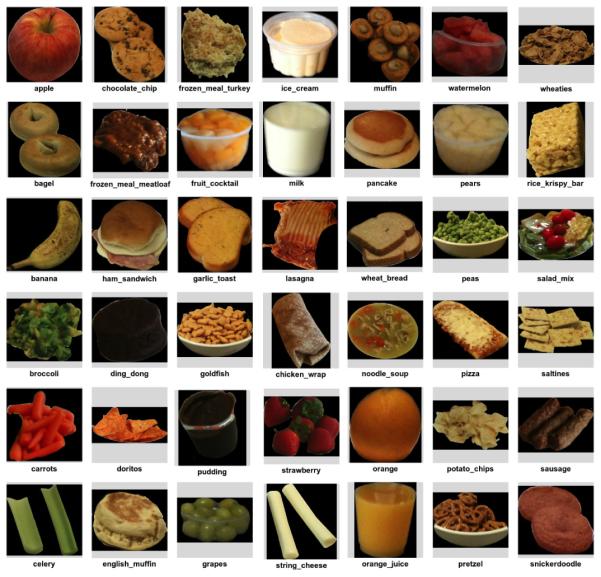
Our image classification method was tested on 1453 images of eating occasions in 42 unique food categories (as shown in Figure 3). The food identification accuracy is defined as:
Fig. 3.

The 42-class food dataset. Each image is an instance of a food class.
| (2) |
where TP indicates True Positives (correctly detected food segments); FP indicates False Positives (incorrectly detected food segments or misidentified foods); TN indicates True Negatives (food not detected). Finally, K refers to the identification accuracy order.
In our image segmentation and classification system, each segment is assigned to 4 food categories corresponding to the top 4 categories according to the ranking by confidence scores. The original image is sent back to the participant to either confirm the top food category, or select from the next three, or designate a food category from a larger list of choices. The top 1 and top 4 classification accuracy of all the images using different features are shown in Table 1.
Table 1.
Top 1 and Top 4 food classification accuracy from individual features.
| Feature | Classifier | Top 1 Accuracy | Top 4 Accuracy |
|---|---|---|---|
| DCD | KNN | 54.5% | 81.0% |
| SCD | KNN | 46.5% | 76.3% |
| EFD | KNN | 30.5% | 50.1% |
| GFD | KNN | 24.0% | 48.0% |
| SIFT | Vocabulary Tree |
50.1% | 75.2% |
| MDSIFT | Vocabulary Tree |
54.2% | 81.0% |
After examining color, texture and local region feature individually, we obtain K classification labels and their confidence scores from each feature. We combine the confidence scores of food labels that belong to the same food class and choose the food classes with Top confidence scores to be reviewed by users. According to Table 1, DCD and MDSIFT achieve better classification accuracy than other features, so we use these two features as the base of our combination. We add other features in the combination in the order of their individual classification accuracy. The food classification accuracy of Top 1 and Top 4 most probable food classes from combinations of features is shown in Table 2.
Table 2.
Top 1 and Top 4 food classification accuracy from feature combinations.
| Features | Top 1 Accuracy | Top 4 Accuracy |
|---|---|---|
| DCD + MDSIFT | 60.9% | 83.27% |
| DCD + MDSIFT + SCD | 62.9% | 85.1% |
| DCD + MDSIFT + SCD + SIFT |
64.5% | 84.2% |
| DCD + MDSIFT + SCD + SIFT + EFD |
63.5% | 83.4% |
| DCD + MDSIFT + SCD + SIFT + EFD + GFD |
62.9% | 82.8% |
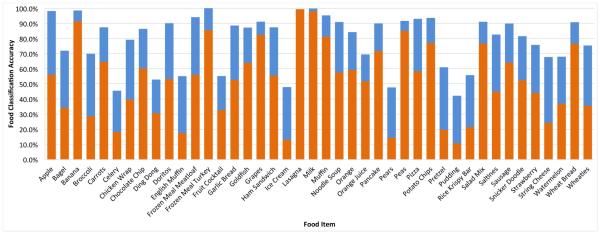
As we can see from Table 2 after combining the food classification results from different features, if we provide the most probable food label to a food item, the best food classification accuracy we can achieve is 64.5%; if we use the Top 4 most probably food labels for a food item, the best food classification accuracy we can achieve is 84.2%. The results shown in Table 2 also indicate that more features do not necessarily indicate better food classification results. When we add EFD and GFD to our system, the classification accuracies decrease for both Top 1 and Top 4 food classification. Therefore, we choose three features including DCD, MDSIFT and SCD, in our food classification system. The Top 1 and Top 4 food classification accuracy for each food item using the combination of these three features is shown in Figure 4.
Fig. 4.
Top 1 and Top 4 food classification accuracy for food items with three features fused together, DCD, MDSIFT and SCD. The top of the orange bar: Top 1 classification accuracy; the top of the blue bar: Top 4 classification accuracy.
We use the same image dataset to test the classification system proposed in [1]. Experimental results indicate that using our combination of three features, namely DCD, MDSIFT and SCD, improves the food classification performance about 22% for the Top 1 classification accuracy and 10% for the Top 4 classification accuracy.
5. CONCLUSIONS
In this paper, we described an image classification system for identifying food items in images of eating occasions. We have achieved significant improvement in food identification accuracy from previously reported work. Automatic identification of food items in an image is not an easy problem. We fully understand that we will not be able to recognize every kind of food. We are continuing to refine and develop the system to increase its accuracy and usability by exploring contextual information in addition to visual characteristics.
Acknowledgments
This work was sponsored by grants from the National Institutes of Health under grants NIDDK 1R01DK073711-01A1 and NCI 1U01CA130784-01. Any opinions, findings, and conclusions or recommendations expressed in this material are those of the author(s) and do not necessarily reflect the views of the National Institutes of Health.
6. REFERENCES
- [1].Bosch M, Zhu F, Khanna N, Boushey C, Delp E. Combining global and local features for food identification and dietary assessment; Proceedings of the IEEE International Conference on Image Processing (ICIP); Brussels, Belgium. Sep, 2011. pp. 1789–1792. [DOI] [PMC free article] [PubMed] [Google Scholar]
- [2].Zhu F, Bosch M, Woo I, Kim S, Boushey C, Ebert D, Delp E. The use of mobile devices in aiding dietary assessment and evaluation. IEEE Journal of Selected Topics in Signal Processing. 2010 Aug;4(4):756–766. doi: 10.1109/JSTSP.2010.2051471. [DOI] [PMC free article] [PubMed] [Google Scholar]
- [3].Daugherty BL, Schap TE, Ettienne-Gittens R, Zhu F, Bosch M, Delp EJ, Ebert DS, Kerr DA, Boushey CJ. Novel technologies for assessing dietary intake: Evaluating the usability of a mobile telephone food record among adults and adolescents. Journal of Medical Internet Research. 2012 Apr;14(2):e58. doi: 10.2196/jmir.1967. [DOI] [PMC free article] [PubMed] [Google Scholar]
- [4].Yang S, Chen M, Pomerleau D, Sukhankar R. Food recognition using statistics of pair-wise local features; Proceedings of the International Conference on Computer Vision and Pattern Recognition; San Francisco, CA. Jun, 2010. pp. 2249–2256. [Google Scholar]
- [5].Kitamura K, Yamasaki T, Aizawa K. Foodlog: Capture, analysis and retrieval of personal food images via web; Proceedings of the ACM multimedia workshop on Multimedia for cooking and eating activities; Beijing, China. Nov, 2009. pp. 23–30. [Google Scholar]
- [6].Joutou T, Yanai K. A food image recognition system with multiple kernel learning; Proceedings of the IEEE International Conference on Image Processing (ICIP); Cairo, Egypt. Oct, 2009. pp. 285–288. [Google Scholar]
- [7].He Y, Xu C, Khanna N, Boushey C, Delp E. Food image analysis: Segmentation, identification and weight estimation; Proceedings of IEEE International Conference on Multimedia and Expo; San Jose, CA. Jul, 2013. pp. 1–10. [DOI] [PMC free article] [PubMed] [Google Scholar]
- [8].Rabinovich A, Vedaldi A, Belongie S. Does image segmentation improve object categorization? UCSD CSE Department, Tech. Rep. CS2007-090. 2007 Oct; [Google Scholar]
- [9].Kass M, Witkin A, Terzopoulos D. Snakes: Active contour models. International Journal Of Computer Vision. 1988;1(4):321–331. [Google Scholar]
- [10].Shi J, Malik J. Normalized cuts and image segmentation. IEEE Transactions on Pattern Analysis and Machine Intelligence. 2000 Aug;22(8):888–905. [Google Scholar]
- [11].Felzenszwalb P, Huttenlocher D. Image segmentation using local variation; Proceedings of the IEEE Computer Society Conference on Computer Vision and Pattern Recognition; Washington, DC. Jun, 1998. pp. 98–104. [Google Scholar]
- [12].Manjunath B, Ohm J-R, Vasudevan V, Yamada A. Color and texture descriptors. IEEE Transactions on Circuits and Systems for Video Technology. 2001 Jun;11(6):703–715. [Google Scholar]
- [13].Lowe D. Distinctive image features from scale-invariant keypoints. International Journal of Computer Vision. 2004 Jan;2(60):91–110. [Google Scholar]
- [14].Bosch A, Zisserman A, Muoz X. Image classification using random forests and ferns; Proceedings of the 11th IEEE International Conference on Computer Vision; Rio de Janeiro, Brazil. Oct, 2007. pp. 1–8. [Google Scholar]
- [15].Duda R, Hart P. Pattern classification and scene analysis. John Wiley & Sons; Feb, 1973. [Google Scholar]
- [16].Nister D, Stewenius H. Scalable recognition with a vocabulary tree; Proceedings of the IEEE Computer Society Conference on Computer Vision and Pattern Recognition; Washington, DC. Jun, 2006. pp. 2161–2168. [Google Scholar]


