Abstract
This work is motivated by the desire to use image analysis methods to identify and characterize images of food items to aid in dietary assessment. This paper introduces three texture descriptors for texture classification that can be used to classify images of food. Two are based on the multifractal analysis, namely, entropy-based categorization and fractal dimension estimation (EFD), and a Gabor-based image decomposition and fractal dimension estimation (GFD). Our third texture descriptor is based on the spatial relationship of gradient orientations (GOSDM), by obtaining the occurrence rate of pairs of gradient orientations at different neighborhood scales. The proposed methods are evaluated in texture classification and food categorization tasks using the entire Brodatz database and a customized food dataset with a wide variety of textures. Results show that for food categorization our methods consistently outperform several widely used techniques for both texture and object categorization.
1. INTRODUCTION
There is a growing concern in the world relative to chronic diseases related to diet. This includes obesity, cancer, diabetes, and heart disease. Of the 10 leading causes of death in the U.S., 6 are related to diet. Dietary intake, the process of determining what someone eats during the course of a day, provides valuable insights for mounting intervention programs for prevention of many chronic diseases. The use of a mobile telephones built-in digital camera has been shown to provide unique mechanisms for improving the accuracy and reliability of dietary assessment [1]. To provide accurate estimates of food energy and nutrient intake we are developing image analysis methods to automatically estimate the food consumed at a meal from images acquired using a mobile device [2]. Within our image analysis scheme, food classification plays a fundamental role.
Usually object classification is a two step process: feature extraction and class assignment. Among the features that we are exploring to characterize the visual information of foods, texture has emerged as a very important and descriptive feature. This is particularly true when color does not provide much discrimination power.
In general, texture features describe the arrangement of basic elements of a material on a surface. In recent years, many local features and kernels have been proposed for texture and object classification [5, 26]. Many of these local descriptors are based on the information encoded in the gradient orientation. How to effectively model the spatial relationship among local features across different instances of the texture class is still an open problem.
Fractal information has also been investigated for texture description, Xu et. al., in [17, 14], proposed the usage of multifractal spectrum as an extension of the multifractal analysis [10, 11]. It provides an efficient framework combining global spatial invariance and local robust measurements by capturing essential structure of textures with low dimension. Their proposed methods achieve bi-Lipschitz transform invariance, this is invariance against translation, rotation, perspective transformation, and texture warping on regular textures. Varma et. al. proposed locally invariant fractal features for statistical texture description [15], which are also based on multifractal analysis.
In this paper, we propose three texture descriptors suitable for food categorization. Based on multifractal analysis theory we propose an Entropy-based categorization and Fractal Dimension estimation (EFD), and a Gabor-based image decomposition and Fractal Dimension estimation technique (GFD). Our final texture descriptor is based on the occurrence rate of the spatial relationship of gradient orientations for different neighborhood sizes (GOSDM). A performance comparison between our proposed methods and well-known texture description approaches is presented for texture classification and object (food items) categorization tasks.
2. FRACTAL SIGNATURES FOR TEXTURE CHARACTERIZATION
Fractal representation is an idealization of natural textures. Many self-similar images, e.g. textures, are complex entities formed by many structural components that as a whole can provide a fractal nature. In 1984 Pentland [6] suggested that images of natural scene can be described by fractal information. By representing a grayscale image in a 3-D space, where (x, y) denote the 2-D coordinate position and the gray-level intensity denotes the third coordinate, Pentland showed that the fractal dimension (FD) closely describes an intuitive notion of surface roughness. Maldebrot [7] showed that fractal objects are constant under certain types of scale transformations. He suggested that most of the natural phenomenons satisfy the power law. This can be written as [7]:
| (1) |
where I (s) represents the unit measure, in this case the gray-level intensity, s the scale used, and D is the fractal dimension (Hausdorff-Besicovitch dimension). In texture representation, FD alone does not fully represent a rich description. Different textures may have the same FD due to combined differences in directionality and coarseness [7]. These uncertainties can be addressed by multifractal analysis [8, 11], where a point categorization is defined on the object function based on some criteria. The FD is estimated for every point set according to this categorization. A common criteria for categorization is the probably density function estimated from the image intensity [11, 17].
2.1 Entropy Categorization and FD Estimation(EFD)
We propose a multifractal analysis of textures with a texture complexity-based categorization.
Entropy [12] is a measure of local signal complexity. Regions corresponding to high signal complexity tend to have higher entropy. In general complexity is independent of scale and position [13], hence we can categorize a texture by selecting areas with homogeneous entropy levels. This approach can be seen as an attempt to characterize the variation of roughness of homogeneous parts of the texture in terms of complexity. Given a pixel x and a local neighborhood Mp, we can estimate the pixel entropy Hx as:
| (2) |
where s is the pixel value range, i.e. (s = 0, …, 255), and px,Mp is the probability of a pixel value (in Mp). Once the entropy is estimated for all the pixels in the texture image, we cluster regions where the entropy function exhibits similar values. For a given entropy υ, ϒυ represents the set of pixels {x : x ∈ R2 and Hx ∈ (υ, υ + δ)}, for some arbitrary δ. Once this pixel categorization is completed, we estimate dim(ϒυ), the FD for each ϒυ. We used the Box-counting dimension to estimate the FD. For a nonempty finite subset S of an Euclidean space Rn, the Box-counting dimension would represent the number of boxes of side length ε (Nε) covering S [9], i.e.:
| (3) |
In our case, the subset S represents the gray-level surface of the ϒυ. Taking q × q × q cube boxes, Nε is the number of boxes that intersect with the curved surface of the image in order to cover ϒυ. For each of the entropy levels we estimate one FDϒυ value. The final texture signature is formed by fusing all the FDϒυ into one single feature vector. Figure 1 summarizes the proposed approach.
Figure 1.
Entropy-Based Multifractal Analysis Block Diagram (EFD).
2.2 Gabor-Based Image Decomposition and FD Estimation (GFD)
In [14], multifractal spectrum is introduced using wavelet pyramids. Here we propose the use of Gabor filterbanks as a categorization criteria for multifractal analysis. An image texture can be defined as a local arrangement of image irradiances projected from a surface patch of perceptually homogeneous radiances. Bovik et. al. proposed the use of banks of Gabor filters to distinguish between irradiance patterns [16]. Our goal is to determine the irregularity of the texture elements that differ significantly in their dominant spatial frequency.
Gabor filterbanks consist of Gabor filters with Gaussian impulse responses of several sizes modulated by sinusoidal plane waves of different orientations from the same Gabor-root filter (a sinusoidal plane wave of some orientation and frequency, modulated by a two-dimensional Gaussian envelope). They can be represented as [22]:
| (4) |
where x̃ = a−m (x cos θ + y sin θ), ỹ = a−m (−x sin θ + y cos θ), θ = nπ/K (with K = total orientation, and Σ number of scales, n = 0, 1, …, K − 1, and m = 0, 1, …, Σ − 1), and h(·, ·) the Gabor-root filter. Given an image I (r, c) of size H × W, the discrete Gabor filtered output is given by a 2D convolution
| (5) |
For each scale and orientation, we estimate the FD of the Igm,n estimating the fractal dimension, FDIgm,n. The final descriptor becomes:
| (6) |
Figure 2 illustrates the multifractal analysis using Gabor filterbanks. For the Gabor filterbank implementation we followed the design described in [22] in order to guarantee that the adjacent half-peak contours of the Gabor filters touch each other.
Figure 2.
Gabor-Based Multifractal Analysis Block Diagram (GFD).
3. GRADIENT ORIENTATION SPATIAL-DEPENDENCE BASED TEXTURE DESCRIPTIONS
Our final texture signature consists of estimating a set of Gradient Orientation Spatial-Dependence Matrices (GOSDM) to describe textures by determining the probability of occurrence of quantized gradient orientations at a given spatial offset. Several statistics are extracted from these matrices forming feature vectors that characterize the textures.
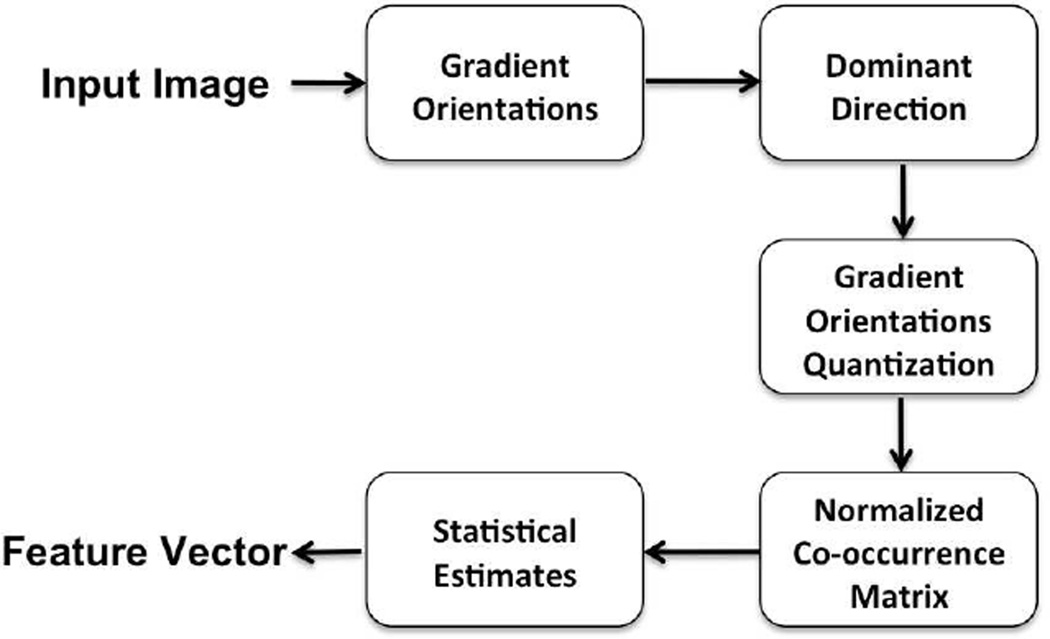
Estimating the GOSDM consists of the following steps: Image gradient estimation, dominant orientation calculation, co-occurrence probability estimation, and statistical characterization. Figure 3 shows the block diagram to estimate the GOSDM.
Figure 3.
The GOSDM Block Diagram.
3.1 Gradient Estimation
We estimate the gradients of the grayscale version of the image in the horizontal (H) and vertical (V) directions using a 5-tap coefficient differentiation filter proposed by Farid and Simoncelli [19]:
where d (·) is a 5-tap differentiation filter and p (·) an interpolator [19].
3.2 Dominant Orientation
The goal is to describe the texture achieving robustness against rotation. This can be accomplished by estimating the dominant direction of the texture pattern. We use a 45° sliding window that sums the horizontal and vertical responses of the gradient inside the window to form a single orientation vector [23]. The largest vector becomes the dominant orientation. We, then, map the gradient orientations relative to the dominant orientation and quantize them in Θ orientation levels, in our experiments the best results where achieved by setting Θ equal to 24. Note that if gradient responses are less than a certain threshold, the gradient orientation is not taken into consideration for the dominant orientation estimation.
3.3 Co-Occurrence Probability Estimation
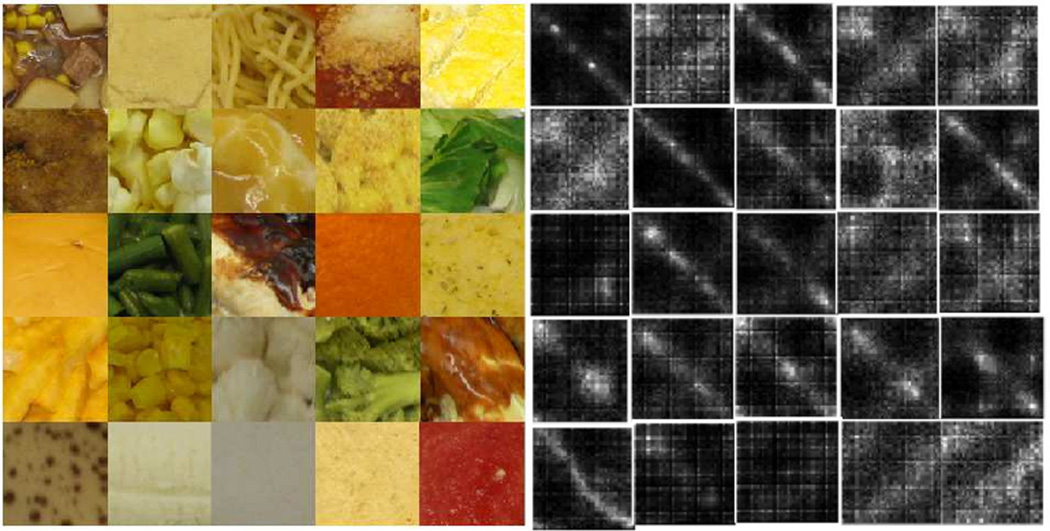
The Gradient Orientation Spatial-Dependence Matrix Pd can be estimated by determining the number of occurrences for each pair of gradient orientation values at a distance d from each other. The vector d = (r, ϕ) = (r0, …rv; ϕ0, …, ϕw) provides distance and angular dependency. For instance, the entry (i, j) of Pd represents the number of occurrences of the pair of quantized gradient orientation values θQ (m, n) = i and θQ (m + r · cos ϕ, n + r · sin ϕ) = j which are distance d apart. Finally, we normalize the matrix to obtain the probability of occurrence between orientation pairs. In Figure 4, there are several examples of GOSDM for various food textures.
Figure 4.
Examples of GOSDMs for various textures. Original textures (left) and their corresponding GOSDM (right). Note that all images are converted to gray scale in our classification scheme.
3.4 Statistical Measurements
In order to reduce the amount of redundant information encoded in the GOSDM while preserving their relevance, we estimated a subset of the features proposed in [18]. These are Correlation, Angular Second Moment, Entropy, and Contrast. To achieve robustness against rotation changes, the final feature vector contains the estimated mean and variance of the four statistics among the angular directions (ϕ) for each magnitude value (r) of d considered.
4. EXPERIMENTAL EVALUATION
4.1 Texture Datasets Experiments
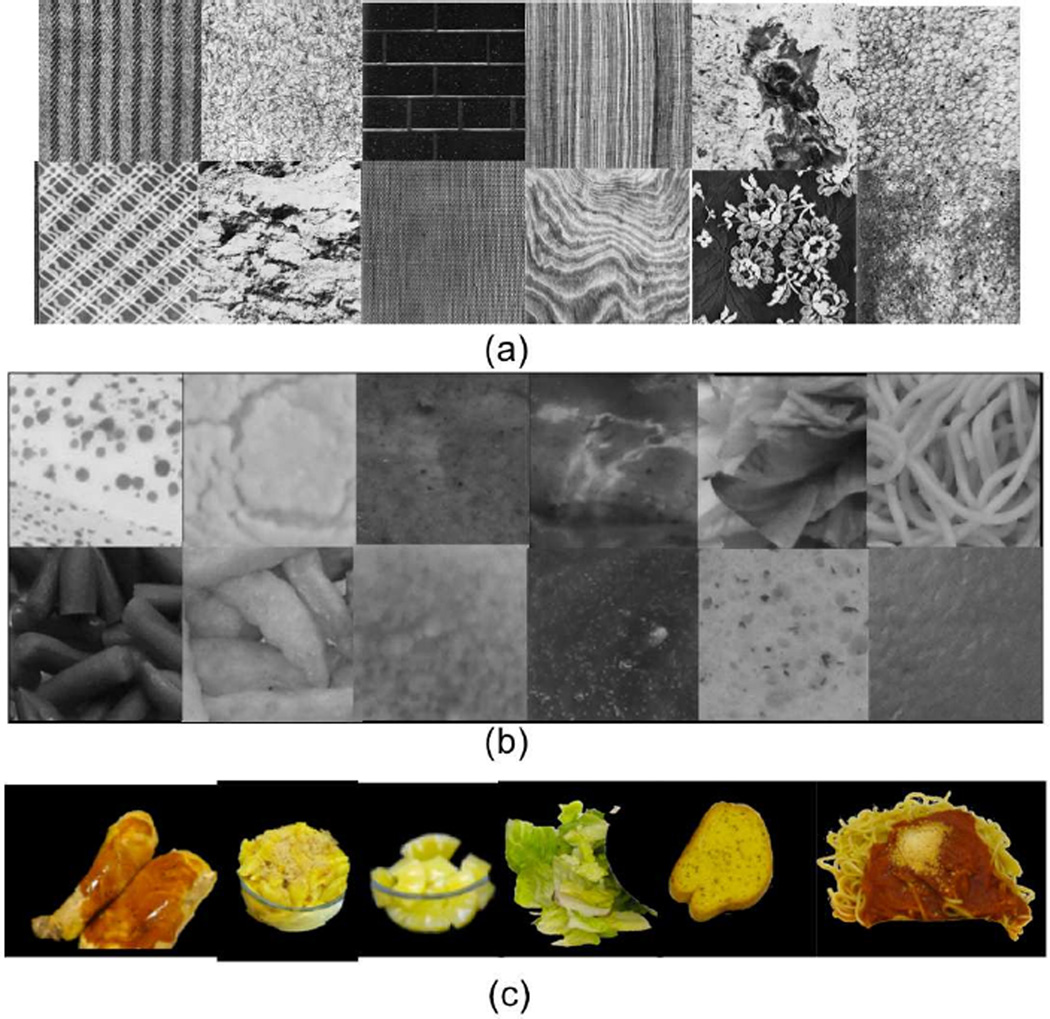
To assess the efficiency of the proposed signatures in order to characterize food textures, we performed several classification experiments using the Brodatz database [20]. We used the entire database, i. e., a total of 111 texture images, each texture sample was divided into 128 × 128 pixel blocks. For each texture sample there were 25 instances. A total of 2775 texture blocks were used in our experiments. In the Brodatz database, there are some perceptually similar textures with different labels making it challenging for performance analysis. Also several texture samples are very heterogeneous, and thus, difficult to achieve successful recognition. (Figure 5.a).
Figure 5.
Several texture and food samples used in the experiments. (a) Brodatz dataset. (b) Food texture dataset. (c) Entire food object.
We built a small food texture database with 25 different food items to evaluate the efficiency of our texture descriptors on food textures. For each food item there were 10 texture instances obtained from different images and different foods within the same food type, providing a richer dataset in terms of intraclass variation than the Brodatz database: (Figure 5.b).
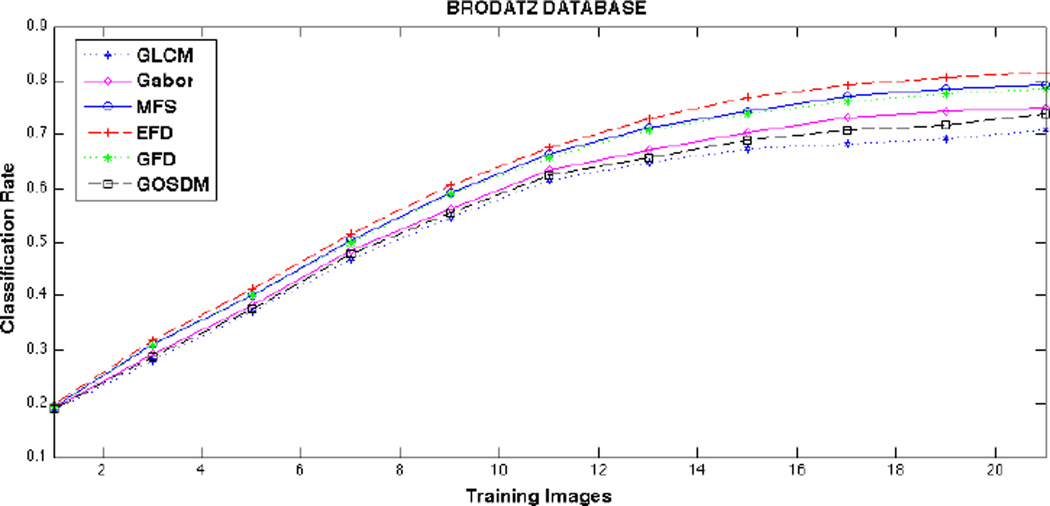
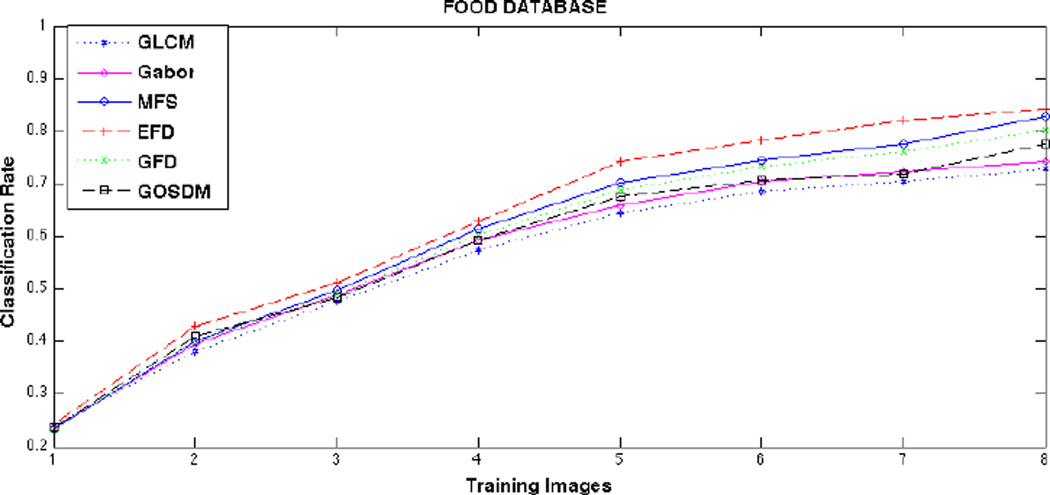
Our classifier was divided into two stages: a learning stage where texture models were learned from the training data, and a classification stage where new testing texture images were classified using nearest neighbor (NN). The approach consisted of averaging the training features forming one single feature vector per class, and assigning the testing data to the closest class based on the euclidean distance metric. We compared our texture descriptors with Gabor-like features (Gabor mean and variance) [22], Gray-Level Co-occurrence Matrix (GLCM) features [18], and Multifractal Spectrum (MFS) model proposed in [17]. Figures 6 and 7 show average classification rates vs. number of training instances used, for Brodatz and food datasets respectively. For each number of training data, experiments were repeated 10 times randomly assigning instances of each class to training and testing. In the EFD descriptor, we divided the entropy of the image, into U levels depending on the entropy variance within the texture. Best performance was achieved by setting U = 16. The entropy for each pixel was obtained from a 16 × 16 pixel neighborhood. In the GFD we used a bank of Gabor filters with 4 scales and 6 orientations. Finally, we estimated the GOSDMs using an offset equal to 1, 4, 16, …, R/2 where R was the size of the texture sample. For each offset magnitude, 4 angular directions were considered 0°, 45°, 90°, 135°.
Figure 6.
Classification rate vs. number of training images for GLCM, Gabor, MFS, EFD, GFD, and GOSDM features using the Brodatz database.
Figure 7.
Classification rate vs. number of training images for GLCM, Gabor, MFS, EFD, GFD, and GOSDM features using the Food database.
4.2 Food Classification Experiments
As discussed earlier, our final goal is food classification. Classical approaches of object recognition included extracting global visual characteristics such as color and texture. For the purpose of this paper we only use texture-type information from the foods.
Apart from high-level color and texture features, several low-level descriptors based on the information encoded in the gradient orientation have been proposed for different computer vision tasks [21, 23, 24]. Based on “Bag-of-Features” (BoF) approach [25], Lazebnik et. al. proposed a method to represent textures using low-level descriptors [26]. Their approach consisted of forming order-less collections of visual words (texture features) in the query image and compare them to those found in the training images. Following this model we compared our texture descriptors with the following low-level descriptors: SIFT [21], and SURF [23].
For these set of experiments we considered 46 different foods, not only texture details as in the food dataset introduced before, but entire food segments. (Figure 5.c). The food objects were segmented from the scene before feature extraction. In order to analyze the extracted features free from any error produced by automatic segmentation, we hand segmented the images. In Table 1, the mean and variance of correct classification accuracy is presented (assuming no error introduced by segmentation). We ran 10 times the experiments, randomly selecting training and testing data each time, 70% of data was labeled as training data, and 30% as testing. Note that in order to keep consistency with the results presented in Figures 6 and 7 we have also included Gabor, GLCM, and MFS performances. Once again EFD, GFD, GOSDM, GLCM, Gabor, and MFS features were classified using NN criteria.
Table 1.
Classification Accuracy Rates for Food Classification Experiments (70% training data, and 30% testing) using: SIFT+BoF, SURF+BoF, GLCM+NN, GOSDM+NN, Gabor+NN, GFD+NN, MFS+NN, and EFD+NN.
| Feature type | Classification Mean | Classification Std. Dev. |
|---|---|---|
| SIFT+BoF | 75.3% | 1.5 |
| SURF+BoF | 71.8% | 1.2 |
| GLCM+NN | 57.7% | 1.9 |
| Gabor+NN | 55.2% | 1.5 |
| MFS+NN | 74.3% | 2.1 |
| EFD+NN | 79.2% | 2.1 |
| GFD+NN | 72.2% | 1.3 |
| GOSDM+NN | 65.3% | 1.9 |
5. DISCUSSION AND FUTUREWORK
From the results shown in this paper, we can see that categorization-based fractal features perform better than classical texture models that use other statistical information. EFD, MFS, GFD consistently have better correct classification rates. Despite the fact that natural food textures cannot be defined as pure fractals, their structural components are arranged in such a way that follow a fractal-based description.
Taking into consideration both Gabor-based models, GFD and Gabor-like features (1st and 2nd statistical moments from the energy of the filtered image) [22], we observed that fractal information from the filtered response can encode more discriminative power. The categorization criteria selected in multifractal analysis has also proven to be an important factor in the method’s efficiency. We found that the entropy-based categorization performed the best; whereas intensity density (MFS) and Gabor-based categorization (GFD) performed very similar.
Finally, the GOSDM method performed far better than GLCM. For consistency purposes, in both methods the same statistics were extracted, (Section 3.4). The use of the gradient instead of the gray level values of the image is motivated by the robustness of the gradient against illumination changes and other distortions.
In our experiments we only considered nearest neighbor rules for the classification scheme. The goal of this work was to only measure the impact of the features with very simple and intuitive classification rules. Usage of classifiers such as SVM would most likely increase the overall classification performance. We wanted to evaluate the discriminative power of the features, not the effectiveness of the classifier.
We have observed that in food texture classification tasks any of the so-called global feature extraction methods are sensitive to scale selection. Some food textures can be better distinguished at very local scales, e.g., cauliflower and popcorn, whereas other food textures such as peeled-banana and white bread are better distinguished by using features at larger scales.
Modern object recognition approaches, as well as methods proposed in this paper, have proven very efficient in identifying discriminative information for challenging textures. The question becomes how to extract all the discriminative information without adding redundancy into the feature space. In [27], Varma and Zisserman showed that, in general, neighborhoods as small as 3 × 3 can lead to very good classification results for textures whose global structure is far larger than the local neighborhoods used. However, local features tend to be ineffective in the case of (non-linear) illumination changes. Also a major drawback of local feature-based strategies is that their classification performance very much rely on the sampling strategy, i.e, dense sampling (do we extract local information from many pixels?), or sparse sampling (do we extract local information only from few “keypoints”?). Most keypoint detection models focus on obtaining points based on their invariance against rotation, scale, or affine transformations, which may not be enough for textures with similar local neighborhoods but different spatial layouts and with no characteristic scale. Also the repetitiveness rate of such points across different instances of the object is still an open problem. Our results (Table 1) show that global features can be as efficient, if not more, as local features when extracting structural information of textures for object categorization. In order to achieve a significant increase in food texture discrimination power, further research efforts should gear toward finding a convergence between optimal scale selection in global feature extraction and optimal salient point detection in local feature extraction.
6. CONCLUSIONS
In this paper we have introduced three texture descriptors. Based on multifractal analysis theory we proposed an entropy-based categorization and fractal dimension estimation method (EFD), and Gabor-based image decomposition and fractal dimension estimation method (GFD). Our third texture descriptor is based on the spatial relationship of gradient orientations (GOSDM). We have compared our three descriptors with well-known texture descriptor methods in a widely used benchmark for texture classification, and in a food texture dataset. We have shown that for food categorization our methods can outperform them. We have also evaluated the proposed descriptors on a general food database, and shown that EFD and GFD performed similarly, in some cases better, than popular descriptors used in category-level object recognition such as SIFT and SURF.
Acknowledgments
This work was sponsored by grants from the National Institutes of Health under grants NIDDK 1R01DK073711-01A1 and NCI 1U01CA130784-01.
REFERENCES
- 1.Boushey CJ, Kerr DA, Wright J, Lutes KD, Ebert DS, Delp EJ. Use of Technology in Children’s Dietary Assessment. European Journal of Clinical Nutrition. 2009;1:S50–S57. doi: 10.1038/ejcn.2008.65. [DOI] [PMC free article] [PubMed] [Google Scholar]
- 2.Zhu F, Bosch M, Woo I, Kim S, Boushey CJ, Ebert DS, Delp EJ. The Use of Mobile Devices in Aiding Dietary Assessment and Evaluation. IEEE Journal of Selected Topics in Signal Processing. 2010 Aug;4(4):756–766. doi: 10.1109/JSTSP.2010.2051471. [DOI] [PMC free article] [PubMed] [Google Scholar]
- 3.Cula O, Dana K. Compact representation of bidirectional texture functions. Proceedings of IEEE Conference on Computer Vision and Pattern Recognition. 2001;1:1041–1047. [Google Scholar]
- 4.Varma M, Zisserman A. Classifying Images of Materials: Achieving Viewpoint and Illumination Independence. Proceedings of the European Conference on Computer Vision. 2002;3:255–271. [Google Scholar]
- 5.Zhang J, Marszalek M, Lazebnik S, Schmid C. Local Features and Kernels for Classification of Texture and Object Categories: A Comprehensive Study. International Journal of Computer Vision. 2007 Jun;73(2):213–238. [Google Scholar]
- 6.Pentland A. Fractal-Based Description of Natural Scenes. IEEE Transactions on Pattern Analysis and Machine Intelligence (PAMI) 1984 Nov;6(6):661–674. doi: 10.1109/tpami.1984.4767591. [DOI] [PubMed] [Google Scholar]
- 7.Mandelbrot B. Fractals: Form, Chance and Dimension. San Francisco, CA: Freeman; 1977. [Google Scholar]
- 8.Sailhac P, Seyler F. In: Texture Characterisation of ERS-1 Images by Regional Multifractal Analysis. Levy Vehel J, editor. Springer: Fractals in Engineering; 1997. pp. 32–41. [Google Scholar]
- 9.Sarkar N, Chaudhuri B. An Efficient Differential Box-Counting Approach to Compute Fractal Dimension of Images. IEEE Transactions on Systems, Man and Cybernetics. 1994;24:115–120. [Google Scholar]
- 10.Vehel J, Mignot P, Merriot J. Multifractals, Texture, and Image Analysis; Proceedings of the IEEE Conference on Computer Vision and Pattern Recognition (CVPR); 1992. pp. 661–664. [Google Scholar]
- 11.Falconer K. Fractal Geometry: Mathematical Foundations and Applications. England: Wiley; 1990. [Google Scholar]
- 12.Shannon C. A Mathematical Theory of Communication. Bell System Technical Journal. 1948 July, October;27:379–423. 623–656. [Google Scholar]
- 13.Kadir T, Brady M. Scale, Saliency and Image Description. International Journal of Computer Vision. 2001 Nov;45(2):83–105. [Google Scholar]
- 14.Xu Y, Yang X, Ling H, ji H. Proceedings of the IEEE Conference on Computer Vision and Pattern Recognition (CVPR) San Francisco: 2010. A New Texture Descriptor Using Multifractal Analysis in Multi-orientation Wavelet Pyramid. [Google Scholar]
- 15.Varma M, Garg R. Locally invariant fractal features for statistical texture classification. Proceedings of the International Conference on Computer Vision. 2007;1:1–8. [Google Scholar]
- 16.Bovik A, Clark M, Geisler W. Multichannel Texture Analysis using Localized Spatial Filters. IEEE Transactions on Pattern Analysis and Machine Intelligence (PAMI) 1990;12:55–73. [Google Scholar]
- 17.Xu Y, Li H, Fermuller C. Proceedings of the IEEE Conference on Computer Vision and Pattern Recognition (CVPR) Vol. 2. New York: 2006. A Projective Invariant for Textures; pp. 1932–1939. [Google Scholar]
- 18.Haralick R. Statistical and Structural Approaches to Texture. Proceedings of the IEEE. 1979 May;67(5):786–804. [Google Scholar]
- 19.Farid H, Simoncelli E. Differentiation of Discrete Multidimensional Signals. IEEE Transactions on Image Processing. 2004;13 doi: 10.1109/tip.2004.823819. [DOI] [PubMed] [Google Scholar]
- 20.Brodatz P. Textures: A Photographic Album for Artists and Designers. Dover, NY: 1996. [Google Scholar]
- 21.Lowe D. Distinctive Image Features from Scale-Invariant Key-points. International Journal on Computer Vision. 2004;2(60):91–110. [Google Scholar]
- 22.Manjunath B, Ma W. Texture Features for Browsing and Retrieval of Image Data. IEEE Transactions on Pattern Analysis and Machine Intelligence. 1996 Aug;18(8):837–842. [Google Scholar]
- 23.Bay H, Ess A, Tuytelaars T, Van Gool L. SURF: Speeded Up Robust Features. Journal on Computer Vision and Image Understanding. 2008;110(3):346–359. [Google Scholar]
- 24.Mikolajczyk K, Schmid C. A Performance Evaluation of Local Descriptors. IEEE Transactions on Pattern Analysis and Machine Intelligence (PAMI) 2005;27(10):1615–1630. doi: 10.1109/TPAMI.2005.188. [DOI] [PubMed] [Google Scholar]
- 25.Csurka G, Dance C, Fan L, Willamowski J, Bray C. Proceedings of the 2004 International Workshop on Statistical Learning in Computer Vision. Prague, CZ: 2004. Visual Categorization with Bags of Keypoints. [Google Scholar]
- 26.Lazebnik S, Schmid C, Ponce J. A Sparse Texture Representation Using Affine-Invariant Regions. Proceedings of the International Conference on Computer Vision and Pattern Recognition (CVPR) 2003;3:319–324. [Google Scholar]
- 27.Varma M, Zisserman A. A Statistical Approach to Material Classification Using Image Patch Exemplars. IEEE Transactions on Pattern Analysis and Machine Intelligence (PAMI) 2009 Nov;31(11):2032–2047. doi: 10.1109/TPAMI.2008.182. [DOI] [PubMed] [Google Scholar]


