

Actin-rich denticle precursors are regularly distributed in the Drosophila embryo. Cytoskeletal scaling occurs through changes in denticle number and spacing. Denticle spacing scales with cell length over a 10-fold range. Accurate denticle positioning requires the microtubule cytoskeleton.
Abstract
Spatially organized macromolecular complexes are essential for cell and tissue function, but the mechanisms that organize micron-scale structures within cells are not well understood. Microtubule-based structures such as mitotic spindles scale with cell size, but less is known about the scaling of actin structures within cells. Actin-rich denticle precursors cover the ventral surface of the Drosophila embryo and larva and provide templates for cuticular structures involved in larval locomotion. Using quantitative imaging and statistical modeling, we demonstrate that denticle number and spacing scale with cell length over a wide range of cell sizes in embryos and larvae. Denticle number and spacing are reduced under space-limited conditions, and both features robustly scale over a 10-fold increase in cell length during larval growth. We show that the relationship between cell length and denticle spacing can be recapitulated by specific mathematical equations in embryos and larvae and that accurate denticle spacing requires an intact microtubule network and the microtubule minus end–binding protein, Patronin. These results identify a novel mechanism of microtubule-dependent actin scaling that maintains precise patterns of actin organization during tissue growth.
INTRODUCTION
The organization of macromolecular structures within cells is essential for many cell functions. Precise patterns of subcellular organization are observed in cells of vastly different types, origins, and dimensions. Examples include the stereotyped branching patterns of neurons and bronchial tissues (Taylor and Fallon, 2006; Metzger et al., 2008; Grueber and Sagasti, 2010), the positioning of centrosomes and spindles within cells during oriented cell division (Bergstralh et al., 2013), and the regular spacing of synapses in neurons and nuclei in multinucleate muscle fibers (Atwood et al., 1993; Bruusgaard, 2006; Metzger et al., 2012; Anderson et al., 2013; Gundersen and Worman, 2013). The presence of highly ordered subcellular patterns in diverse cell types suggests that subcellular organization is fundamental to cell function. However, how cells regulate the organization of subcellular structures that are larger than individual molecules, yet smaller than the size of a single cell, is not well understood.
The distributions of macromolecular structures within cells are often established during development and actively maintained as cells change in size and shape during cell and tissue growth. One mechanism that maintains cellular organization is the scaling of macromolecular structures with cell size. Diverse cellular structures have been shown to scale with cell size, including mitotic spindles (Wühr et al., 2008; Carvalho et al., 2009; Hara and Kimura, 2009; Good et al., 2013; Hazel et al., 2013), centrosomes (Greenan et al., 2010; Decker et al., 2011), mitochondria (Rafelski et al., 2012), nuclei (Conklin, 1912; Edens et al., 2013; Hara and Merten, 2015; Jevtic et al., 2015), and nucleoli (Brangwynne et al., 2011; Weber and Brangwynne, 2015). Several classes of models have been proposed to explain macromolecular scaling. These include models in which the size of a structure is controlled by the intrinsic dimensions of its component proteins (molecular ruler models) (Greenan et al., 2010; Xu et al., 2013), by the concentration or availability of specific molecules (limiting-component models; Decker et al., 2011; Goehring and Hyman, 2012; Good et al., 2013; Hazel et al., 2013), or by phase transitions that separate non–membrane bound organelles from the surrounding cytoplasm (Brangwynne et al., 2009, 2011). However, the molecular mechanisms that underlie most scaling phenomena are poorly understood.
Significant progress has been made in elucidating the size scaling of microtubule-based structures, such as mitotic spindles (Levy and Heald, 2015; Marshall, 2015; Reber and Goehring, 2015). Much less is known about the scaling of actin structures, which have crucial roles in cell shape and tissue organization. Cells in Drosophila embryos and larvae generate an array of actin-rich denticle precursors that are distributed across the ventral epidermis (Dickinson and Thatcher, 1997; Dixit et al., 2008; Saavedra et al., 2014). These micron-scale protrusions provide templates for protrusions in the cuticle that contact surfaces in the environment as the larva crawls and may facilitate larval locomotion. Eight bands of cells on the ventral surface of the embryo, guided by segmental patterning factors, organize into columns of rectangular cells that form denticles at their posterior surface (Colosimo and Tolwinski, 2006; Price et al., 2006; Walters et al., 2006; Simone and DiNardo, 2010), a process that requires the activity of the Fat/Dachsous planar cell polarity pathway (Repiso et al., 2010; Donoughe and DiNardo, 2011; Lawlor et al., 2013; Marcinkevicius and Zallen, 2013). Individual cells can produce as many as six denticles, which form through the coalescence of actin filaments from an initially diffuse apical actomyosin network (Price et al., 2006; Walters et al., 2006; Dilks and DiNardo, 2010). How denticles are distributed along the length of the cell so that they efficiently cover the ventral surface of the animal is not known.
Here we investigate how micron-scale actin-based denticle structures are organized within cells and how this organization is maintained as cells grow and change shape during development. Using quantitative imaging and statistical modeling, we show that the organization of denticle precursors within cells is not random. Instead, denticle number and spacing scale with cell length over a 10-fold increase in cell length during larval growth. We demonstrate that denticle spacing is captured by specific mathematical equations and accurate spacing requires an intact microtubule network and the microtubule minus end–binding protein, Patronin. These results identify a novel mechanism of cytoskeletal scaling that maintains spatial patterns of actin organization despite changes in cell shape and size during tissue growth.
RESULTS
Denticle number and spacing scale with cell length in the Drosophila embryo
Actin-based denticle precursors (referred to here as denticles) are distributed throughout the ventral epidermis of the Drosophila embryo in an apparently regular pattern, prefiguring the placement of protrusions in the larval cuticle (Figure 1, A and B). This pattern could arise through several mechanisms. Denticles could form at fixed distances from their neighbors (a constant-spacing model), denticles could be randomly positioned within cells (a random-spacing model), or the distance between denticles could scale with cell size (a scaled-spacing model; Figure 1C). To distinguish between these possibilities, we developed semi-automated tools in ImageJ, MATLAB, and Python to analyze denticle organization in epithelial cells (available as open-source software; see Materials and Methods). With these tools, the user manually delineates markers for denticle position and cell length, and the software automatically generates measurements detailing multiple quantitative properties of each cell. These measurements can be plotted within the toolset or imported into other graphing software for plotting and analysis. Using this toolset, we performed a systematic analysis of denticle organization in many cells in a wide range of genetic backgrounds.
FIGURE 1:

Organization of actin-based denticles in the Drosophila embryo. (A) Denticles localize to the posterior margins of ventral epidermal cells in a regular pattern. Ventral epidermis of a wild-type stage 16 embryo (left), single denticle belt (right). F-actin (phalloidin, red), E-cadherin (green). Ventral views, anterior left. (B) Examples of cells with one to four denticles. Scale bars: 10 µm. (C) Models of denticle organization. (D) Denticle spacing vs. cell length (length of the posterior cell border, parallel to the dorsal–ventral axis) for cells with two to four denticles from embryos at stages 15 and 16. Denticle-to-edge distances plotted for cells with one denticle (distance to the closest dorsal or ventral edge). Lines, best-fit linear regressions. Each dot represents a single denticle–denticle or denticle–edge pair. Data points outside the x- and y-axis ranges (a maximum of 2% of the data points in each plot) are not shown. (E) Denticle positions in vivo (colored lines) were significantly different from uniform random distributions generated by Monte Carlo simulations (gray lines) for cells with one to three denticles (p < 0.05 in 100% of 10,000 Monte Carlo simulations, Kolmogorov-Smirnov test). Cell length was normalized to 100%, 50 simulations/plot shown (n = 130–1,284 cells/denticle class in 12 embryos). See the Supplemental Tables for mean ± SD values (Supplemental Table S1), n values (Supplemental Table S2), best-fit linear regression equations and R2 values (Supplemental Table S3), and Monte Carlo simulations (Supplemental Table S4).
Each denticle belt contains six columns of cells that express distinct combinations of cell fate determinants and display column-specific differences in cell shape, denticle number, and denticle spacing (Supplemental Figure S1, A–E; Alexandre et al., 1999; Walters et al., 2005, 2006; Chanut-Delalande et al., 2006, 2012; Dilks and DiNardo, 2010). Despite these differences, consistent patterns were observed across the entire denticle field (Supplemental Tables S1–S3). Denticles tended to be farther apart in cells with fewer denticles and closer together in cells with more denticles (Supplemental Figure S1F). For cells with the same number of denticles, denticles in longer cells were farther apart on average than denticles in shorter cells (Figure 1D and Supplemental Figure S1G). These results are inconsistent with a constant-spacing model. As an alternative, we tested whether denticles are randomly distributed within cells. In contrast to random distributions generated using Monte Carlo simulations, denticles in embryos were preferentially located at specific positions along the length of the cell (Figure 1E, Supplemental Figures S1H and S2H, and Supplemental Table S4). Together these results demonstrate that denticles are neither uniformly nor randomly distributed in the Drosophila embryo.
As denticle organization in embryos was not consistent with uniform- or random-spacing models, we next tested the possibility that denticle organization scales with cell length. Denticle spacing was positively correlated with cell length over a broad range of values, consistent with a scaled-spacing model (Figure 1D). In addition, the number of denticles per cell also increased with cell length. Shorter cells had only one denticle, whereas longer cells generated as many as six, with a new denticle added for every ∼2 μm increase above a minimum cell length (Supplemental Figure S1K). These results demonstrate that two properties of cells, denticle number and spacing, scale isometrically with cell length, indicating that denticle cells display a scaled organization of the actin cytoskeleton.
The relationship between denticle spacing and cell length is captured by a single scaling equation in wild-type embryos
We next sought to determine whether there is a mathematical scaling relationship between denticle spacing, denticle number, and cell length. Cell length (L) is equal to the sum of the denticle-to-edge (αD) and denticle-to-denticle (D) distances, in which α is the ratio between these distances, defined as the spacing ratio. In a scaled-spacing model, the average distance between denticles is represented by the equation D = L/(2α + N – 1) (Figure 2A). We developed code in MATLAB (MathWorks) to systematically compare in vivo denticle distributions to a wide range of predicted scaling patterns using simulations (available as open-source software; see Materials and Methods). By simulating denticle organization using different values for α (Figure 2A, left), we identified spacing ratios that recapitulate the in vivo denticle distributions. For modeling the accuracy of denticle spacing, denticle positions were drawn from a normal distribution centered on the distance predicted by the spacing ratio. Varying the width of this distribution using an SD term (σ) alters the size of the region to which denticles are assigned in simulations (Figure 2A, middle), providing a measure of how accurately denticles achieve the mean spacing distance. This simulation approach has advantages over solving for single values for α and σ because it identifies a range of values for α and σ that are consistent with in vivo observations, accounting for sample size and variability. This statistical modeling approach represents a generally applicable method for studying the organization of any periodic structure.
FIGURE 2:

A statistical model recapitulates key features of denticle scaling. (A) Models for denticle spacing (D) varying the spacing ratio (α) and SD (σ). Cell length (L) and denticle number (N) were measured in vivo. (B) Percentage of simulations that were significantly different from (p < 0.05, blue) or consistent with (p ≥ 0.05, yellow) in vivo distributions. Plot varies α for σ = D/6. The α = 2/3, σ = D/6 model (arrowhead) was most similar to the data for wild-type (WT) embryos (p ≥ 0.05 in 94.1% of simulations, Kolmogorov-Smirnov test). (C) Cumulative distribution plot for models varying the spacing ratio (α) for σ = D/6. One thousand simulations are shown for each model. Black line, in vivo measurements for WT embryos. (D) The spacing ratio (α) increases with increasing denticle number in embryos (black) and larvae (red). See the Supplemental Tables for a summary of the modeling outcomes in B and C (Supplemental Table S5) and D (Supplemental Table S6).
We simulated denticle placement for 40 combinations of α and σ, starting with the observed cell length and denticle number measurements in wild-type embryos, and then predicted the distances between denticles using simulations. We performed 10,000 simulations for each combination of α and σ and compared the simulated distributions with the in vivo patterns using the Kolmogorov-Smirnov test (Supplemental Table S5 and Supplemental Figures S3 and S4). Comparisons with p ≥ 0.05 indicate that the simulated distribution is not significantly different from and is therefore consistent with the in vivo pattern. Models were considered to fit the data if the percent of simulations that were not significantly different from the in vivo pattern was greater than an empirically defined cutoff value. We found that denticle spacing in wild-type embryos was most similar to a model with a spacing ratio of α = 2/3 and an SD of σ = D/6 (p ≥ 0.05 in 94.1% of simulations; Figure 2, B and C, Supplemental Figures S3A and S4A, and Supplemental Table S5). Therefore, despite variations in cell size, shape, and denticle number across the denticle field, a single mathematical equation largely captures the relationship between cell length and denticle spacing in wild-type embryos.
The finding that a spacing ratio of α = 2/3 recapitulates the distribution of denticles in wild-type embryos is consistent with a mechanism in which denticles spread out to achieve the maximum separation along the length of the cell, with some edge effect. We note that denticle placement in vivo was also slightly asymmetric with respect to the dorsal and ventral cell boundaries, with denticles generally located closer to the dorsal boundary (Supplemental Figure S1, I and J). This dorsal–ventral asymmetry could be present during denticle formation, or it could arise after denticle formation is completed due to cell-shape changes and junctional remodeling in the ventral epithelium (Marcinkevicius and Zallen, 2013). This asymmetry did not affect the comparison of denticle spacing between measurements and simulations, as the model only assumes that the average of the denticle-to-edge values is equal to αD.
Denticle spacing scales with cell length under space-limited conditions
As denticle spacing scales with cell length in wild-type embryos, we next tested whether denticle organization accurately scales under space-limited conditions. To reduce cell size, we analyzed denticle organization in two genetic backgrounds that produce aberrantly small cells due to an additional cell division. These were the haploid progeny of ms(3)k81 males, which undergo an extra cell division in early embryogenesis, and embryos that overexpress Cyclin E, which have an extra division in midembryogenesis (Yasuda et al., 1995; Parker, 2006). The average cell length in ms(3)k81 and Cyclin E-overexpressing (CycE-OE) embryos was reduced by 35 and 28%, respectively (Figure 3, A and C, and Supplemental Table S1). The number of denticles per cell was also significantly reduced in both backgrounds, with nearly twice as many cells producing only one denticle compared with wild type, and very few cells producing three or more denticles (Figure 3B). Cells with no denticles were never observed, even in extremely small cells. In addition, denticle spacing was significantly reduced in ms(3)k81 and CycE-OE embryos (Supplemental Figure S2, B and C). For cells with two denticles, the mean cell length was reduced by 14 to 20% and the mean distance between denticles was reduced by 18% compared with wild type (Figure 3, D–F and Supplemental Table S1). The denticle distribution pattern in ms(3)k81 and CycE-OE matched the same spacing ratio (α) and SD (σ) values as in wild type (p ≥ 0.05 in 99.1% and 96.3% of simulations, respectively), although other similar α and σ values also recapitulated the data (Supplemental Figures S3, B and C, and S4, B and C, and Supplemental Table S5). These results demonstrate that denticle number and spacing scale with cell length in mutants with unusually small cells, following the same scaling relationship as in wild type.
FIGURE 3:

Denticle spacing scales with cell length under space-limited conditions in small-cell mutants. (A) Examples of cells with two denticles in wild-type (WT), ms(3)k81 and CycE-OE embryos. F-actin (phalloidin, red), E-cadherin (green). Scale bar: 10 µm. (B) Distribution of cells with one to five denticles in WT, ms(3)k81, and CycE-OE embryos. Cells generate fewer denticles in ms(3)k81 and CycE-OE embryos. (C and D) Cell length (C) and denticle spacing (D) were significantly reduced in ms(3)k81 and CycE-OE embryos compared with WT. Data in D–F shown for cells with two denticles only. Boxes, 25th–75th percentile; whiskers, 1.5 interquartile range (IQR); horizontal line, median; +, mean. *, p < 0.0001 vs. WT, Kruskal-Wallis test with Dunn’s multiple comparison test. (E, F) Denticle spacing vs. cell length for cells with two denticles. Lines, best-fit linear regressions, symbols, means. Data points outside the x- and y-axis ranges (a maximum of 1% of the data points in each plot) are not shown. See the Supplemental Tables for mean ± SD values (Supplemental Table S1), n values (Supplemental Table S2), and best-fit linear regression equations and R2 values (Supplemental Table S3).
Denticle spacing scales over an order-of-magnitude increase in cell length during larval growth
As denticle number and spacing decrease in extremely small cells, we next tested whether denticle scaling mechanisms can function over long length scales in extremely large cells. Cells grow substantially in the Drosophila larval stages, and denticle cells were more than three times longer on average in first-instar larvae than in embryos (Supplemental Table S1). Denticle-forming cells at embryonic and larval stages encompassed a more than 10-fold difference in length (Figure 4D). We analyzed the organization of more than 10,000 denticles in first-instar larvae, using fluorescent markers to visualize filamentous actin (F-actin) and cell outlines (Figure 4, A and B). This analysis showed that denticle number and spacing scale with cell length in larvae, extending the trend observed in embryos over longer length scales (Figure 4F). For cells with the same number of denticles, denticles were around twice as far apart in larvae as their average separation in embryos (Supplemental Table S1 and Figure 4F). In addition, the number of denticles per cell increased with cell length in larvae, with a new denticle added for every ∼3 μm increase in cell length above a minimum value (Figure 4C). Individual cells had up to 17 denticles in first-instar larvae, nearly triple the maximum number observed in embryos (Figure 4E). Denticle spacing plateaued in cells with many denticles, suggesting that there may be an optimal spacing distance for denticles that form far from the cell boundaries (Figure 5, A and B). Together these results demonstrate that denticle number and spacing scale over an order-of-magnitude increase in cell length during larval growth.
FIGURE 4:

Denticle spacing scales over long length scales in larval cells. (A, B) Denticle belt (A) and examples of cells (B) from a first instar wild-type (WT) larva. Denticles were visualized with a marker for F-actin (utrophin-GFP), and cell outlines were visualized with E-cadherin-GFP. Scale bars: 10 µm. (C) Denticle number increases with cell length in larval cells. Boxes, 25th–75th percentile; whiskers, 1.5 interquartile range (IQR); horizontal line, median; +, mean. (D, E) Cell length (D) and number of denticles/cell (E) in WT embryos (black) and larvae (red), n = 3092 cells in 12 embryos, 2150 cells in 18 larvae (p < 0.0001, Kruskal-Wallis test with Dunn’s multiple comparison test). (F) Denticle spacing vs. cell length for cells with two to five denticles. Embryos (gray), larvae (colors). The lines shown are best-fit linear regressions for the larval data. Data points outside the x- and y-axis ranges (a maximum of 1% of the data points in each plot) are not shown. See the Supplemental Tables for mean ± SD values (Supplemental Table S1), n values (Supplemental Table S2), and best-fit linear regression equations and R2 values (Supplemental Table S3).
FIGURE 5:

The accuracy of denticle spacing is maintained in embryos and larvae. (A) Denticle spacing plateaus over long length scales in larvae (red). Gray, data for wild-type (WT) embryos. Best-fit curve to all the data, y = −4.6*e-0.057x + 5.730. (B) Denticle spacing decreases with denticle number. Boxes, 25th–75th percentile; whiskers, 1.5 interquartile range (IQR); horizontal line, median; +, mean. (C) The total summed denticle area is not correlated with cell area. y = 0.01x + 17.2; R2 = 0.06. (D) The total summed denticle diameter correlates with cell length. Best-fit linear regression, y = 0.3x + 1.9; R2 = 0.5. Cells with five denticles are highlighted in blue to show the distribution of a representative cell class. (E) Residuals for the best-fit linear regressions for wild-type embryos (gray) and larvae (red). Dotted lines indicate 3, 0, and −3 μm values. (F) Absolute error of denticle spacing relative to the best-fit linear regressions for wild-type embryos and larvae. The absolute error was slightly increased for cells with two or three denticles in larvae compared with embryos (p < 0.05, Kruskal-Wallis test with Dunn’s multiple comparison test). (G) Denticle spacing increases for larger denticles. Best-fit linear regression (red), y = 2.5x + 0.2; R2 = 0.48. For A, B, E, and F, see Supplemental Table S2 for n values. For C, D, and G, n = 1513 denticles in 223 cells from three larvae. Data points in C and D show summed measurements for all denticles each cell; data points in G show individual measurements for each denticle.
We next asked whether the scaling of denticle number and size are consistent with a limiting-component model. The simplest prediction of the limiting-component model is that the total volume of denticles in a cell should scale with cell volume. However, denticle volume is difficult to measure directly, due to the irregular shape of denticle structures. As an approximation of denticle size, we measured the cross-sectional area of denticles and compared this with the apical area of denticle-forming cells. As cells in the epithelial sheet are predicted to have a constant height, apical cell area should be proportional to cell volume. The total denticle area did not correlate with cell area in larval cells (Figure 5C), suggesting that a limiting-component model in its simplest form does not accurately describe the scaling of total denticle area in larval cells. However, the summed diameters of all denticles in the cell showed a positive correlation with cell length (Figure 5D). Denticle diameter was also positively correlated with the distance between denticles: larger denticles tended to be farther apart, whereas smaller denticles tended to be closer together (Figure 5G). Therefore a modified limiting-component model could theoretically account for the scaling of denticle size and number, if the amount of this component is proportional to the length of the cell.
We next used our statistical modeling approach to test whether the spacing ratio is a constant value in all denticle cells, or whether this ratio varies in different subsets of cells. The simulations that most closely resembled the denticle distribution in larvae had a spacing ratio of α = 0.8, which was larger than the spacing ratio of 2/3 in embryos (p ≥ 0.05 in 95.7% of simulations; Supplemental Table S5 and Supplemental Figures S3G and S4G). As different spacing ratios recapitulated the data in embryos and larvae, this suggests that the spacing ratio is not a constant value. Because larval cells produce more denticles, we postulated that the spacing ratio could vary with denticle number. To test this idea, we performed simulations for cells with different numbers of denticles and found that the spacing ratio was larger for cells with more denticles in both embryos and larvae (Figure 2D). For cells with the same number of denticles, larval cells had a larger spacing ratio (Figure 2D and Supplemental Table S6). As larval cells are longer than embryonic cells on average (Figure 4D), and cells with more denticles are usually longer than cells with fewer denticles (Supplemental Figure S1, K and L), these results are consistent with the idea that the spacing ratio could be a cell length–dependent parameter.
We next analyzed the accuracy of denticle spacing, or how closely denticles achieve the optimal spacing distance for cells of a given length. To measure the accuracy of spacing, we analyzed the absolute error of denticle spacing, which is the difference between the observed denticle spacing distance and the distance predicted by the best-fit regression line. We found that the absolute error was less than 1 µm on average in embryos and larvae (Figure 5F). Although the absolute error of denticle spacing was slightly higher in larvae compared with embryos, the error relative to cell length or the predicted spacing distance was lower, despite the greater distance between denticles in larvae (Figure 5F and Supplemental Figure S1, M and N). Similarly, the scatter of the residuals distribution, measured as the difference between the observed denticle spacing distance and the best-fit regression lines, did not increase over a severalfold increase in cell length (Figure 5E and Supplemental Figure S2, F and G). Consistent with these findings, the SD in simulations that most closely matched the in vivo denticle distribution was a smaller fraction of the denticle spacing distance in larvae (σ = D/8) than in embryos (σ = D/6; Supplemental Figures S1, M and N, S3, A and G, S4, A and G, and Supplemental Table S5). Together these results demonstrate a remarkably precise control of denticle organization, in which the accuracy of denticle spacing is maintained when denticles are organized over extremely long length scales in larval cells.
Denticle spacing is established at the same time as denticle formation
These results suggest the presence of a mechanism that maintains accurate denticle spacing in Drosophila embryos and larvae. To gain insight into this mechanism, we first used time-lapse imaging to determine when denticle spacing is established in the embryo. Denticles form through the coalescence of an apical actin meshwork into a single dense structure (Price et al., 2006; Walters et al., 2006; Donoughe and DiNardo, 2011). If the placement of future denticles is determined before the denticles form, then denticles should initiate at the optimal spacing distance at the earliest stages of denticle formation. Alternatively, if denticle spacing mechanisms act during or after denticle formation, then denticles are predicted to form at a range of positions and move into the optimal spacing configuration. To determine when denticle spacing is first established, we imaged denticle formation in embryos expressing fluorescent markers for F-actin and cell outlines (Figure 6, A–C, Supplemental Figure S6, A–H, and Supplemental Videos S1–S3). Denticle formation occurred as small- to medium-sized mobile foci emerged from the apical actin meshwork and coalesced into larger aggregates. In the majority of cells (23/32 cells), the positioning of denticles was concomitant with actin coalescence. At early time points, small- to medium-sized actin foci moved toward each other until they collided to form larger precursors. This aggregation was accompanied by a large shift in denticle precursor position. At later time points, as denticle precursors increased in size, adjustments of denticle position declined in frequency and magnitude over time. In a smaller fraction of cells (9/32 cells), only minor adjustments were made to denticle placement during the imaging window. In all cases, denticle position stabilized after the majority of F-actin had accumulated in denticles. Small and intermediate-sized actin foci often displayed dynamic changes in position, but only small shifts in position were observed at later stages once larger precursors had formed. Together these results suggest that denticle spacing is established at the same time as denticle formation, as F-actin structures coalesce to form stable denticle precursors.
FIGURE 6:

Denticles refine their position as they form and colocalize with microtubule minus end–associated proteins. (A–C) Traces of actin foci during denticle formation (mid- to late stage 14), relative to the total length of the cell (top row) and kymographs (bottom row) of individual denticle cells. Green, utrophin-GFP to label F-actin; red, E-cadherin-Tomato. Each color represents a unique actin focus that has been tracked over time. n = 32 cells analyzed from six embryos. (D) The microtubule minus-end marker Patronin-GFP localizes to sites of denticle formation (stage 15). Brackets, denticle belts; arrowheads, denticle column 5. (E) Mud is enriched in the regions immediately surrounding sites of denticle formation (late stage 14). Green (Mud), red (F-actin), blue (E-cadherin). (F) The microtubule plus-end marker EB1-GFP localizes to dynamic puncta that are distributed throughout the apical cellular domain (late stage 14). Green (EB1-GFP) and red (Moesin-mCherry) expressed in column 1 cells with en-Gal4. Scale bars: 10 µm in A–C; 5 µm in D–F. See also Supplemental Figure S6 and Supplemental Videos S1–S4.
Denticles colocalize with microtubule minus end–binding proteins
The scaling of denticle number and spacing with cell length in Drosophila embryos and larvae suggests the presence of a molecular mechanism that actively establishes and maintains denticle organization patterns during tissue growth. We speculated that this mechanism could involve microtubules, as microtubules colocalize with actin at the base of each denticle (Price et al., 2006), and apical microtubules are oriented parallel to the long axis of the cell (Dickinson and Thatcher, 1997; Marcinkevicius and Zallen, 2013). To examine the organization of microtubules in denticle cells, we analyzed the localization of three microtubule-associated proteins: Patronin, a microtubule minus end–binding protein (Goodwin and Vale, 2010); EB1, a microtubule plus end–binding protein; and Mud/NuMA, which interacts with microtubules and with the minus end–directed Dynein–dynactin motor complex (Merdes et al., 1996; Bowman et al., 2006; Izumi et al., 2006; Siller et al., 2006). Patronin–green fluorescent protein (GFP) was enriched at sites of denticle formation (Figure 6D), and Mud was concentrated in a circular domain surrounding the nascent denticles (Figure 6E), suggesting that denticles colocalize with microtubule minus ends. In contrast, the plus-end marker EB1-GFP was present throughout the apical cytoplasm (Figure 6F). Analysis of microtubule dynamics by imaging EB1-GFP localization in time-lapse movies revealed bidirectional movement of EB1 comets around sites of denticle formation (Figure 6F and Supplemental Video S4). Together these results show that microtubules are highly dynamic in the denticle field and suggest that microtubules are organized with their minus ends concentrated at sites of denticle formation.
Alterations to the microtubule cytoskeleton disrupt the accuracy of denticle spacing
To explore whether microtubules are required for denticle organization, we analyzed denticle patterns in embryos in which microtubules were disrupted. Overexpression of the microtubule-severing protein Spastin using the engrailed-Gal4 driver strongly reduced the level of cortical microtubules in column 1 of each denticle belt from stage 14 onward (Figure 7B; 14/14 embryos; Kammermeier et al., 2003; Dilks and DiNardo, 2010). In addition, we expressed a Patronin short hairpin RNA in column 1 cells using engrailed-Gal4, which effectively inhibited Patronin expression (Supplemental Figure S5). Disruption of Patronin, which is predicted to increase microtubule minus-end dynamics (Goodwin and Vale, 2010), did not affect gross microtubule organization (Figure 7E) (7/7 embryos). Denticles formed in Spastin-overexpressing (Spastin-OE) and Patronin-knockdown (Patronin-KD) embryos, but were less uniform in size than in wild type (Figure 7A). These embryos displayed a slight increase in cell length, denticle number, and denticle spacing (Figure 7, C and D, Supplemental Figures S2, D and E, and S7, A–D). Denticle number increased with cell length in Spastin-OE and Patronin-KD embryos, although with some differences compared with wild type (Supplemental Figure S7G). The microtubule-depleted cells in denticle column 1 of Spastin-OE embryos were recapitulated by a model with the same spacing ratio as column 1 cells in wild type (α = 0.6, p ≥ 0.05 in 99.7% of simulations). In contrast, the spacing ratio that best recapitulated the Patronin-KD data was smaller (α = 0.5, p ≥ 0.05 in 99% of simulations; Supplemental Figures S3, D–F, and S4, D–F, and Supplemental Table S5). These data demonstrate that knockdown of Patronin, but not an overall depletion of microtubules, alters the spacing ratio of denticle cells. These results suggest that microtubules from stage 14 onward are not required to establish a wild-type spacing ratio, but an aberrant activity of microtubules at these stages can shift denticle positions closer to the cell boundaries.
FIGURE 7:

Microtubules are required for denticle organization. (A) Column 1 cells from wild-type (WT), Spastin-overexpressing (Spastin-OE), and Patronin knockdown (Patronin-KD) embryos. F-actin (phalloidin, red), E-cadherin (green). (B) Spastin-GFP overexpression with the en-Gal4 driver depletes microtubules in column 1. Green (α-tubulin), red (F-actin), blue (Spastin-GFP). Scale bar: 10 µm. (C, D) Denticle spacing vs. cell length for column 1 cells with three denticles in WT (black) and Spastin-OE or Patronin-KD (green) embryos. Lines, best-fit linear regressions; symbols, means. Data points outside the x- and y-axis ranges (a maximum of 0.3% of the data points in each plot) are not shown. (E) Expression of a Patronin short hairpin RNA transgene using en-Gal4 does not affect the overall organization of column 1 microtubules. Green (α-tubulin), red (Moesin-mCherry labels en-Gal4-expressing cells). Scale bar: 10 µm. (F) Residuals for the best-fit linear regressions for WT, Spastin-OE, and Patronin-KD. Colors indicate cells with two (orange), three (green), four (dark blue), five (light blue), or six denticles (purple). (G) Absolute error of spacing relative to the best-fit linear regressions. Boxes, 25th–75th percentile; whiskers, 1.5 interquartile range (IQR); horizontal line, median; +, mean. *, p < 0.001 compared with WT, Kruskal-Wallis test with Dunn’s multiple comparison test. See the Supplemental Tables for mean ± SD values (Supplemental Table S1), n values (Supplemental Table S2), and best-fit linear regression equations and R2 values (Supplemental Table S3).
Notably, disruption of microtubules in Spastin-OE and Patronin-KD embryos significantly decreased the accuracy of denticle spacing. Both perturbations caused a marked increase in the scatter of residuals around the best-fit regression line (Figure 7F) and a significant increase in absolute and relative error measurements (Figure 7G and Supplemental Figure S7, E and F). Consistent with the reduced accuracy of denticle spacing, the model that best recapitulated the data for Spastin-OE had a larger SD than in wild type (σ = D/5; Supplemental Figures S3, D and E, and S4, D and E, and Supplemental Table S5). These results demonstrate that two independent perturbations of the microtubule cytoskeleton significantly reduce the accuracy of denticle spacing and show that disruptions of the microtubule cytoskeleton affect distinct aspects of the denticle pattern.
DISCUSSION
The organization of cytoskeletal structures is essential for cell and tissue function, but the mechanisms that regulate the large-scale organization of actin structures within cells are not well understood. Here we demonstrate that the regular distribution of actin-rich denticle structures in the Drosophila embryo is actively established and maintained during larval growth. Actin organization is dynamically refined as filamentous actin precursors coalesce to form denticles, and both the number of denticles per cell and the distance between them scale with cell length over a broad range. Both properties decrease with reduced cell length in mutants with small cells and robustly scale over a 10-fold increase in cell length during larval growth. The relationship between cell length and denticle positioning can be recapitulated by simple mathematical equations and two independent disruptions of the microtubule cytoskeleton disrupt the accuracy of spacing. These results demonstrate that denticle spacing is not a fixed property of denticle-forming cells but is actively modulated in response to the dimensions of the cell, producing stable patterns of tissue-level actin organization despite substantial changes in cell shape and size during development.
How do cells control the distance between denticles? Several mechanisms of denticle spacing can be evaluated in light of the data presented here. Molecular rulers have been proposed to determine the spacing of multiple subcellular structures, including actin bands in axons, which are separated by a fixed distance determined by the length of tetrameric spectrin protein complexes (Xu et al., 2013), and the scaling of mitotic spindles, which is determined by a gradient of the microtubule-associated protein TPXL-1 set by the size of the centrosome (Bird and Hyman, 2008; Greenan et al., 2010). The large variation in denticle spacing distances in Drosophila, which range from ∼2 to 15 μm, is at odds with a molecular ruler model that enforces a strict distance between denticles. These results suggest that different concepts are needed to explain the highly flexible scaling of the number and spacing of denticle actin structures.
The reduced accuracy of denticle spacing in embryos with altered microtubules demonstrates that accurate denticle spacing requires the microtubule cytoskeleton. The mechanisms by which microtubules influence actin organization in the denticle field remain to be determined. The distributions of Patronin, Mud, and EB1 suggest that microtubule minus ends are enriched at sites of denticle formation, with their growing plus ends directed outward, reminiscent of the organization of microtubules at centrosomes and nuclei. These distributions support a model in which denticles could act as noncentrosomal microtubule-organizing centers, with this activity in turn influencing denticle organization within the cell. In this model, growing microtubules originating from denticles could push against the cell cortex and against microtubules emanating from adjacent denticles, stabilizing denticle formation at sites where these pushing forces are balanced. This model is reminiscent of the force-balance models that have been proposed for nuclear positioning in Schizosaccharomyces pombe (Tran et al., 2001) and in the Drosophila oocyte (Zhao et al., 2012). Denticle spacing could also be achieved by pushing forces exerted on denticles by plus end–directed kinesin motors, which could slide apart oppositely oriented microtubules between denticles. Similar roles for plus end–directed motors have been demonstrated for kinesin during myonuclear positioning (Folker et al., 2014) and at the spindle midzone, where the Eg5 kinesin 5 motor slides antiparallel microtubules apart to maintain spindle length (Sharp et al., 1999; Shirasu-Hiza et al., 2004; Kapitein et al., 2005; Mitchison et al., 2005). In both microtubule polymerization-driven and kinesin-based models, the spacing ratio would arise from a balance between microtubule interactions with the cell cortex and microtubule interactions with microtubules from neighboring denticles. Other models in which microtubules position denticles indirectly, such as by regulating the trafficking of other proteins, cannot be ruled out, and microtubules present at earlier stages could play additional roles in establishing the denticle pattern that were not addressed in this study.
Although microtubule-based models could in principle account for the accuracy and scaling of the denticle pattern, the scaling of denticle number is less easily explained by this class of models. Denticle number still scales with cell length when microtubules are disrupted, suggesting that the scaling of denticle number may have a different origin. Limiting-component models propose that the amount of available material sets the size of subcellular structures such as centrosomes (Greenan et al., 2010; Decker et al., 2011; Goehring and Hyman, 2012) and mitotic spindles (Good et al., 2013; Hazel et al., 2013), allowing these structures to scale with cell volume. Although denticle area does not display a consistent relationship with cell area, the summed diameter of denticles correlates with cell length. These results suggest that a limiting component generated along the length of the cell, such as at the posterior cell cortex, could account for the scaling of denticle number.
An alternative model is suggested by the highly dynamic nature of denticle formation, which raises the possibility that denticle number could be regulated by an actomyosin-based stochastic capture mechanism. Denticles emerge from an initially diffuse apical actin meshwork through the condensation of small clusters of actin and myosin (Price et al., 2006; Walters et al., 2006; Donoughe and DiNardo, 2011). We show that actin foci are highly mobile and can shift position, disappear, and collide with one another and merge to form larger, stable denticle precursors. This is reminiscent of the behavior of actomyosin networks in vitro, in which actin aggregates coalesce into dense foci in the presence of myosin motors (Soares e Silva et al., 2011; Thoresen et al., 2011). An actomyosin-driven capture and clustering mechanism that acts over a defined length scale could produce denticle-number scaling within cells. Turing reaction–diffusion mechanisms are a related class of models that can give rise to periodic actin structures (Kondo and Miura, 2010; Green and Sharpe, 2015; Hiscock and Megason, 2015). In these models, proteins that regulate actin cross-linking, stability, and mobility and have distinct ranges of action within the cell could influence the number of stable actin structures that arise from a diffuse apical pool of actin filaments.
The precise organization of denticle structures in the Drosophila embryo and larva raise the question of what is the significance of this actively generated pattern. Transient actin denticle precursors are translated into permanent protrusions that are distributed across ventral surface of the larval cuticle and contact the underlying substrate as the larva crawls. Although the functions of these structures have not been studied, the regular placement of denticles may help larvae to gain traction on a wide range of surfaces as they search for food in their environment. In principle, regularly distributed contacts with the substrate may provide better traction than a system in which these contacts are irregularly distributed or clustered. Regularly spaced protrusions are observed in many animals, such as the spines of geckos, shark skin denticles, and the ventral scales of snakes, suggesting that these structures may have evolutionarily important functions (Klein and Gorb, 2012; Schmidt and Gorb, 2012; Spinner et al., 2013; Wen et al., 2015). Future studies investigating how denticle protrusions form and scale using live-imaging approaches, combined with genetic methods to uncover the molecular basis of this actin scaling process, will help to reveal the diversity of mechanisms that govern actin organization within cells. These studies may provide insight into the regulation of other periodic structures, such as synapses and neurite branches in neurons (Grueber and Sagasti, 2010), the distribution of organelles involved in carbon fixation in bacteria (Savage et al., 2010), and the organization of lipid homeostasis and oxidative reactions in eukaryotic cells (Lin et al., 2016).
MATERIALS AND METHODS
Fly stocks and genetics
Embryos were grown at 22–25°C and were analyzed at stages 15–16, except for Figure 6 and Supplemental Figure S6, as indicated. y, w was the wild-type control for embryos, sqh-GFP-utrophin-ABD; ubi-E-cadherin-GFP (Oda and Tsukita, 2001; Rauzi et al., 2010) was the wild-type control for larvae. For generation of CycE-OE embryos, UAS-CycE; UAS-p35 or UAS-p35; UAS-CycE males were crossed to daughterless-Gal4 females, and the progeny were analyzed. UAS-p35 stocks were gifts of B. Edgar and UAS-CycE stocks were gifts of B. Edgar and H. Richardson, obtained from the Bloomington Drosophila Stock Center. No significant differences were observed between these genotypes, and the results were combined for analysis. For generation of ms(3)k81 embryos, ms(3)k811/Df(3R)ED6255 or ms(3)k81Z3416/Df(3R)ED6255 males were crossed to y, w females. The ms(3)k81 stocks were gifts of B. Wakimoto (Department of Biology, University of Washington, Seattle; Yasuda et al., 1995). No significant differences were observed between the progeny of ms(3)k811 and ms(3)k81Z3416 hemizygous males, and the results were combined for analysis. For Spastin-OE, UAS-Spastin-EGFP/TM3 (Jankovics and Brunner, 2006) or UAS-Spastin-CFP/TM3 (Du et al., 2010) was crossed to engrailed-Gal4, UAS-moesin-mCherry or engrailed-Gal4. No significant differences were observed between these genotypes, and the results were combined for analysis. For Patronin-KD, y1, sc*, v1; P{TRiP.HMS01547}attP2 (Ni et al., 2011) was crossed to engrailed-Gal4, UAS-moesin-mCherry. Patronin-GFP stocks were w*; P{Ubi-p63E-Patronin.A.GFP}1M/CyO and w*; P{Ubi-p63E-Patronin.A.GFP}3M/TM3, Sb (gifts of J. Scholey, Department of Molecular and Cell Biology, University of California, Davis, obtained from the Bloomington Drosophila Stock Center). For EB1-GFP experiments, UAS-EB1-GFP/TM3 (gift of N. Bulgakova and N. Brown, The Gurdon Institute, University of Cambridge, Cambridge, UK; Bulgakova et al., 2013) was crossed to engrailed-Gal4, UAS-moesin-mCherry. Denticle formation was imaged in E-cadherin-Tomato, utrophin-GFP embryos (Saavedra et al., 2014).
Embryo preparation
Embryos were dechorionated in 50% bleach for 2 min and washed with water. For live-imaging experiments, dechorionated embryos were mounted between a coverslip and a gas-permeable membrane (YSI, Yellow Springs, OH) in halocarbon 27 oil (Sigma). For immunofluorescence, embryos were fixed with vigorous shaking in a 1:1 mix of 37% formaldehyde and heptane for 7 min, and manually devitellinized. Embryos were stained in 1X phosphate-buffered saline or 0.1 M Na2HPO4 (pH 7.2) (for E-cadherin antibodies) and mounted in Prolong Gold (Molecular Probes). Primary antibodies were rat anti-E-cadherin (1:50, Developmental Studies Hybridoma Bank [DSHB]), rabbit anti-GFP (1:100, Torrey Pines Biolabs), mouse anti–α-tubulin (1:500, DSHB), and rabbit anti-mud (1:50, gift of F. Matsuzaki, RIKEN Center for Developmental Biology, Kobe, Japan; Izumi et al., 2006), and were detected with Alexa Fluor 488-, 546-, 568-, and 647-conjugated secondary antibodies (1:500, Molecular Probes). F-actin was visualized with Alexa Fluor 488-, 546-, 568-, or 647-conjugated phalloidin (1:1000, Molecular Probes) or Alexa Fluor 405-conjugated phalloidin (1:1000, Santa Cruz). Guinea pig anti-Bazooka (Par-3) (1:500) (Blankenship et al., 2006) was included with phalloidin in the red channel in Figure 7B but is not visible at the gain shown. Analysis of denticle cells was conducted on abdominal segments 3–7.
Larval preparation
Larvae were rinsed with water, placed on a coverslip in halocarbon 27 oil (Sigma), anesthetized using dry ice or ether, and then selected based on the presence of denticles in the GFP channel. For experiments using cold as an anesthetic, larvae were immobilized by applying dry ice to the underside of the coverslip. Selected larvae were transferred to a fresh coverslip, oriented ventral side down, and gently flattened between the coverslip and a glass slide. Larvae were kept immobile during imaging with direct application of ice. For experiments using ether as an anesthetic, larvae were placed in a Falcon tube containing a cotton ball with several drops of ether for several minutes. Selected larvae were then transferred to a custom-built chamber (Heemskerk and DiNardo, 1994; Füger et al., 2007) in halocarbon oil, oriented ventral side down, and flattened between the dish bottom and a coverslip. A drop of ether was added, and the chamber was sealed with vacuum grease (Corning) and parafilm.
Image acquisition
Images of fixed embryos were single Z-planes acquired with a PlanNeofluor 40×/1.3 NA oil objective (Zeiss) at 1.8× zoom (1 airy unit). Images of larvae were Z-stacks acquired with a PlanNeofluor 40×/1.3 NA oil objective (Zeiss) at 1× or 1.3× zoom (1 airy unit). Imaging was performed on an LSM700 or LSM710 confocal microscope (Zeiss). Movies of living embryos were acquired with a Plan-APOCHROMAT 100x/1.4 oil objective (Zeiss) on a Perkin Elmer Ultra-View VOX spinning disk confocal. The mCherry-Moesin, EB-1 images were acquired at 2 to 4 s intervals (maximum possible speed), with 3–12 z-sections acquired at 0.5 µm steps at each time point. The E-cadherin-Tomato, utrophin-GFP images were acquired at 30 s intervals, with 6–15 z-sections acquired at 0.5 µm steps at each time point. Images were projected using a maximum-intensity projection in ImageJ (Schneider et al., 2012) and were converted from multichannel Zeiss .lsm or Volocity format to composite RGB TIFF in ImageJ. For fixed embryo and larval imaging experiments, the PhotoMerge automated algorithm in Photoshop was used to create a single image of each animal for further analysis. For live imaging of EB1-GFP, images were exported as time series from Volocity, projected using a maximum intensity Z-projection in ImageJ, and registered via fiducial markers using SIESTA (Fernandez-Gonzalez and Zallen, 2011).
Quantification of denticle organization
The positions of denticles and the dorsal and ventral ends of the posterior cell boundaries were manually identified and recorded using the ImageJ CellCounter plug-in. Cell length was measured as the length of a straight line connecting the dorsal and ventral ends of the posterior margin of each cell. Custom MATLAB code was used to organize the data based on column and cell of origin, calculate cell length from the dorsal and ventral posterior markers, calculate distances between adjacent denticles, and perform basic measurements and statistics (MathWorks). Graphs and statistical tests were generated using Prism (GraphPad) and matplotlib, seaborn, and scipy in Python 3.5.2. Best-fit linear regressions were generated in Prism or using scipy for each category of denticle cells with more than five cells. The spacing error was calculated relative to the best-fit linear regressions for each class of denticle cells for each genotype.
Quantification of denticle size
Individual cells were manually identified as regions of interest (ROIs) in ImageJ. Cell length was measured for each cell by drawing a line between the dorsal and ventral ends of the posterior boundary, and cell area was obtained from the specified ROI. The 3DObject counter plug-in (Bolte and Cordelieres, 2006) was then used to identify and calculate the area of each denticle in each cell of interest. Denticle diameter was back-calculated from area, under the assumption that ROIs were circular.
Modeling and statistics
p Values for comparisons for measurements of denticle spacing, cell length, and denticle number were calculated using a Kruskal-Wallis test with Dunn’s multiple comparison test or a two-tailed Student’s t test. Regressions were calculated using a least-squares linear regression analysis. Monte Carlo simulations were performed using custom Python code, and distributions were compared using two-sample Kolmogorov-Smirnov tests in Python (scipy.stats.ks_2samp).
The relationship between the denticle spacing distance (D), cell length (L), and the number of denticles (N) was derived from the following equation, in which α is the ratio between the denticle–cell edge distance and the denticle–denticle distance (the spacing ratio), as follows:
|
|
We extended this to the general case by assuming that all the denticle separation distances for a single cell are equal, which allowed us to obtain a general equation for calculating D with respect to L, N, and α:
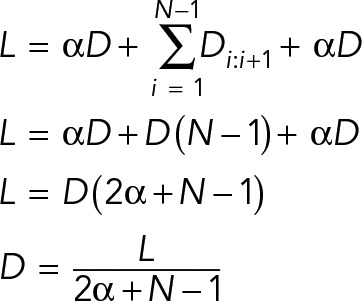 (2) (2)
|
In addition, the relative position of each denticle in the cell is captured by the following equation:
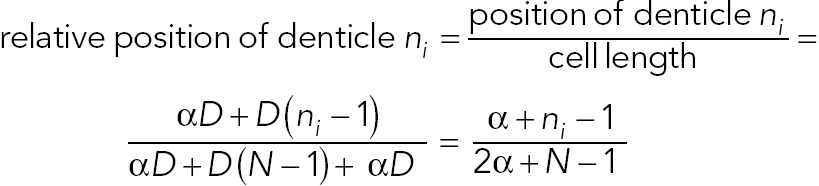 (3) (3)
|
We created a statistical model in Python based on Eq. 2 to test which value(s) of α most closely captured the relationship between D, L, and N in vivo. For each (L,N) pair in the data set and each value of α in simulations 0.5, 0.6, 2/3, 0.7, 0.75. 0.8, 0.9, 1, we calculated the mean separation distance (Dmean) and the positions for each denticle ni (µi). We then sampled from normal distributions with µ = µi and σ = Dmean/5, Dmean/6, Dmean/7, Dmean/8, Dmean/9 to obtain the positions of each denticle. Data from each simulated model were compared with the in vivo data using the Kolmogorov-Smirnov test (scipy.stats.ks_2samp). For each model, 10,000 simulations of 1100–3100 cells each (based on the number of in vivo measurements in Supplemental Table S2) were performed. Simulations were considered consistent with the in vivo data sets if they were not significantly different (p ≥ 0.05) from the data. The model with the greatest number of simulations consistent with the in vivo data was considered to be the best-fitting model. All accepted and best-fitting models had greater than 94% of simulations with p ≥ 0.05. The source code for analyzing denticle positions in vivo and for in silico statistical modeling can be found at https://github.com/ZallenLab/denticleorganization.
For all analyses, the cell length L along the dorsal–ventral axis was defined as the distance between manually defined dorsal and ventral cell edge markers. In some cells, denticles did not fall along a straight line due to cell or embryo curvature, and therefore L differed slightly from the summation of the individual distances as in Eq. 1. Similar α values where obtained when α was directly calculated using a least-squares estimate of Eq. 2: 0.715 in wild-type embryos, 0.715 in CycE-OE embryos, 0.66 in ms(3)k81 embryos, 0.66 in Spastin-OE embryos, 0.6 in Patronin-KD embryos, and 0.94 in wild-type larvae.
Supplementary Material
Acknowledgments
We thank Karen Kasza for suggesting the D = L/(N + 1) model; Eric Brooks, Brendan Tracey, and Dene Farrell for helpful discussions; Venkatraman Seshan for statistical advice; Barbara Wakimoto, Nina Sherwood, and Peter Lawrence for reagents; and Eric Brooks, Maria Bustillo, Karen Kasza, Zachary Mirman, Prashant Monian, Adam Paré, Will Razzell, Germán Sabio, Masako Tamada, Athea Vichas, and Richard Zallen for comments on the paper. Stocks from the Bloomington Drosophila Stock Center (NIH P40OD018537) and antibodies from the Developmental Studies Hybridoma Bank were used in this study. This work was supported by a National Institutes of Health (NIH)/National Institute of General Medical Sciences R01 grant (GM102803 to J.A.Z.) and an NIH/National Cancer Institute Cancer Center Support Grant (P30 CA008748). A.K.S. was supported by a Gerstner Sloan Kettering Grayer Fellowship, and A.J.S. was supported by the Tri-Institutional PhD Program in Computational Biology and Medicine (via NIH training grant T32 GM083937). J.A.Z. is an Investigator of the Howard Hughes Medical Institute.
Abbreviations used:
- F-actin
filamentous actin
- GFP
green fluorescent protein
- KD
knockdown
- OE
overexpressing
- ROI
region of interest.
Footnotes
This article was published online ahead of print in MBoC in Press (http://www.molbiolcell.org/cgi/doi/10.1091/mbc.E16-10-0691) on April 12, 2017.
REFERENCES
- Alexandre C, Lecourtois M, Vincent JP. Wingless and Hedgehog pattern Drosophila denticle belts by regulating the production of short-range signals. Development. 1999;126:5689–5698. doi: 10.1242/dev.126.24.5689. [DOI] [PubMed] [Google Scholar]
- Anderson CA, Eser U, Korndorf T, Borsuk ME, Skotheim JM, Gladfelter AS. Nuclear repulsion enables division autonomy in a single cytoplasm. Curr Biol. 2013;23:1999–2010. doi: 10.1016/j.cub.2013.07.076. [DOI] [PMC free article] [PubMed] [Google Scholar]
- Atwood HL, Govind CK, Wu CF. Differential ultrastructure of synaptic terminals on ventral longitudinal abdominal muscles in Drosophila larvae. J Neurobiol. 1993;24:1008–1024. doi: 10.1002/neu.480240803. [DOI] [PubMed] [Google Scholar]
- Bergstralh DT, Haack T, St Johnston D. Epithelial polarity and spindle orientation: intersecting pathways. Philos Trans R Soc B Biol Sci. 2013;368:20130291–20130291. doi: 10.1098/rstb.2013.0291. [DOI] [PMC free article] [PubMed] [Google Scholar]
- Bird AW, Hyman AA. Building a spindle of the correct length in human cells requires the interaction between TPX2 and Aurora A. J Cell Biol. 2008;182:289–300. doi: 10.1083/jcb.200802005. [DOI] [PMC free article] [PubMed] [Google Scholar]
- Blankenship JT, Backovic ST, Sanny JSP, Weitz O, Zallen JA. Multicellular rosette formation links planar cell polarity to tissue morphogenesis. Dev Cell. 2006;11:459–470. doi: 10.1016/j.devcel.2006.09.007. [DOI] [PubMed] [Google Scholar]
- Bolte S, Cordelieres FP. A guided tour into subcellular colocalization analysis in light microscopy. J Microsc. 2006;224:213–232. doi: 10.1111/j.1365-2818.2006.01706.x. [DOI] [PubMed] [Google Scholar]
- Bowman SK, Neumuller RA, Novatchkova M, Du Q, Knoblich JA. The Drosophila NuMA homolog Mud regulates spindle orientation in asymmetric cell division. Dev Cell. 2006;10:731–742. doi: 10.1016/j.devcel.2006.05.005. [DOI] [PubMed] [Google Scholar]
- Brangwynne CP, Eckmann CR, Courson DS, Rybarska A, Hoege C, Gharakhani J, Jülicher F, Hyman AA. Germline P granules are liquid droplets that localize by controlled dissolution/condensation. Science. 2009;324:1729–1732. doi: 10.1126/science.1172046. [DOI] [PubMed] [Google Scholar]
- Brangwynne CP, Mitchison TJ, Hyman AA. Active liquid-like behavior of nucleoli determines their size and shape in Xenopus laevis oocytes. Proc Natl Acad Sci USA. 2011;108:4334–4339. doi: 10.1073/pnas.1017150108. [DOI] [PMC free article] [PubMed] [Google Scholar]
- Bruusgaard JC. Distribution of myonuclei and microtubules in live muscle fibers of young, middle-aged, and old mice. J Appl Physiol. 2006;100:2024–2030. doi: 10.1152/japplphysiol.00913.2005. [DOI] [PubMed] [Google Scholar]
- Bulgakova NA, Grigoriev I, Yap AS, Akhmanova A, Brown NH. Dynamic microtubules produce an asymmetric E-cadherin–Bazooka complex to maintain segment boundaries. J Cell Biol. 2013;201:887–901. doi: 10.1083/jcb.201211159. [DOI] [PMC free article] [PubMed] [Google Scholar]
- Carvalho A, Desai A, Oegema K. Structural memory in the contractile ring makes the duration of cytokinesis independent of cell size. Cell. 2009;137:926–937. doi: 10.1016/j.cell.2009.03.021. [DOI] [PubMed] [Google Scholar]
- Chanut-Delalande H, Fernandes I, Roch F, Payre FF, Plaza S. Shavenbaby couples patterning to epidermal cell shape control. PLoS Biol. 2006;4:e290. doi: 10.1371/journal.pbio.0040290. [DOI] [PMC free article] [PubMed] [Google Scholar]
- Chanut-Delalande H, Ferrer P, Payre FF, Plaza S. Effectors of tridimensional cell morphogenesis and their evolution. Semin Cell Dev Biol. 2012;23:341–349. doi: 10.1016/j.semcdb.2012.03.002. [DOI] [PubMed] [Google Scholar]
- Colosimo PF, Tolwinski NS. Wnt, Hedgehog and junctional Armadillo/β-catenin establish planar polarity in the Drosophila embryo. PLoS One. 2006;1:e9. doi: 10.1371/journal.pone.0000009. [DOI] [PMC free article] [PubMed] [Google Scholar]
- Conklin EG. Cell size and nuclear size. J Exp Zool. 1912;12:1–98. [Google Scholar]
- Decker M, Jaensch S, Pozniakovsky A, Zinke A, O’Connell KF, Zachariae W, Myers EW, Hyman AA. Limiting amounts of centrosome material set centrosome size in C. elegans embryos. Curr Biol. 2011;21:1259–1267. doi: 10.1016/j.cub.2011.06.002. [DOI] [PubMed] [Google Scholar]
- Dickinson WJ, Thatcher JW. Morphogenesis of denticles and hairs in Drosophila embryos: involvement of actin-associated proteins that also affect adult structures. Cell Motil Cytoskeleton. 1997;38:9–21. doi: 10.1002/(SICI)1097-0169(1997)38:1<9::AID-CM2>3.0.CO;2-4. [DOI] [PubMed] [Google Scholar]
- Dilks SA, DiNardo S. Non-cell-autonomous control of denticle diversity in the Drosophila embryo. Development. 2010;137:1395–1404. doi: 10.1242/dev.045450. [DOI] [PMC free article] [PubMed] [Google Scholar]
- Dixit R, Vijayraghavan K, Bate M. Hox genes and the regulation of movement in Drosophila. Dev Neurobiol. 2008;68:309–316. doi: 10.1002/dneu.20589. [DOI] [PubMed] [Google Scholar]
- Donoughe S, DiNardo S. dachsous and frizzled contribute separately to planar polarity in the Drosophila ventral epidermis. Development. 2011;138:2751–2759. doi: 10.1242/dev.063024. [DOI] [PMC free article] [PubMed] [Google Scholar]
- Du F, Ozdowski EF, Kotowski IK, Marchuk DA, Sherwood NT. Functional conservation of human Spastin in a Drosophila model of autosomal dominant-hereditary spastic paraplegia. Hum Mol Genet. 2010;19:1883–1896. doi: 10.1093/hmg/ddq064. [DOI] [PMC free article] [PubMed] [Google Scholar]
- Edens LJ, White KH, Jevtic P, Li X, Levy DL. Nuclear size regulation: from single cells to development and disease. Trends Cell Biol. 2013;23:151–159. doi: 10.1016/j.tcb.2012.11.004. [DOI] [PubMed] [Google Scholar]
- Fernandez-Gonzalez R, Zallen JA. Oscillatory behaviors and hierarchical assembly of contractile structures in intercalating cells. Phys Biol. 2011;8:045005. doi: 10.1088/1478-3975/8/4/045005. [DOI] [PMC free article] [PubMed] [Google Scholar]
- Folker ES, Schulman VK, Baylies MK. Translocating myonuclei have distinct leading and lagging edges that require kinesin and dynein. Development. 2014;141:355–366. doi: 10.1242/dev.095612. [DOI] [PMC free article] [PubMed] [Google Scholar]
- Füger P, Behrends LB, Mertel S, Sigrist SJ, Rasse TM. Live imaging of synapse development and measuring protein dynamics using two-color fluorescence recovery after photo-bleaching at Drosophila synapses. Nat Protoc. 2007;2:3285–3298. doi: 10.1038/nprot.2007.472. [DOI] [PubMed] [Google Scholar]
- Goehring NW, Hyman AA. Organelle growth control through limiting pools of cytoplasmic components. Curr Biol. 2012;22:R330–R339. doi: 10.1016/j.cub.2012.03.046. [DOI] [PubMed] [Google Scholar]
- Good MC, Vahey MD, Skandarajah A, Fletcher DA, Heald R. Cytoplasmic volume modulates spindle size during embryogenesis. Science. 2013;342:856–860. doi: 10.1126/science.1243147. [DOI] [PMC free article] [PubMed] [Google Scholar]
- Goodwin SS, Vale RD. Patronin regulates the microtubule network by protecting microtubule minus ends. Cell. 2010;143:263–274. doi: 10.1016/j.cell.2010.09.022. [DOI] [PMC free article] [PubMed] [Google Scholar]
- Green JBA, Sharpe J. Positional information and reaction-diffusion: two big ideas in developmental biology combine. Development. 2015;142:1203–1211. doi: 10.1242/dev.114991. [DOI] [PubMed] [Google Scholar]
- Greenan G, Brangwynne CP, Jaensch S, Gharakhani J, Jülicher F, Hyman AA. Centrosome size sets mitotic spindle length in Caenorhabditis elegans embryos. Curr Biol. 2010;20:353–358. doi: 10.1016/j.cub.2009.12.050. [DOI] [PubMed] [Google Scholar]
- Grueber WB, Sagasti A. Self-avoidance and tiling: mechanisms of dendrite and axon spacing. Cold Spring Harb Perspect Biol. 2010;2:a001750. doi: 10.1101/cshperspect.a001750. [DOI] [PMC free article] [PubMed] [Google Scholar]
- Gundersen GG, Worman HJ. Nuclear positioning. Cell. 2013;152:1376–1389. doi: 10.1016/j.cell.2013.02.031. [DOI] [PMC free article] [PubMed] [Google Scholar]
- Hara Y, Merten CA. Dynein-based accumulation of membranes regulates nuclear expansion in Xenopus laevis egg extracts. Dev Cell. 2015;33:562–575. doi: 10.1016/j.devcel.2015.04.016. [DOI] [PubMed] [Google Scholar]
- Hara Y, Kimura A. Cell-size-dependent spindle elongation in the Caenorhabditis elegans early embryo. Curr Biol. 2009;19:1549–1554. doi: 10.1016/j.cub.2009.07.050. [DOI] [PubMed] [Google Scholar]
- Hazel J, Krutkramelis K, Mooney P, Tomschik M, Gerow K, Oakey J, Gatlin JC. Changes in cytoplasmic volume are sufficient to drive spindle scaling. Science. 2013;342:853–856. doi: 10.1126/science.1243110. [DOI] [PMC free article] [PubMed] [Google Scholar]
- Heemskerk J, DiNardo S. Drosophila hedgehog acts as a morphogen in cellular patterning. Cell. 1994;76:449–460. doi: 10.1016/0092-8674(94)90110-4. [DOI] [PubMed] [Google Scholar]
- Hiscock TW, Megason SG. Mathematically guided approaches to distinguish models of periodic patterning. Development. 2015;142:409–419. doi: 10.1242/dev.107441. [DOI] [PMC free article] [PubMed] [Google Scholar]
- Izumi Y, Ohta N, Hisata K, Raabe T, Matsuzaki F. Drosophila Pins-binding protein Mud regulates spindle-polarity coupling and centrosome organization. Nat Cell Biol. 2006;8:586–593. doi: 10.1038/ncb1409. [DOI] [PubMed] [Google Scholar]
- Jankovics F, Brunner D. Transiently reorganized microtubules are essential for zippering during dorsal closure in Drosophila melanogaster. Dev Cell. 2006;11:375–385. doi: 10.1016/j.devcel.2006.07.014. [DOI] [PubMed] [Google Scholar]
- Jevtic P, Edens LJ, Li X, Nguyen T, Chen P, Levy DL. Concentration-dependent effects of nuclear lamins on nuclear size in Xenopus and mammalian cells. J Biol Chem. 2015;290:27557–27571. doi: 10.1074/jbc.M115.673798. [DOI] [PMC free article] [PubMed] [Google Scholar]
- Kammermeier L, Schmied J, Stierwald M, Burgunder JM, Reichert H. Identification of the Drosophila melanogaster homolog of the human spastin gene. Dev Genes Evol. 2003;213:412–415. doi: 10.1007/s00427-003-0340-x. [DOI] [PubMed] [Google Scholar]
- Kapitein LC, Peterman EJG, Kwok BH, Kim JH, Kapoor TM, Schmidt CF. The bipolar mitotic kinesin Eg5 moves on both microtubules that it crosslinks. Nature. 2005;435:114–118. doi: 10.1038/nature03503. [DOI] [PubMed] [Google Scholar]
- Klein MCG, Gorb SN. Epidermis architecture and material properties of the skin of four snake species. J R Soc Interface. 2012;9:3140–3155. doi: 10.1098/rsif.2012.0479. [DOI] [PMC free article] [PubMed] [Google Scholar]
- Kondo S, Miura T. Reaction-diffusion model as a framework for understanding biological pattern formation. Science. 2010;329:1616–1620. doi: 10.1126/science.1179047. [DOI] [PubMed] [Google Scholar]
- Lawlor KT, Ly DC, DiNardo S. Drosophila Dachsous and Fat polarize actin-based protrusions over a restricted domain of the embryonic denticle field. Dev Biol. 2013;383:285–294. doi: 10.1016/j.ydbio.2013.09.007. [DOI] [PMC free article] [PubMed] [Google Scholar]
- Levy DL, Heald R. Biological scaling problems and solutions in amphibians. Cold Spring Harb Perspect Biol. 2015;8:a019166. doi: 10.1101/cshperspect.a019166. [DOI] [PMC free article] [PubMed] [Google Scholar]
- Lin C, Schuster M, Guimaraes SC, Ashwin P, Schrader M, Metz J, Hacker C, Gurr SJ, Steinberg G. Active diffusion and microtubule-based transport oppose myosin forces to position organelles in cells. Nat Communications. 2016;7:11814–11814. doi: 10.1038/ncomms11814. [DOI] [PMC free article] [PubMed] [Google Scholar]
- Marcinkevicius E, Zallen JA. Regulation of cytoskeletal organization and junctional remodeling by the atypical cadherin Fat. Development. 2013;140:433–443. doi: 10.1242/dev.083949. [DOI] [PMC free article] [PubMed] [Google Scholar]
- Marshall WF. How cells measure length on subcellular scales. Trends Cell Biol. 2015;25:760–768. doi: 10.1016/j.tcb.2015.08.008. [DOI] [PMC free article] [PubMed] [Google Scholar]
- Merdes A, Ramyar K, Vechio JD, Cleveland DW. A complex of NuMA and cytoplasmic dynein is essential for mitotic spindle assembly. Cell. 1996;87:447–458. doi: 10.1016/s0092-8674(00)81365-3. [DOI] [PubMed] [Google Scholar]
- Metzger RJ, Klein OD, Martin GR, Krasnow MA. The branching programme of mouse lung development. Nature. 2008;453:745–750. doi: 10.1038/nature07005. [DOI] [PMC free article] [PubMed] [Google Scholar]
- Metzger T, Gache V, Xu M, Cadot B, Folker ES, Richardson BE, Gomes ER, Baylies MK. MAP and kinesin-dependent nuclear positioning is required for skeletal muscle function. Nature. 2012;484:120–124. doi: 10.1038/nature10914. [DOI] [PMC free article] [PubMed] [Google Scholar]
- Mitchison TJ, Maddox PS, Gaetz J, Groen AC, Shirasu M, Desai A, Salmon ED, Kapoor TM. Roles of polymerization dynamics, opposed motors, and a tensile element in governing the length of Xenopus extract meiotic spindles. Mol Biol Cell. 2005;16:3064–3076. doi: 10.1091/mbc.E05-02-0174. [DOI] [PMC free article] [PubMed] [Google Scholar]
- Ni JQ, Zhou R, Czech B, Liu LP, Holderbaum L, Yang-Zhou D, Shim HS, Tao R, Handler D, Karpowicz P, et al. A genome-scale shRNA resource for transgenic RNAi in Drosophila. Nat Methods. 2011;8:405–407. doi: 10.1038/nmeth.1592. [DOI] [PMC free article] [PubMed] [Google Scholar]
- Oda H, Tsukita S. Real-time imaging of cell-cell adherens junctions reveals that Drosophila mesoderm invagination begins with two phases of apical constriction of cells. J Cell Sci. 2001;114:493–501. doi: 10.1242/jcs.114.3.493. [DOI] [PubMed] [Google Scholar]
- Parker J. Control of compartment size by an EGF ligand from neighboring cells. Curr Biol. 2006;16:2058–2065. doi: 10.1016/j.cub.2006.08.092. [DOI] [PubMed] [Google Scholar]
- Price MH, Roberts DM, McCartney BM, Jezuit E, Peifer M. Cytoskeletal dynamics and cell signaling during planar polarity establishment in the Drosophila embryonic denticle. J Cell Sci. 2006;119:403–415. doi: 10.1242/jcs.02761. [DOI] [PubMed] [Google Scholar]
- Rafelski SM, Viana MP, Zhang Y, Chan YHM, Thorn KS, Yam P, Fung JC, Li H, Costa LF, Marshall WF. Mitochondrial network size scaling in budding yeast. Science. 2012;338:822–824. doi: 10.1126/science.1225720. [DOI] [PMC free article] [PubMed] [Google Scholar]
- Rauzi MM, Lenne PF, Lecuit T. Planar polarized actomyosin contractile flows control epithelial junction remodelling. Nature. 2010;468:1110–1114. doi: 10.1038/nature09566. [DOI] [PubMed] [Google Scholar]
- Reber SB, Goehring NW. Intracellular scaling mechanisms. Cold Spring Harb Perspect Biol. 2015;7:a019067. doi: 10.1101/cshperspect.a019067. [DOI] [PMC free article] [PubMed] [Google Scholar]
- Repiso A, Saavedra P, Casal J, Lawrence PA. Planar cell polarity: the orientation of larval denticles in Drosophila appears to depend on gradients of Dachsous and Fat. Development. 2010;137:3411–3415. doi: 10.1242/dev.047126. [DOI] [PMC free article] [PubMed] [Google Scholar]
- Saavedra P, Vincent JP, Palacios IM, Lawrence PA, Casal J. Plasticity of both planar cell polarity and cell identity during the development of Drosophila. eLife. 2014;3:5689. doi: 10.7554/eLife.01569. [DOI] [PMC free article] [PubMed] [Google Scholar]
- Savage DF, Afonso B, Chen AH, Silver PA. Spatially ordered dynamics of the bacterial carbon fixation machinery. Science. 2010;327:1258–1261. doi: 10.1126/science.1186090. [DOI] [PubMed] [Google Scholar]
- Schmidt CV, Gorb SN. Snake scale microstructure: phylogenetic significance and functional adaptations. Zoologica. 2012;157:1–106. [Google Scholar]
- Schneider CA, Rasband WS, Eliceiri KW. NIH Image to ImageJ: 25 years of image analysis. Nat Methods. 2012;9:671–675. doi: 10.1038/nmeth.2089. [DOI] [PMC free article] [PubMed] [Google Scholar]
- Sharp DJ, Yu KR, Sisson JC, Sullivan W, Scholey JM. Antagonistic microtubule-sliding motors position mitotic centrosomes in Drosophila early embryos. Nat Cell Biol. 1999;1:51–54. doi: 10.1038/9025. [DOI] [PubMed] [Google Scholar]
- Shirasu-Hiza M, Perlman ZE, Wittmann T, Karsenti E, Mitchison TJ. Eg5 causes elongation of meiotic spindles when flux-associated microtubule depolymerization is blocked. Curr Biol. 2004;14:1941–1945. doi: 10.1016/j.cub.2004.10.029. [DOI] [PubMed] [Google Scholar]
- Siller KH, Cabernard C, Doe CQ. The NuMA-related Mud protein binds Pins and regulates spindle orientation in Drosophila neuroblasts. Nat Cell Biol. 2006;8:594–600. doi: 10.1038/ncb1412. [DOI] [PubMed] [Google Scholar]
- Simone RP, DiNardo S. Actomyosin contractility and Discs large contribute to junctional conversion in guiding cell alignment within the Drosophila embryonic epithelium. Development. 2010;137:1385–1394. doi: 10.1242/dev.048520. [DOI] [PMC free article] [PubMed] [Google Scholar]
- Soares e Silva M, Depken MM, Stuhrmann B, Korsten MM, MacKintosh FC, Koenderink GHG. Active multistage coarsening of actin networks driven by myosin motors. Proc Natl Acad Sci USA. 2011;108:9408–9413. doi: 10.1073/pnas.1016616108. [DOI] [PMC free article] [PubMed] [Google Scholar]
- Spinner M, Gorb SN, Westhoff G. Diversity of functional microornamentation in slithering geckos Lialis (Pygopodidae) Proc Biol Sci. 2013;280:20132160. doi: 10.1098/rspb.2013.2160. [DOI] [PMC free article] [PubMed] [Google Scholar]
- Taylor AB, Fallon JR. Dendrites contain a spacing pattern. J Neurosci. 2006;26:1154–1163. doi: 10.1523/JNEUROSCI.4424-05.2006. [DOI] [PMC free article] [PubMed] [Google Scholar]
- Thoresen T, Lenz M, Gardel ML. Reconstitution of contractile actomyosin bundles. Biophys J. 2011;100:2698–2705. doi: 10.1016/j.bpj.2011.04.031. [DOI] [PMC free article] [PubMed] [Google Scholar]
- Tran PT, Marsh L, Doye V, Inoué S, Chang F. A mechanism for nuclear positioning in fission yeast based on microtubule pushing. J Cell Biol. 2001;153:397–411. doi: 10.1083/jcb.153.2.397. [DOI] [PMC free article] [PubMed] [Google Scholar]
- Walters JW, Dilks SA, DiNardo S. Planar polarization of the denticle field in the Drosophila embryo: roles for Myosin II (Zipper) and Fringe. Dev Biol. 2006;297:323–339. doi: 10.1016/j.ydbio.2006.04.454. [DOI] [PMC free article] [PubMed] [Google Scholar]
- Walters JW, Muñoz C, Paaby AB, DiNardo S. Serrate–Notch signaling defines the scope of the initial denticle field by modulating EGFR activation. Dev Biol. 2005;286:415–426. doi: 10.1016/j.ydbio.2005.06.031. [DOI] [PubMed] [Google Scholar]
- Weber SC, Brangwynne CP. Inverse size scaling of the nucleolus by a concentration-dependent phase transition. Curr Biol. 2015;25:641–646. doi: 10.1016/j.cub.2015.01.012. [DOI] [PMC free article] [PubMed] [Google Scholar]
- Wen L, Weaver JC, Thornycroft PJM, Lauder GV. Hydrodynamic function of biomimetic shark skin: effect of denticle pattern and spacing. Bioinspir Biomim. 2015;10:066010. doi: 10.1088/1748-3190/10/6/066010. [DOI] [PubMed] [Google Scholar]
- Wühr M, Chen Y, Dumont S, Groen AC, Needleman DJ, Salic A, Mitchison TJ. Evidence for an upper limit to mitotic spindle length. Curr Biol. 2008;18:1256–1261. doi: 10.1016/j.cub.2008.07.092. [DOI] [PMC free article] [PubMed] [Google Scholar]
- Xu K, Zhong G, Zhuang X. Actin, spectrin, and associated proteins form a periodic cytoskeletal structure in axons. Science. 2013;339:452–456. doi: 10.1126/science.1232251. [DOI] [PMC free article] [PubMed] [Google Scholar]
- Yasuda GK, Schubiger G, Wakimoto BT. Genetic characterization of ms(3)K81, a paternal effect gene of Drosophila melanogaster. Genetics. 1995;140:219–229. doi: 10.1093/genetics/140.1.219. [DOI] [PMC free article] [PubMed] [Google Scholar]
- Zhao T, Graham OS, Raposo A, St Johnston D. Growing microtubules push the oocyte nucleus to polarize the Drosophila dorsal-ventral axis. Science. 2012;336:999–1003. doi: 10.1126/science.1219147. [DOI] [PMC free article] [PubMed] [Google Scholar]
Associated Data
This section collects any data citations, data availability statements, or supplementary materials included in this article.