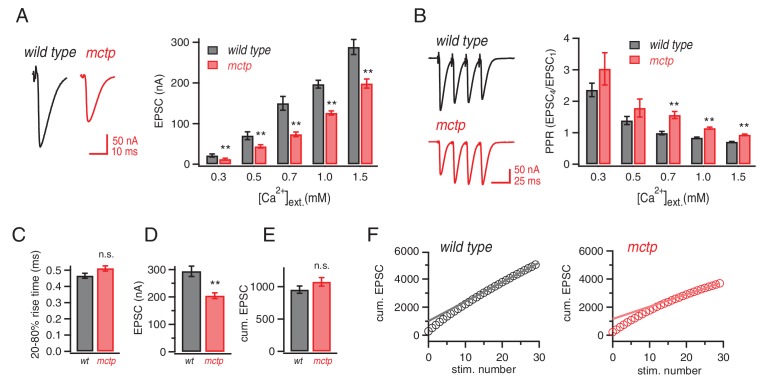
Figure 5. Altered baseline transmission and short-term plasticity in mctp mutants.
(A) At left, representative EPSC traces for wild type (black) and mctpOG9 (red). The plot shows average EPSC amplitudes for wild type (gray) and mctpOG9 (red) at the indicated extracellular calcium concentrations. Sample sizes as follows: 0.3 mM: n = 10 (wt), n = 8 (mctpOG9); 0.5 mM: n = 13 (wt), n = 11 (mctpOG9); 0.7 mM: n = 7 (wt), n = 16 (mctpOG9); 1.0 mM: n = 16 (wt), n = 13 (mctpOG9); 1.5 mM: n = 12 (wt), n = 10 (mctpOG9). The decrease in mctpOG9 is significant at every calcium concentration (t-test). (B) At left, representative traces for short stimulus trains (60 Hz) for wild type (black) and mctpOG9 (red). Scale bar: 50nA, 50 ms. The plot show average EPSC ratio (4thEPSC/1stEPSC) at the indicated calcium concentrations for wild type (gray) and mctpOG9 (red). (C) Average EPSC rise time (20–80%) for wild type (gray) and mctp (red). D) Average EPSC amplitudes . (E) Average cumulative EPSC as in (D). (F) Representative data for the cumulated peak EPSC amplitudes following a train of action potential (60 Hz, 30 stimuli) shown for wild type and mctpOG9. Data are fit with a linear function at x = 20 to x = 29 and back-extrapolated to time 0, intersecting the y-axis. Student’s t-test ** for p<0.01, n.s. for p>0.05.

