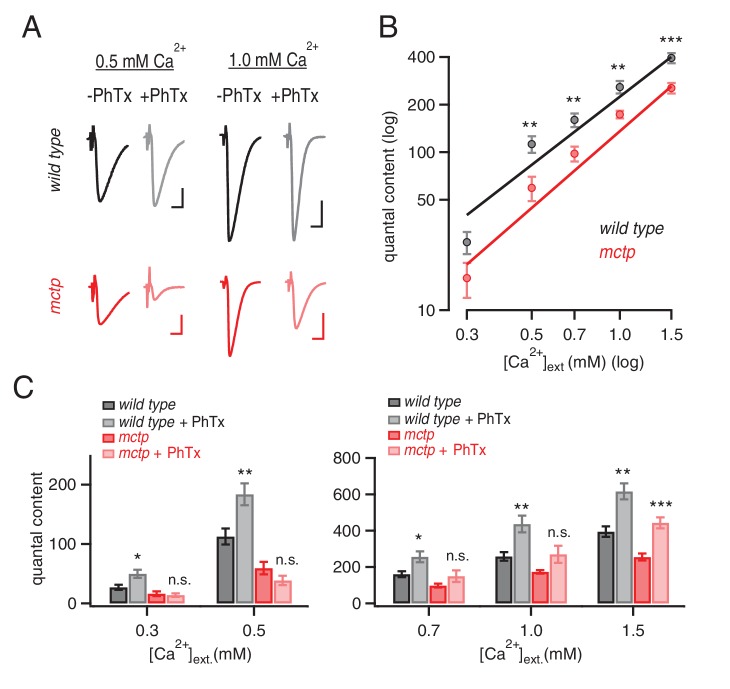
Figure 8. MCTP ensures that PHP is robust to variations in extracellular calcium.
(A) Representative EPSC traces for wild type (black) and mctpOG9 (red) at the indicated extracellular calcium concentrations, in the absence (−) and presence (+) of PhTx. Scale bar: 20 nA, 5 ms. (B) Average quantal content quantified at indicated calcium concentrations for wild type (black) and mctpOG9 (red). (C) Average quantal content for wild type (black/gray) and mctpOG9 (red/light red) in the absence and presence of PhTx at the indicated extracellular calcium concentrations. Sample sizes are shown for each calcium concentrations (mM) 0.3, 0.5, 0.7, 1.0 and 1.5, respectively: wild type (-Phtx) n = 10, 13, 6, 16, 12; wild type (+Phtx) n = 9, 12, 9, 7, 8. mctp (-Phtx) n = 8, 10, 14, 12, 9; mctp (+Phtx) n = 8, 10, 9, 6, 10. Statistical significance as indicated: Student’s t-test * for p<0.05; ** for p<0.01, n.s. for p>0.05.

