

Abstract
During the past decade, genome-wide association studies (GWAS) have successfully identified tens of thousands of genetic variants associated with complex traits and diseases. These studies have produced extensive repositories of genetic variation and trait measurements across large numbers of individuals, providing tremendous opportunities for further analyses. However, privacy concerns and other logistical considerations often limit access to individual-level genetic data, motivating the development of methods that analyze summary association statistics. Here we review recent progress on statistical methods that leverage summary association data to gain insights into the genetic basis of complex traits and diseases.
Introduction
Genome-wide association studies (GWAS) have been broadly successful in identifying genetic variants associated to complex traits and diseases, explaining a significant fraction of narrow-sense heritability and occasionally pinpointing biological mechanisms1. These studies have produced extensive databases of genetic variation (typically at the level of common single nucleotide polymorphisms (SNPs) included on genotyping arrays) in large numbers of individuals across hundreds of complex traits. Further analyses of this data can yield important insights into the genetics of complex traits, but privacy concerns and other logistical considerations often restrict access to individual-level data. On the other hand, summary association statistics, defined here as per-allele SNP effect sizes (log odds ratios for case-control traits) together with their standard errors, are often readily available and can be used to compute z-scores (per-allele effect sizes divided by their standard errors; see Figure 1); we note that in some applications, allele frequencies may also be required. A partial list of publicly available summary association statistics from large GWAS is provided in Table 1. Summary statistics also offer advantages in computational cost, which does not scale with the number of individuals in the study. These advantages have motivated the recent development of many new methods for analyzing summary association data, often in conjunction with linkage disequilibrium (LD) information from a population reference panel such as 1000 Genomes2.
Figure 1. Illustration of summary association statistics.
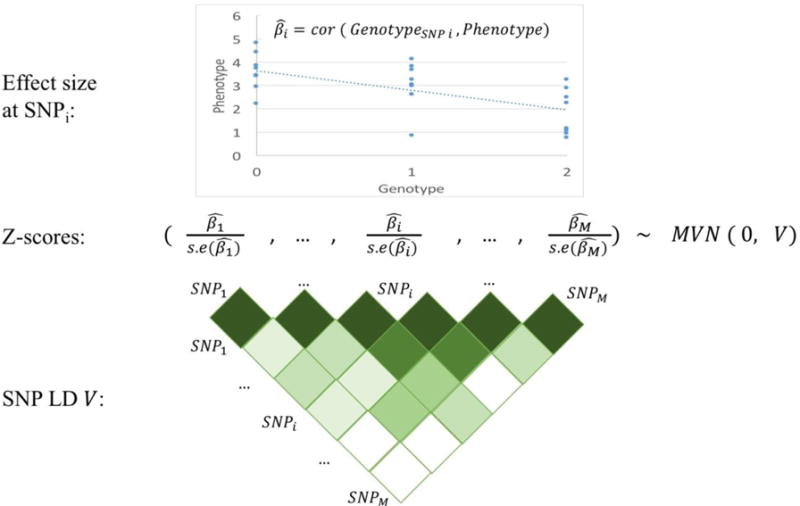
Per-allele SNP effect sizes (and their standard errors) are typically estimated by regressing the phenotype on the genotype values at the SNP of interest (top). At large sample sizes, the vector of z-scores (effect sizes divided by their standard errors) at a locus are approximated by a multivariate normal distribution with mean 0 and variance equal to the LD matrix V (bottom).
Table 1. Publicly available summary association statistics.
We provide a partial list of publicly available summary statistics from GWAS with sample size at least 20,000. A more complete list is provided in ref.119.
: includes specialty chip data; not suitable for analysis using LD score regression and its extensions.
Here, we review these summary statistic-based methods. First, we review methods for performing single-variant association tests, including meta-analysis, conditional association and imputation using summary statistics. Second, we review methods for performing gene-based association tests by incorporating transcriptome reference data or aggregating signals across multiple rare variants. Third, we review methods for fine-mapping causal variants, including integration of functional annotation and/or trans-ethnic data. Fourth, we review methods for constructing polygenic predictions of disease risk and inferring polygenic architectures. Finally, we review methods for jointly analyzing multiple traits. We conclude with a discussion of research areas where further work on summary statistic based methods is needed.
Single-variant association tests
Meta-analysis using fixed-effects or random-effects models
Large consortia often combine multiple GWAS studies into a single aggregate analysis to boost power for discovering SNP associations of small effect. Studies are combined either by jointly analyzing summary association results from each study (meta-analysis) or by re-analyzing individual-level data across all studies (mega-analysis)3. It has been shown that meta-analysis attains similar power for association as mega-analysis, with fewer privacy constraints and logistical challenges (since only summary association data is shared across studies)4. Meta-analysis is usually performed using fixed-effects approaches, which assume that true effect sizes are the same across studies. Under the assumption that causal effect sizes may differ across studies, this heterogeneity can be explicitly modeled using random-effects methods, which include an extra variance term in the model to account for heterogeneity. Traditional random-effects methods allow for heterogeneity under the null model, leading to low power even when heterogeneity is present. This motivated the development of a random-effects method based on a null model of no-heterogeneity, which increases power over traditional random-effects methods5. Under this framework, a statistical test against a null model of no-heterogeneity can be viewed as a summation of a fixed-effect component and a heterogeneity component, thus connecting fixed-effects and random-effects meta-analysis5. Subsequent work has introduced the concept of posterior probability that each study has an effect, aiding interpretation and power under the assumption that a subset of studies may have a negligible effect on the trait6.
Conditional association using LD reference data
Conditional association, in which the association between SNP and trait is evaluated after conditioning on the top SNP at a locus, can be used to identify multiple signals of association at a previously identified GWAS locus. Conditional association methods have traditionally required individual-level data in order to jointly fit multiple SNPs. Recent work has shown that conditional and joint association analysis of multiple SNPs can be approximated using only summary association statistics together with linkage disequilibrium (LD) information estimated from a population reference panel such as 1000 Genomes (see Box 1)7. This has enabled the discovery of new secondary associations at known loci for height, BMI, and other complex traits and diseases, increasing the variance explained by GWAS associations for these traits8–10; for example, in a recent height GWAS, approximate conditional analysis using summary data identified 697 genome-wide significant associations, including 34 secondary associations with r2>0.1 to a more significant SNP at the same locus8.
Box 1. Conditional association and summary statistic imputation using LD reference data.
Let X be an N × M matrix of genotypes, standardized to mean 0 and unit variance, and Y be an N × 1 vector of standardized trait values, where M is the number of SNPs at the locus and N is the number of samples. Under a standard linear model, . Let be an M × M LD matrix of pairwise LD; is equal to if individual-level data is available, but can otherwise be estimated from a population reference sample (with or without regularization).
Conditional association using LD reference data
We estimate the joint effects of all SNPs using least-squares as with , where is the residual variance in the joint analysis. In a standard GWAS, however, each SNP is marginally tested one at a time, which can be expressed in matrix form as with , where is the (nearly constant) diagonal matrix of and is the residual variance in the marginal analysis. It follows that:
Summary statistic imputation using LD reference data
Let be a vector of z-scores (estimated effect sizes divided by their s.e.) obtained by marginally testing each SNP one at a time. Under the null hypothesis of no association, . Let Zt and Zi partition the vector Z into T typed SNPs and M − T untyped SNPs, and let (covariances among typed SNPs), (covariances among untyped SNPs), and (covariances among typed and untyped SNPs) partition the matrix accordingly. It follows that
The mean and variance of the conditional distribution can be used to impute summary association statistics at untyped SNPs.
Imputation using summary association statistics
A standard approach to boost association power in GWAS is to leverage LD information from a population reference panel to impute genotypes at variants not typed in the study11. Imputation is traditionally performed using individual-level data, which requires substantial computational resources and can be logistically cumbersome when new reference panels become available, particularly for large consortia combining data from multiple studies. As an alternative to imputation using individual-level data, approaches have been developed to perform imputation directly at the level of summary statistics12–18 (providing an alternative to other multivariate tests19,20). The key insight of these approaches is that LD induces correlations between z-scores, which can be modeled using a multi-variate normal (MVN) distribution with variance equal to the LD correlation matrix21 (an adjustment in the LD computation is needed for z-scores estimated using mixed models22). Thus, z-scores at untyped SNPs can be imputed from observations at typed SNPs using conditional means and variances of the MVN distribution. Imputation using summary statistics recovers >80% of the information from imputation using individual-level data at common variants14–16, and is practical and efficient since the imputed summary statistics are linear combinations of the observed statistics (see Box 1). However, imputation using summary statistics cannot capture non-linear relationships between SNPs, which are modeled using haplotypes in imputation from individual-level data.
Conditional association and imputation using summary statistics critically rely on accurate LD information from a population reference panel. Even in the best case where the reference population closely matches the GWAS population, the relatively small size of reference panels for which LD information is publicly available (typically hundreds or at most thousands of individuals) makes accurate estimation of a large number of LD parameters a challenge. This motivates regularization of the estimated LD matrix, both to maximize accuracy and to ensure robustness in the case of imputation using summary statistics, as mis-estimation of the variance of imputed statistics can lead to false-positive associations. A simple approach to regularization is to set all correlations between distal SNPs to zero, based on a fixed distance threshold7 or approximately independent LD blocks inferred from the data23. An alternative is to specify a prior distribution and compute Bayesian posteriors12; data can be combined across multiple ancestry reference panels to further boost accuracy17,18. Singular value decomposition based approaches for LD regularization have also been proposed in other contexts10. In general, the accuracy of conditional association and imputation using summary statistics is reduced at low-frequency variants and when the LD structure between typed and imputed SNPs is mis-specified (e.g., when the ancestry of the GWAS sample does not exactly match the reference panel). We note that concerns about false-positive associations in imputation using summary statistics can be avoided entirely via the release of in-sample summary LD information, i.e. pairwise correlations between all typed SNPs.
Gene-based association tests
Gene-based association using transcriptome reference data
GWAS risk variants are significantly enriched for genetic variants that impact gene expression (eQTLs)24. This motivates the paradigm of transcriptome-wide association studies (TWAS), which evaluate the association between the expression of each gene and a complex trait of interest. Due to the limited availability of very large samples with measured gene expression and trait values, initial TWAS approaches integrated eQTL and GWAS to identify susceptibility genes either via matching the association signals25–27, via mediation analyses28, or via assessing whether the same causal variant impacts both gene expression and trait under a single causal variant model29–31.
More recent studies have leveraged predicted expression to improve the power of TWAS. Under this paradigm, transcriptome reference data is used to predict gene expression in the GWAS data set (using cis SNPs, e.g. within 1Mb of the transcription start site), followed by a test for association between predicted expression and trait. As an alternative to TWAS using individual-level data32, TWAS using predicted expression can also be performed using only summary association statistics and summary LD information33–35. These studies respectively employed expression predictors that do not account for LD33, account for LD and allow for sparsity in eQTL effect sizes34, or utilize the top eQTL at the locus35. The key intuition is that the correlation between a weighted linear combination of SNPs (i.e. predicted gene expression) and trait is equivalent to a weighted linear combination of correlations between SNPs and trait (i.e. summary association statistics from GWAS) (see Figure 2). Since TWAS using predicted expression is conceptually similar to a test for non-zero genetic covariance between gene expression and trait34, it can also be performed via a two-sample Mendelian randomization from summary statistics35. TWAS using predicted expression can increase power over a standard GWAS when there exist multiple causal variants whose effect on trait is mediated through expression. TWAS also reduces the multiple hypothesis burden by testing tens of thousands of genes instead of millions of SNPs. TWAS using predicted expression typically uses individual-level transcriptome reference data to predict gene expression, but can also be performed using only summary association statistics between SNPs and gene expression, albeit with a reduction in power34. The potential power gains of TWAS are underscored by the recent identification of 71 new susceptibility genes across 28 complex traits, of which 17 have no GWAS association within 1 Mb36. However, TWAS is underpowered compared to standard GWAS when the true biological mechanism is independent of gene expression or when expression data in the most relevant tissue is not available.
Figure 2. TWAS using predicted expression and summary data.
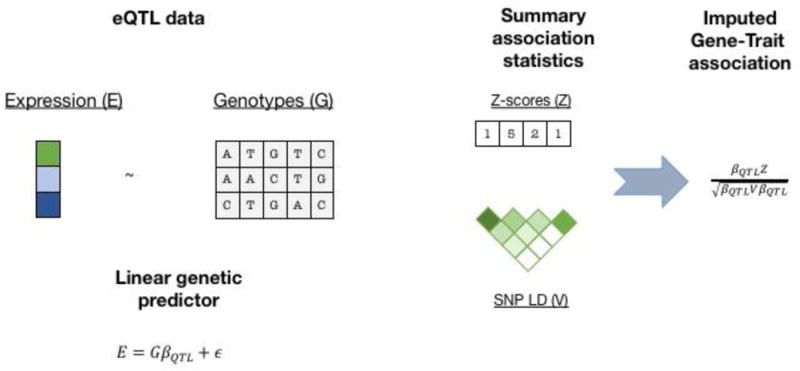
TWAS using predicted expression and summary data follows two steps. First, transcriptome reference data is used to build a linear predictor for gene expression, typically using SNPs from the 1Mb local region around the gene with regularized effect sizes (e.g. using BSLMM81). Second, this predictor is applied to summary GWAS z-scores and gene-trait association z-scores are computed, testing the null model of no association between gene and trait.
Rare variant association tests
Although most GWAS of complex traits and diseases have focused on common variants that are typed on genotyping arrays or imputed from population reference panels, rare variant associations may also provide a rich source of biological insights, particularly for traits under strong negative selection37,38. Because association tests of individual rare variants are likely to be underpowered, rare variant association tests generally aggregate evidence for association across multiple rare variants at a locus. In exome sequencing studies (or exome array studies), rare variants are aggregated at the gene level, making the gene the unit of association. This can be done either using burden tests, which assume that all rare variants in a candidate gene have the same direction of effect, or using overdispersion tests, which assume that rare variants in a candidate gene can impact a complex trait in either direction; hybrid omnibus tests are also possible39. Recent studies have shown that both burden tests and overdispersion tests can be performed using only summary association statistics from each rare variant, together with summary LD information40–42 (see Box 2). Roughly, burden tests are computed as weighted sums of single-variant z-scores and overdispersion tests are computed as weighted sums of squared single-variant z-scores (analogous to previous work on common variant overdispersion tests using summary statistics19,20), with summary LD information used to specify appropriate null distributions in each case. However, a key limitation is that these studies require the use of in-sample summary LD information in preference to reference LD information to ensure appropriate null distributions and avoid false-positive associations. Thus, in contrast to summary statistic based methods for common variants (see above), both summary association statistics and in-sample summary LD information are required in order for these methods to be useful (see Discussion). An additional limitation is that, for case-control traits, asymptotic null distributions may not be valid when variant counts or case or control sample sizes are small, necessitating careful scrutiny of quantile-quantile plots.
Box 2. Rare variant association tests using summary association statistics.
Let X be an N × M matrix of genotypes, standardized to mean 0 and variance 1, and Y be an N × 1 matrix of standardized trait values, where M is the number of rare variants (e.g. in a given gene being tested for association) and N is the number of samples. An M × 1 vector of z-scores (estimated effect sizes divided by their s.e.) can be computed as , with multivariate normal null distribution where is an in-sample LD matrix.
Burden tests
Burden tests assume that all rare variants in a candidate gene have the same direction of effect. Burden tests may either assume that standardized effect sizes are the same for each rare variant112 (i.e. per-allele effect sizes are proportional to , where pi is the allele frequency), or apply weights or thresholds based on allele frequency or functional information113,114. If w is an M × 1 vector of weights for each rare variant (including zero weights for rare variants excluded by a threshold), the test statistic for a weighted burden test is with null distribution . This test statistic can naturally be extended to meta-analysis of burden tests from multiple cohorts (via inverse-variance weighting), and can be extended to variable threshold tests and binary traits40–42.
Overdispersion tests
Overdispersion tests assume that rare variants in a candidate gene can impact a complex trait in either direction, and can be computed as weighted sums of squared single-variant test statistics115,116. If W = diag(w1, …, wM) is an M × M diagonal matrix of weights for each rare variant, the test statistic for a weighted overdispersion test is with null distribution , where weights μi for each χ2 (1 d.o.f.) distribution χi2 are given by eigenvalues of the matrix . This test statistic can be extended to meta-analysis of overdispersion tests from multiple cohorts (via inverse-variance weighting), and can be extended to binary traits40–42.
Fine-mapping
Fine-mapping using posterior probabilities of causality
Statistical fine-mapping aims to identify the causal variant(s) that are driving a GWAS association signal, enabling functional experiments to validate biological function. A straightforward approach to fine-mapping is to prioritize variants based on the strength of the marginal association statistics (i.e. ranking p-values)43. This is an effective strategy in the case of a single causal variant, but can be suboptimal when multiple causal variants are present, as the SNP with the top p-value at the locus may be tagging multiple causal variants. An alternative is to compute the posterior probabilities of causality for every SNP in the region, based on the likelihoods of the observed z-scores conditional on each possible set of causal variant(s)44. These posterior probabilities can be used to construct a credible set of SNPs, defined as the smallest set of SNPs that contains the true causal variant(s) with a given probability (typically 90% or 99%). Initial studies approximated the posterior probabilities of causality under a single causal variant assumption. Under this assumption, posterior probabilities of causality can be estimated from z-scores without the need for LD information45; this approach is both practical and computationally efficient. More recent studies have computed posterior probabilities of causality under a multiple causal variant assumption46. As in the case of imputation using summary statistics, the likelihoods of the observed z-scores can be computed based on the multi-variate normal (MVN) distribution with variance equal to the LD correlation matrix, with LD estimated from population reference panels using regularization techniques. Unlike imputation using summary statistics, which uses the null model of no association (i.e. a mean of 0 in the MVN), in fine-mapping the mean is a function of causal effect sizes, which can be heuristically approximated or integrated out using conjugate priors46,47. These methods often restrict computations to a maximum number of causal variants (e.g. 3 or 6); more recent studies have shown that further speed-ups can be achieved through matrix factorizations48 or stochastic search49. Methods that model multiple causal variants generally improve the accuracy (and calibration) of credible sets at loci with multiple causal variants46–50, with very limited decreases in accuracy at loci with only a single causal variant46–52. A less accurate alternative is to use conditional association analysis to detect multiple signals of associations7,53,54, followed by estimation of posterior probabilities of causality under a single causal variant assumption for each independent signal. In this case, special care is required in specifying the boundaries of each independent signal and the threshold for the conditional test.
Leveraging functional annotation data
Fine-mapping accuracy can be improved by integrating functional annotation data such as predicted regulatory elements from the ENCODE and ROADMAP Epigenomics projects55,56. This approach is motivated by early studies showing that disease-associated variants are systematically enriched in chromatin marks that delineate active regulatory regions in disease-relevant cell types57,58. Under this paradigm, a statistical model is developed to jointly estimate functional enrichment and update posterior probabilities of causality using functional annotations47,52,59,60. Some integrative methods assume that SNPs are unlinked60 or assume a single causal variant per locus52,59, but a recent study built upon the multiple causal variant model of ref.46 to incorporate functional annotation data47. In an analysis of rheumatoid arthritis summary association data, integrative fine-mapping using this approach reduced the average size of 90% credible sets by 10%61. In addition to increasing fine-mapping accuracy, these studies have also provided insights into polygenic architectures (see below) by identifying tissue-specific functional annotations that are enriched for causal disease signals. This can also be achieved by conducting fine-mapping without integrating functional annotation data (typically under a single causal variant assumption) and then overlapping the resulting credible sets with functional annotation data to assess enrichment62–64. Future integrative methods could increase fine-mapping resolution by integrating probabilistic functional annotations (e.g., ChIP-seq peak intensity) or modeling the strength of association between SNPs and chromatin marks in population-based studies65,66.
Trans-ethnic fine-mapping
Fine-mapping accuracy can also be improved by leveraging differences in LD patterns across continental populations that have arisen due to differences in demographic events such as population bottlenecks (see Figure 3)67–70. Intuitively, the set of tag SNPs linked to a causal variant will vary across populations, so that aggregating evidence of association across populations will dilute signals from tag SNPs and strengthen signals from causal variants. A standard approach to combining information across multiple studies is to compute posterior probabilities of causality from fixed-effects meta-analysis results67,69,71,72. Alternately, posterior probabilities can be computed from results of random-effects trans-ethnic meta-analysis methods64,68. These approaches assume a single causal variant and thus do not require LD information from the underlying populations. More recent studies have introduced hierarchical probabilistic models that allow for multiple causal variants while incorporating LD information from population reference panels61. These studies assume that causal variants are shared across populations but allow for heterogeneity in effect sizes across populations, and can also incorporate functional annotation data to further increase fine-mapping accuracy61. In an analysis of rheumatoid arthritis summary association data in Europeans and Asians (see above), trans-ethnic fine-mapping reduced the average size of 90% credible sets by 25%, and by 32% when also integrating functional annotation data61.
Figure 3. Leveraging functional annotation and trans-ethnic data to improve fine-mapping.
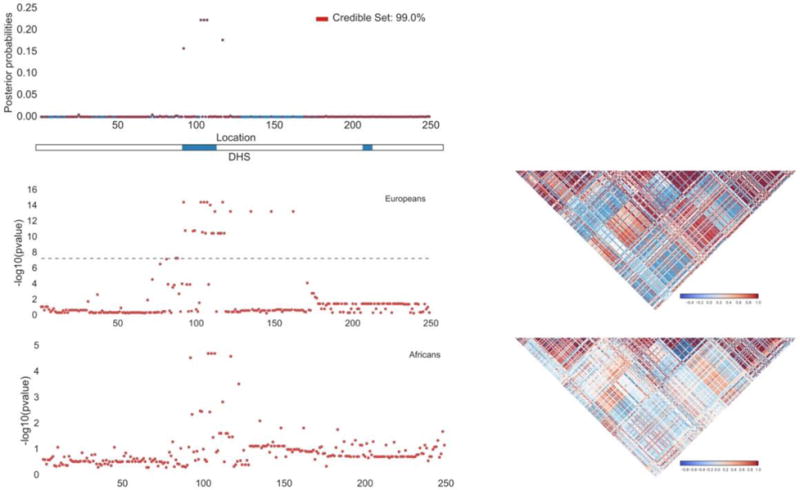
A sample locus with simulated fine-mapping data in Europeans and Africans is displayed. The top panel shows the 99% credible set (denoted in red) produced by leveraging functional annotation data (DNase I Hypersensitivity Sites, DHS) in trans-ethnic fine-mapping. The middle and bottom panels show the –log 10 p-values (left) and LD (right) in Europeans and Africans.
Polygenicity of complex traits
Polygenic risk prediction
Although the main focus of complex disease genetics is to gain insights about disease biology, genetics can also be leveraged to build predictions of disease risk, which may become clinically useful as sample sizes increase73,74. A landmark study of schizophrenia showed that polygenic risk scores, constructed by summing the predicted effects of all markers below a P-value threshold in the training sample, produced predictions of schizophrenia risk in validation samples that were significantly better than random, and far more accurate than those based on the single genome-wide significant locus identified in the study75. This provided an early demonstration of the advantages of incorporating markers that do not attain genome-wide significance into polygenic risk scores to improve prediction accuracy for polygenic traits. An important issue in computing polygenic risk scores is that of LD between markers, which has historically been addressed by LD-pruning—either without regard to P-values75, or via informed LD-pruning76 (clumping) that preferentially retains markers with more significant P-values. More recent work has shown that explicitly modeling LD using an LD reference panel and estimating posterior mean causal effect sizes can improve prediction accuracy from summary statistics77. An alternative to summary statistic based methods is to fit effect sizes of all markers simultaneously using Best Linear Unbiased Prediction (BLUP) methods and their extensions78–80, which require individual-level training data. Fitting all markers simultaneously is theoretically more appropriate and can produce more accurate predictions, although the relative advantage is small when overall prediction accuracies are modest (Box 3). In their simplest form, polygenic risk scores and BLUP methods assume infinitesimal (Gaussian) architectures in which all markers are causal, but these methods have been extended to increase prediction accuracy in the case of non-infinitesimal architectures; this has been accomplished for polygenic risk scores via restricting to markers below a P-value threshold75 or estimating posterior mean causal effect sizes under a point-normal prior77, and for BLUP methods by estimating (joint-fit) posterior mean causal effect sizes under a normal mixture prior81,82. Although polygenic risk scores must await even larger training sample sizes to attain clinical utility, appreciable prediction accuracies have been achieved for some traits, including a Nagelkerke R2 of 0.25 (AUC: 75%) for schizophrenia77. An important caveat is that it is critical when constructing and evaluating polygenic risk scores to avoid non-independence of training and validation samples (e.g. due to cryptic relatedness or shared population stratification), which could cause prediction accuracy to be overstated relative to what could be achieved in an independent validation sample77,83.
Box 3. Polygenic risk prediction using summary vs. individual-level data.
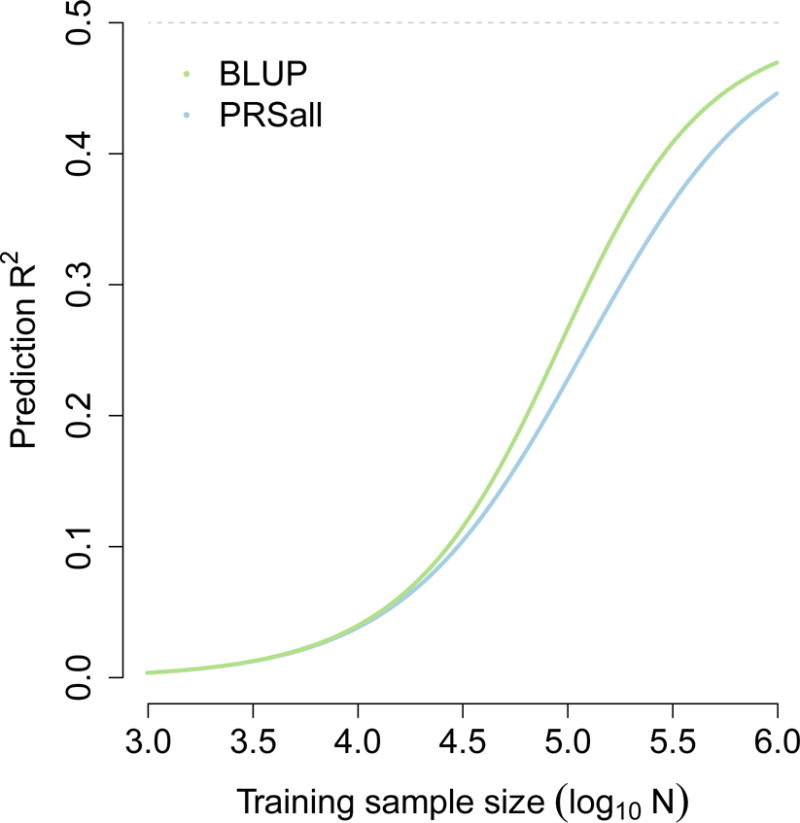
Suppose that polygenic risk prediction for a quantitative trait is conducted using a training cohort with N unrelated samples, using M unlinked markers with SNP-heritability7 equal to hg2. We initially consider two polygenic risk prediction methods that assume infinitesimal (Gaussian) architectures: polygenic risk scores computed using marginal effects at all markers with no P-value thresholding (PRSall), and fitting effect sizes of all markers simultaneously via Best Linear Unbiased Prediction (BLUP). We note that PRSall requires only summary statistics from the training cohort, whereas BLUP requires individual-level data. The prediction R2 for each method are given by83,117
These equations can naturally be extended to linked markers (using the effective number of unlinked markers108) and case-control traits (using observed-scale SNP-heritability118). The relative advantage of BLUP over PRSall is small when prediction R2 is small in absolute terms, but grows larger when prediction R2 is larger; this is illustrated in the figure below, which reports prediction R2 at various training sample sizes based on M=60,000 unlinked markers and a SNP-heritability of hg2=0.5. These results generalize to non-infinitesimal extensions of polygenic risk scores75,77 and BLUP81,82; in the latter case, the noise reduction from fitting all markers simultaneously remains equal to 1‒R2, corresponding to an increase in training sample size of 1/(1‒R2).
Figure.
Inferring polygenic architectures
It is increasingly clear that most complex traits and diseases have highly polygenic architectures, with a large number of causal variants of small effect. In order to understand these polygenic architectures, it is of interest to infer parameters such as the heritability explained by SNPs and the number of variants with non-negligible effects on the trait. Both of these quantities have been estimated using accuracies of polygenic risk scores (see above), as a function of the P-value threshold used to constrain the set of markers employed75,76. Computing polygenic risk scores requires individual-level data in the validation cohort, implying that these methods are not strictly summary statistic based. Recent work has shown that the information in polygenic risk scores can be derived from summary-level data in the training and validation cohorts to estimate the heritability explained by SNPs and the number of causal variants84; a limitation of this approach is that SNPs are assumed to be uncorrelated, which can be approximately achieved by LD-pruning but precludes analyses of dense marker panels. The heritability explained by SNPs can alternatively be estimated from the slope of LD score regression85, in which χ2 statistics for each SNP are regressed against LD scores (sum of squared correlations with all SNPs), leveraging the fact that SNPs with higher LD scores are expected to contain more polygenic signal86. This approach explicitly allows for LD between SNPs and can distinguish between polygenicity and confounding, although it assumes a linear model that may not hold in practice and makes strong assumptions about effect sizes of rare variants that only enable robust estimates for common variants. Another recent method models LD while treating SNP effects as fixed rather than random (similar to ref.84), enabling estimation of heritability explained by common SNPs in local regions as well as genome-wide10. Overall, summary statistic based methods provide a useful alternative to methods for estimating heritability explained by SNPs from individual-level data using restricted maximum likelihood (REML) and its extensions87,88.
The increasing availability of functional annotation data (see above) can also be used to identify functional annotations that are enriched for polygenic signals of disease heritability. A recent study accomplished this using a Bayesian hierarchical model that splits the genome into blocks and incorporates both coarse-scale functional annotations at the level of blocks and fine-scale functional annotations at the level of SNPs59. This was the first study to quantify polygenic enrichments for cell-type-specific chromatin marks and DNase I hypersensitivity sites (DHS) across a broad set of complex traits and diseases. For example, polygenic signals for platelet volume and platelet count were enriched at DHS in CD34+ cells, which are on the cell lineage that lead to platelets, and polygenic signals for Crohn’s disease were depleted at repressed chromatin in LCL, an immune-related cell line. Functional enrichments can alternatively be estimated by stratified LD score regression89, which generalizes LD score regression85 to regress χ2 statistics for each SNP against LD scores with each functional category. Fine-mapping methods can also estimate functional enrichments, although these analyses are often restricted to disease-associated loci47,52,61. Notably, all of these summary statistic based methods have been applied to a large number of overlapping functional annotations, whereas methods that analyze individual-level genotypes have only been applied to a small number of non-overlapping functional annotations88,90. In addition, stratified LD score regression is not limited by the single causal variant per block assumption of the Bayesian hierarchical model, increasing power in settings of highly polygenic traits89. Application of the method identified significant cell-type-specific enrichments for many highly polygenic traits, including enrichments for histone marks in brain for smoking behavior and educational attainment—even though the summary statistics analyzed contained only one and three genome-wide significant loci, respectively. One limitation of the method is limited power for functional categories spanning a small percentage of the genome, motivating additional work in this area. As both summary statistic and functional annotation data sets grow larger and richer, identifying enriched functional annotations using summary statistic data will likely continue to be a fruitful endeavor.
Cross-trait analyses
Many complex traits and diseases have a shared genetic etiology, either via shared genetic variant(s) with nonzero effect sizes (pleiotropy) or via a correlation between causal effect sizes (genetic correlation). Indeed, many instances of genetic variants with pleiotropic effects on multiple traits have been identified91–96. A recent study applied a Bayesian framework to summary association statistics from pairs of traits to estimate, at each locus in the genome, the probability that an associated variant has pleiotropic effects on both traits97. Pleiotropic SNPs can also be utilized as instrumental variables in Mendelian randomization analyses from summary statistics98–100, with one such analysis showing that increased body mass index causally increases triglyceride levels97.
An alternate approach to assessing the genetic overlap between two traits is to estimate the correlation between causal effect sizes across the two traits. Genome-wide genetic correlations can be estimated from individual-level data using bivariate REML101. A recent study estimated genome-wide genetic correlations from summary data using the information in polygenic risk scores, although this approach required LD-pruning the data which may lead to upwards bias84. Another recent study estimated genome-wide genetic correlations from summary data using cross-trait LD score regression102, which generalizes LD score regression to regress products of z-scores against LD scores for each SNP; this method produced estimates that were highly concordant with those from individual-level data101. Fitting the underlying MVN model using maximum likelihood instead of linear regression has produced promising results in applications to estimating cross-trait and cross-population genetic correlations, and may also prove useful in other settings103. Although genetic correlation analyses restricted to associated variants have also produced important findings97, the power of methods that leverage polygenic signals in genome-wide data is underscored by the discovery of significant genetic correlations involving traits with zero or few genome-wide significant loci, including a significant negative genetic correlation between smoking behavior and educational attainment102. Notably, recent work shows that association statistics for unmeasured traits can be computed using summary statistics from genetically correlated traits104,105.
Conclusion
Recently developed methods have made it possible to leverage summary association statistics to perform a wide range of analyses, many of which previously required individual-level data. As the availability of summary association statistics continues to grow (Table 1), summary statistics will continue to be broadly used in analyses involving single-variant association tests, gene-based association tests, fine-mapping, polygenic prediction and inferring polygenic architectures, and cross-trait analysis. The use of summary data will entail a loss of accuracy in some applications, such as imputation, where methods that analyze individual-level data can use haplotypes to model nonlinear structure, and polygenic prediction, where methods that analyze individual-level data can reduce noise by fitting all markers simultaneously; however, when summary statistics are available in larger sample size than individual-level data, the advantage of larger sample size will outweigh those limitations. In addition, there are some settings where summary statistic based methods are the method of choice even when individual-level data is available, such as identifying functional annotations that are enriched for heritability, where methods that analyze individual-level data cannot currently handle a large number of overlapping annotations.
Despite considerable recent progress, there are some areas where further research on summary statistic based methods is needed. As population reference panels grow, more accurate modeling of rare and low-frequency variants will become possible, and it will be important to assess the limits of such efforts. It is also of interest to develop methods for inferring polygenic architectures from summary statistics that allow for different relationships between allele frequency and effect size. Identifying functional annotations that are enriched for heritability is an application that is particularly likely to produce important biological insights, and here there is a need for new methods that are well-powered for functional categories spanning a small percentage of the genome. As the number of functional annotations continues to increase, the integration of such data poses computational and statistical challenges in disentangling the correct functional annotations among many correlated ones.
We conclude by emphasizing the importance of making summary association statistics publicly available. A 2012 editorial in the journal Nature Genetics asked its authors to publish or database summary association statistics for all SNPs analyzed106, broadly impacting the set of publicly available summary statistics in the years that followed (Table 1). The public release of summary statistics is a useful compromise in situations where sample consent restrictions or privacy concerns preclude the release of individual-level data in a public repository. Although even the release of summary statistics can in principle lead to privacy concerns107, more recent work has shown that such privacy attacks have low power when the summary sample size exceeds the effective number of independent markers (currently estimated at 60,000 in typical GWAS data sets108), implying that privacy concerns should not preclude the public release of summary statistics from large studies109–111. Indeed, some recent studies have created web portals where summary data can be publicly accessed and visualized63. Finally, we note the potential benefits of publicly releasing summary statistics that include summary LD information (i.e. correlations) between each pair of proximal SNPs; however, the optimal approach to aggregating summary LD information across multiple cohorts in large-scale meta-analyses remains unclear, motivating future work in this area.
Acknowledgments
We are grateful to H. Finucane, S. Gazal, N. Mancuso and H. Shi for helpful discussions. We are grateful to G. Kichaev, R. Johnson for help with Figure 3. This work was funded by NIH grants R01 HG006399, R01 MH101244, R01 GM105857 and R01 MH107649.
Glossary
- INDIVIDUAL-LEVEL DATA
Genome-wide SNP genotypes and trait values for each individual included in a GWAS
- SUMMARY ASSOCIATION STATISTICS
Estimated effect sizes and their standard errors for each SNP analyzed in a GWAS
- Z-SCORES
Association statistics that follow a standard normal distribution under the null; often computed as per-allele effect sizes divided by their standard error
- META-ANALYSIS
A method for combining data from different studies in which summary association statistics from each study are jointly analyzed
- MEGA-ANALYSIS
A method for combining data from different studies in which individual-level data from each study are merged and jointly analyzed
- SUMMARY LD INFORMATION
In-sample correlations between each pair of typed SNPs analyzed in a GWAS; can be restricted to proximal pairs of typed SNPs to limit the number of pairs of SNPs
- TRANSCRIPTOME-WIDE ASSOCIATION STUDY (TWAS)
A study that evaluates the association between expression of each gene and a trait of interest; predicted expression may be used instead of measured expression to improve practicality
- MENDELIAN RANDOMIZATION
A method that uses significantly associated SNPs as instrumental variables to quantify causal relationships between two traits
- BURDEN TEST
A gene-based rare variant test in which all rare variants in a gene are assumed to have the same direction of effect
- OVERDISPERSION TEST
A gene-based rare variant test in which rare variants in a gene are assumed to impact trait in either direction
- POSTERIOR PROBABILITY OF CAUSALITY
The inferred probability that a SNP is causal, based on association data and optional prior information
- POLYGENIC RISK SCORE
A method of predicting trait by summing the predicted marginal effects of all markers below a P-value threshold in a training sample, multiplied by marker genotypes in a validation sample
- LD SCORE REGRESSION
A method of assessing trait polygenicity by regressing χ2 association statistics against LD scores for each SNP, computed as sums of squared correlations of each SNP with all SNPs including itself
- PLEIOTROPY
The existence of genetic variant(s) that affect more than one trait
- GENETIC CORRELATION
The signed correlation across SNPs between causal effect sizes for two traits
Footnotes
Competing interests
No competing interests
References
- 1.Visscher PM, Brown MA, McCarthy MI, Yang J. Five Years of GWAS Discovery. American journal of human genetics. 2012 doi: 10.1016/j.ajhg.2011.11.029. [DOI] [PMC free article] [PubMed] [Google Scholar]
- 2.1000 Genomes Project Consortium et al. An integrated map of genetic variation from 1,092 human genomes. Nature. 2012;491:56–65. doi: 10.1038/nature11632. [DOI] [PMC free article] [PubMed] [Google Scholar]
- 3.Evangelou E, Ioannidis JP. Meta-analysis methods for genome-wide association studies and beyond. Nat Rev Genet. 2013;14:379–389. doi: 10.1038/nrg3472. [DOI] [PubMed] [Google Scholar]
- 4.Lin DY, Zeng D. Meta-analysis of genome-wide association studies: no efficiency gain in using individual participant data. Genetic epidemiology. 2010;34:60–66. doi: 10.1002/gepi.20435. [DOI] [PMC free article] [PubMed] [Google Scholar]
- 5.Han B, Eskin E. Random-effects model aimed at discovering associations in meta-analysis of genome-wide association studies. American journal of human genetics. 2011;88:586–598. doi: 10.1016/j.ajhg.2011.04.014. This study introduced a powerful new random-effects meta-analysis method that employs a null model of no-heterogeneity. [DOI] [PMC free article] [PubMed] [Google Scholar]
- 6.Han B, Eskin E. Interpreting meta-analyses of genome-wide association studies. PLoS genetics. 2012;8:e1002555. doi: 10.1371/journal.pgen.1002555. [DOI] [PMC free article] [PubMed] [Google Scholar]
- 7.Yang J, et al. Conditional and joint multiple-SNP analysis of GWAS summary statistics identifies additional variants influencing complex traits. Nature genetics. 2012;44:369–75. S1–3. doi: 10.1038/ng.2213. This study demonstrated that conditional association analysis can be performed using summary statistics. [DOI] [PMC free article] [PubMed] [Google Scholar]
- 8.Wood AR, et al. Defining the role of common variation in the genomic and biological architecture of adult human height. Nature genetics. 2014;46:1173–1186. doi: 10.1038/ng.3097. [DOI] [PMC free article] [PubMed] [Google Scholar]
- 9.Locke AE, et al. Genetic studies of body mass index yield new insights for obesity biology. Nature. 2015;518:197–206. doi: 10.1038/nature14177. [DOI] [PMC free article] [PubMed] [Google Scholar]
- 10.Shi H, Kichaev G, Pasaniuc B. Contrasting the Genetic Architecture of 30 Complex Traits from Summary Association Data. American journal of human genetics. 2016;99:139–153. doi: 10.1016/j.ajhg.2016.05.013. [DOI] [PMC free article] [PubMed] [Google Scholar]
- 11.Marchini J, Howie B. Genotype imputation for genome-wide association studies. Nat Rev Genet. 2010;11:499–511. doi: 10.1038/nrg2796. [DOI] [PubMed] [Google Scholar]
- 12.Wen X, Stephens M. Using linear predictors to impute allele frequencies from summary or pooled genotype data. Ann Appl Stat. 2010;4:1158–1182. doi: 10.1214/10-aoas338. This was the first study showing that Gaussian imputation methods can be applied to summary-level genetic data. [DOI] [PMC free article] [PubMed] [Google Scholar]
- 13.Kostem E, Lozano JA, Eskin E. Increasing Power of Genome-Wide Association Studies by Collecting Additional Single-Nucleotide Polymorphisms. Genetics. 2011;188:449–460. doi: 10.1534/genetics.111.128595. [DOI] [PMC free article] [PubMed] [Google Scholar]
- 14.Lee D, Bigdeli TB, Riley BP, Fanous AH, Bacanu SA. DIST: direct imputation of summary statistics for unmeasured SNPs. Bioinformatics. 2013;29:2925–2927. doi: 10.1093/bioinformatics/btt500. [DOI] [PMC free article] [PubMed] [Google Scholar]
- 15.Pasaniuc B, et al. Fast and accurate imputation of summary statistics enhances evidence of functional enrichment. Bioinformatics. 2014;30:2906–2914. doi: 10.1093/bioinformatics/btu416. [DOI] [PMC free article] [PubMed] [Google Scholar]
- 16.Xu Z, et al. DISSCO: direct imputation of summary statistics allowing covariates. Bioinformatics. 2015;31:2434–2442. doi: 10.1093/bioinformatics/btv168. [DOI] [PMC free article] [PubMed] [Google Scholar]
- 17.Lee D, et al. DISTMIX: direct imputation of summary statistics for unmeasured SNPs from mixed ethnicity cohorts. Bioinformatics. 2015;31:3099–3104. doi: 10.1093/bioinformatics/btv348. [DOI] [PMC free article] [PubMed] [Google Scholar]
- 18.Park DS, et al. Adapt-Mix: learning local genetic correlation structure improves summary statistics-based analyses. Bioinformatics. 2015;31:i181–9. doi: 10.1093/bioinformatics/btv230. [DOI] [PMC free article] [PubMed] [Google Scholar]
- 19.Liu JZ, et al. A Versatile Gene-Based Test for Genome-wide Association Studies. The American Journal of Human Genetics. 2010;87:139–145. doi: 10.1016/j.ajhg.2010.06.009. [DOI] [PMC free article] [PubMed] [Google Scholar]
- 20.Li MX, Gui HS, Kwan JSH, Sham PC. GATES: a rapid and powerful gene-based association test using extended Simes procedure. American journal of human genetics. 2011;88:283–293. doi: 10.1016/j.ajhg.2011.01.019. [DOI] [PMC free article] [PubMed] [Google Scholar]
- 21.Conneely KN, Boehnke M. So many correlated tests, so little time! Rapid adjustment of P values for multiple correlated tests. American journal of human genetics. 2007;81:1158–1168. doi: 10.1086/522036. [DOI] [PMC free article] [PubMed] [Google Scholar]
- 22.Hormozdiari F, Kichaev G, Yang WY, Pasaniuc B, Eskin E. Identification of causal genes for complex traits. Bioinformatics. 2015;31:i206–13. doi: 10.1093/bioinformatics/btv240. [DOI] [PMC free article] [PubMed] [Google Scholar]
- 23.Berisa T, Pickrell JK. Approximately independent linkage disequilibrium blocks in human populations. Bioinformatics. 2016;32:283–285. doi: 10.1093/bioinformatics/btv546. [DOI] [PMC free article] [PubMed] [Google Scholar]
- 24.Nicolae DL, et al. Trait-associated SNPs are more likely to be eQTLs: annotation to enhance discovery from GWAS. PLoS genetics. 2010;6:e1000888. doi: 10.1371/journal.pgen.1000888. [DOI] [PMC free article] [PubMed] [Google Scholar]
- 25.Nica AC, et al. Candidate Causal Regulatory Effects by Integration of Expression QTLs with Complex Trait Genetic Associations. PLoS genetics. 2010;6:e1000895. doi: 10.1371/journal.pgen.1000895. [DOI] [PMC free article] [PubMed] [Google Scholar]
- 26.Xiong Q, Ancona N, Hauser ER, Mukherjee S, Furey TS. Integrating genetic and gene expression evidence into genome-wide association analysis of gene sets. Genome Res. 2012;22:386–397. doi: 10.1101/gr.124370.111. [DOI] [PMC free article] [PubMed] [Google Scholar]
- 27.He X, et al. Sherlock: detecting gene-disease associations by matching patterns of expression QTL and GWAS. American journal of human genetics. 2013;92:667–680. doi: 10.1016/j.ajhg.2013.03.022. [DOI] [PMC free article] [PubMed] [Google Scholar]
- 28.Huang YT, Liang L, Moffatt MF, Cookson WOCM, Lin X. iGWAS: Integrative Genome‐Wide Association Studies of Genetic and Genomic Data for Disease Susceptibility Using Mediation Analysis. Genetic epidemiology. 2015;39:347–356. doi: 10.1002/gepi.21905. [DOI] [PMC free article] [PubMed] [Google Scholar]
- 29.Giambartolomei C, et al. Bayesian Test for Colocalisation between Pairs of Genetic Association Studies Using Summary Statistics. PLoS genetics. 2014;10 doi: 10.1371/journal.pgen.1004383. This study introduced a method for performing TWAS using summary statistics by assessing whether a single causal variant impacts both gene expression and trait. [DOI] [PMC free article] [PubMed] [Google Scholar]
- 30.Onengut-Gumuscu S, et al. Fine mapping of type 1 diabetes susceptibility loci and evidence for colocalization of causal variants with lymphoid gene enhancers. Nature genetics. 2015;47:381–386. doi: 10.1038/ng.3245. [DOI] [PMC free article] [PubMed] [Google Scholar]
- 31.Fortune MD, et al. Statistical colocalization of genetic risk variants for related autoimmune diseases in the context of common controls. Nature genetics. 2015;47:839–846. doi: 10.1038/ng.3330. [DOI] [PMC free article] [PubMed] [Google Scholar]
- 32.Gamazon ER, et al. A gene-based association method for mapping traits using reference transcriptome data. Nature genetics. 2015;47:1091–1098. doi: 10.1038/ng.3367. [DOI] [PMC free article] [PubMed] [Google Scholar]
- 33.Lee D, et al. JEPEG: a summary statistics based tool for gene-level joint testing of functional variants. Bioinformatics. 2015;31:1176–1182. doi: 10.1093/bioinformatics/btu816. [DOI] [PMC free article] [PubMed] [Google Scholar]
- 34.Gusev A, et al. Integrative approaches for large-scale transcriptome-wide association studies. Nature genetics. 2016;48:245–252. doi: 10.1038/ng.3506. This study identified 69 new genes associated to obesity-related traits using a powerful new method for performing TWAS using summary statistics by assessing the association between predicted gene expression (using all cis SNPs) and trait. [DOI] [PMC free article] [PubMed] [Google Scholar]
- 35.Zhu Z, et al. Integration of summary data from GWAS and eQTL studies predicts complex trait gene targets. Nature genetics. 2016;48:481–487. doi: 10.1038/ng.3538. [DOI] [PubMed] [Google Scholar]
- 36.Pavlides JMW, et al. Predicting gene targets from integrative analyses of summary data from GWAS and eQTL studies for 28 human complex traits. Genome Med. 2016;8:84. doi: 10.1186/s13073-016-0338-4. [DOI] [PMC free article] [PubMed] [Google Scholar]
- 37.Gibson G. Rare and common variants: twenty arguments. Nat Rev Genet. 2011;13:135–145. doi: 10.1038/nrg3118. [DOI] [PMC free article] [PubMed] [Google Scholar]
- 38.Zuk O, et al. Searching for missing heritability: designing rare variant association studies. Proceedings of the National Academy of Sciences of the United States of America. 2014;111:E455–64. doi: 10.1073/pnas.1322563111. [DOI] [PMC free article] [PubMed] [Google Scholar]
- 39.Lee S, Abecasis GR, Boehnke M, Lin X. Rare-Variant Association Analysis: Study Designs and Statistical Tests. The American Journal of Human Genetics. 2014;95:5–23. doi: 10.1016/j.ajhg.2014.06.009. [DOI] [PMC free article] [PubMed] [Google Scholar]
- 40.Lee S, Teslovich TM, Boehnke M, Lin X. General Framework for Meta-analysis of Rare Variants in Sequencing Association Studies. The American Journal of Human Genetics. 2013 doi: 10.1016/j.ajhg.2013.05.010. This was the first of three studies demonstrating that rare variant burden and overdispersion tests can be performed using summary statistics. [DOI] [PMC free article] [PubMed] [Google Scholar]
- 41.Hu YJ, et al. Meta-analysis of gene-level associations for rare variants based on single-variant statistics. American journal of human genetics. 2013;93:236–248. doi: 10.1016/j.ajhg.2013.06.011. [DOI] [PMC free article] [PubMed] [Google Scholar]
- 42.Liu DJ, et al. Meta-analysis of gene-level tests for rare variant association. Nature genetics. 2014;46:200–204. doi: 10.1038/ng.2852. [DOI] [PMC free article] [PubMed] [Google Scholar]
- 43.Faye LL, Machiela MJ, Kraft P, Bull SB, Sun L. Re-ranking sequencing variants in the post-GWAS era for accurate causal variant identification. PLoS genetics. 2013;9:e1003609. doi: 10.1371/journal.pgen.1003609. [DOI] [PMC free article] [PubMed] [Google Scholar]
- 44.Stephens M, Balding DJ. Bayesian statistical methods for genetic association studies. Nat Rev Genet. 2009;10:681–690. doi: 10.1038/nrg2615. [DOI] [PubMed] [Google Scholar]
- 45.Wellcome Trust Case Control, C et al. Bayesian refinement of association signals for 14 loci in 3 common diseases. Nature genetics. 2012;44:1294–1301. doi: 10.1038/ng.2435. This study used posterior probabilities of causality to construct credible sets of causal disease-associated SNPs across multiple loci and diseases, under a single causal variant per locus assumption. [DOI] [PMC free article] [PubMed] [Google Scholar]
- 46.Hormozdiari F, Kostem E, Kang EY, Pasaniuc B, Eskin E. Identifying causal variants at loci with multiple signals of association. Genetics. 2014;198:497–508. doi: 10.1534/genetics.114.167908. [DOI] [PMC free article] [PubMed] [Google Scholar]
- 47.Kichaev G, et al. Integrating functional data to prioritize causal variants in statistical fine-mapping studies. PLoS genetics. 2014;10:e1004722. doi: 10.1371/journal.pgen.1004722. [DOI] [PMC free article] [PubMed] [Google Scholar]
- 48.Chen W, et al. Fine Mapping Causal Variants with an Approximate Bayesian Method Using Marginal Test Statistics. Genetics. 2015;200:719–736. doi: 10.1534/genetics.115.176107. [DOI] [PMC free article] [PubMed] [Google Scholar]
- 49.Benner C, et al. FINEMAP: efficient variable selection using summary data from genome-wide association studies. Bioinformatics. 2016;32:1493–1501. doi: 10.1093/bioinformatics/btw018. [DOI] [PMC free article] [PubMed] [Google Scholar]
- 50.Newcombe PJ, Conti DV, Richardson S. JAM: A Scalable Bayesian Framework for Joint Analysis of Marginal SNP Effects. Genetic epidemiology. 2016;40:188–201. doi: 10.1002/gepi.21953. [DOI] [PMC free article] [PubMed] [Google Scholar]
- 51.van de Bunt M, et al. Evaluating the Performance of Fine-Mapping Strategies at Common Variant GWAS Loci. PLoS genetics. 2015;11:e1005535. doi: 10.1371/journal.pgen.1005535. [DOI] [PMC free article] [PubMed] [Google Scholar]
- 52.Li Y, Kellis M. Joint Bayesian inference of risk variants and tissue-specific epigenomic enrichments across multiple complex human diseases. Nucleic acids research. 2016:gkw627. doi: 10.1093/nar/gkw627. [DOI] [PMC free article] [PubMed] [Google Scholar]
- 53.Udler MS, et al. FGFR2 variants and breast cancer risk: fine-scale mapping using African American studies and analysis of chromatin conformation. Human molecular genetics. 2009;18:1692–1703. doi: 10.1093/hmg/ddp078. [DOI] [PMC free article] [PubMed] [Google Scholar]
- 54.Udler MS, Tyrer J, Easton DF. Evaluating the power to discriminate between highly correlated SNPs in genetic association studies. Genetic epidemiology. 2010;34:463–468. doi: 10.1002/gepi.20504. [DOI] [PubMed] [Google Scholar]
- 55.ENCODE Project Consortium. An integrated encyclopedia of DNA elements in the human genome. Nature. 2012;489:57–74. doi: 10.1038/nature11247. [DOI] [PMC free article] [PubMed] [Google Scholar]
- 56.Roadmap Epigenomics Consortium et al. Integrative analysis of 111 reference human epigenomes. Nature. 2015;518:317–330. doi: 10.1038/nature14248. [DOI] [PMC free article] [PubMed] [Google Scholar]
- 57.Maurano MT, et al. Systematic localization of common disease-associated variation in regulatory DNA. Science. 2012;337:1190–1195. doi: 10.1126/science.1222794. [DOI] [PMC free article] [PubMed] [Google Scholar]
- 58.Trynka G, et al. Chromatin marks identify critical cell types for fine mapping complex trait variants. Nature genetics. 2013;45:124–130. doi: 10.1038/ng.2504. [DOI] [PMC free article] [PubMed] [Google Scholar]
- 59.Pickrell JK. Joint analysis of functional genomic data and genome-wide association studies of 18 human traits. American journal of human genetics. 2014;94:559–573. doi: 10.1016/j.ajhg.2014.03.004. This study used Bayesian hierarchical model to estimate posterior probabilities of causality and identify functional annotations enriched for disease heritability, under a single causal variant per locus assumption. [DOI] [PMC free article] [PubMed] [Google Scholar]
- 60.Chung D, Yang C, Li C, Gelernter J, Zhao H. GPA: a statistical approach to prioritizing GWAS results by integrating pleiotropy and annotation. PLoS genetics. 2014;10:e1004787. doi: 10.1371/journal.pgen.1004787. [DOI] [PMC free article] [PubMed] [Google Scholar]
- 61.Kichaev G, Pasaniuc B. Leveraging Functional-Annotation Data in Trans-ethnic Fine-Mapping Studies. American journal of human genetics. 2015;97:260–271. doi: 10.1016/j.ajhg.2015.06.007. This study showed that fine-mapping accuracy can be improved by leveraging functional annotation data and trans-ethnic samples and modelling multiple causal variants per locus. [DOI] [PMC free article] [PubMed] [Google Scholar]
- 62.Farh KKH, et al. Genetic and epigenetic fine mapping of causal autoimmune disease variants. Nature. 2015;518:337–343. doi: 10.1038/nature13835. [DOI] [PMC free article] [PubMed] [Google Scholar]
- 63.Fuchsberger C, et al. The genetic architecture of type 2 diabetes. Nature. 2016;536:41–47. doi: 10.1038/nature18642. [DOI] [PMC free article] [PubMed] [Google Scholar]
- 64.Liu CT, et al. Trans-ethnic Meta-analysis and Functional Annotation Illuminates the Genetic Architecture of Fasting Glucose and Insulin. American journal of human genetics. 2016;99:56–75. doi: 10.1016/j.ajhg.2016.05.006. [DOI] [PMC free article] [PubMed] [Google Scholar]
- 65.Grubert F, et al. Genetic Control of Chromatin States in Humans Involves Local and Distal Chromosomal Interactions. Cell. 2015;162:1051–1065. doi: 10.1016/j.cell.2015.07.048. [DOI] [PMC free article] [PubMed] [Google Scholar]
- 66.Waszak SM, et al. Population Variation and Genetic Control of Modular Chromatin Architecture in Humans. Cell. 2015;162:1039–1050. doi: 10.1016/j.cell.2015.08.001. [DOI] [PubMed] [Google Scholar]
- 67.Zaitlen N, Pasaniuc B, Gur T, Ziv E, Halperin E. Leveraging genetic variability across populations for the identification of causal variants. American journal of human genetics. 2010;86:23–33. doi: 10.1016/j.ajhg.2009.11.016. [DOI] [PMC free article] [PubMed] [Google Scholar]
- 68.Morris AP. Transethnic meta-analysis of genomewide association studies. Genetic epidemiology. 2011;35:809–822. doi: 10.1002/gepi.20630. [DOI] [PMC free article] [PubMed] [Google Scholar]
- 69.Ong RTH, Wang X, Liu X, Teo YY. Efficiency of trans-ethnic genome-wide meta-analysis and fine-mapping. European journal of human genetics: EJHG. 2012;20:1300–1307. doi: 10.1038/ejhg.2012.88. [DOI] [PMC free article] [PubMed] [Google Scholar]
- 70.Asimit JL, Hatzikotoulas K, McCarthy M, Morris AP, Zeggini E. Trans-ethnic study design approaches for fine-mapping. European Journal of Human Genetics. 2016;24:1330–1336. doi: 10.1038/ejhg.2016.1. [DOI] [PMC free article] [PubMed] [Google Scholar]
- 71.Liu CT, et al. Multi-ethnic fine-mapping of 14 central adiposity loci. Human molecular genetics. 2014;23:4738–4744. doi: 10.1093/hmg/ddu183. [DOI] [PMC free article] [PubMed] [Google Scholar]
- 72.Kuo JZ, et al. Trans-ethnic fine mapping identifies a novel independent locus at the 3′ end of CDKAL1 and novel variants of several susceptibility loci for type 2 diabetes in a Han Chinese population. Diabetologia. 2013;56:2619–2628. doi: 10.1007/s00125-013-3047-1. [DOI] [PMC free article] [PubMed] [Google Scholar]
- 73.Chatterjee N, Shi J, Garcia-Closas M. Developing and evaluating polygenic risk prediction models for stratified disease prevention. Nat Rev Genet. 2016;17:392–406. doi: 10.1038/nrg.2016.27. [DOI] [PMC free article] [PubMed] [Google Scholar]
- 74.Chatterjee N, et al. Projecting the performance of risk prediction based on polygenic analyses of genome-wide association studies. Nature genetics. 2013;45:400–5. 405e1–3. doi: 10.1038/ng.2579. [DOI] [PMC free article] [PubMed] [Google Scholar]
- 75.International Schizophrenia Consortium et al. Common polygenic variation contributes to risk of schizophrenia and bipolar disorder. Nature. 2009;460:748–752. doi: 10.1038/nature08185. This study used polygenic risk scores to predict schizophrenia risk with appreciable accuracy, implicating a highly polygenic disease architecture. [DOI] [PMC free article] [PubMed] [Google Scholar]
- 76.Stahl EA, et al. Bayesian inference analyses of the polygenic architecture of rheumatoid arthritis. Nature genetics. 2012;44:483–489. doi: 10.1038/ng.2232. [DOI] [PMC free article] [PubMed] [Google Scholar]
- 77.Vilhjalmsson BJ, et al. Modeling Linkage Disequilibrium Increases Accuracy of Polygenic Risk Scores. American journal of human genetics. 2015;97:576–592. doi: 10.1016/j.ajhg.2015.09.001. [DOI] [PMC free article] [PubMed] [Google Scholar]
- 78.Henderson CR. Best linear unbiased estimation and prediction under a selection model. Biometrics. 1975;31:423–447. [PubMed] [Google Scholar]
- 79.de los Campos G, Gianola D, Allison DB. Predicting genetic predisposition in humans: the promise of whole-genome markers. Nat Rev Genet. 2010;11:880–886. doi: 10.1038/nrg2898. [DOI] [PubMed] [Google Scholar]
- 80.Speed D, Balding DJ. MultiBLUP: improved SNP-based prediction for complex traits. Genome research. 2014;24:1550–1557. doi: 10.1101/gr.169375.113. [DOI] [PMC free article] [PubMed] [Google Scholar]
- 81.Zhou X, Carbonetto P, Stephens M. Polygenic Modeling with Bayesian Sparse Linear Mixed Models. PLoS genetics. 2013;9 doi: 10.1371/journal.pgen.1003264. [DOI] [PMC free article] [PubMed] [Google Scholar]
- 82.Moser G, et al. Simultaneous Discovery, Estimation and Prediction Analysis of Complex Traits Using a Bayesian Mixture Model. PLoS genetics. 2015;11:e1004969. doi: 10.1371/journal.pgen.1004969. [DOI] [PMC free article] [PubMed] [Google Scholar]
- 83.Wray NR, et al. Pitfalls of predicting complex traits from SNPs. Nat Rev Genet. 2013;14:507–515. doi: 10.1038/nrg3457. [DOI] [PMC free article] [PubMed] [Google Scholar]
- 84.Palla L, Dudbridge F. A Fast Method that Uses Polygenic Scores to Estimate the Variance Explained by Genome-wide Marker Panels and the Proportion of Variants Affecting a Trait. American journal of human genetics. 2015;97:250–259. doi: 10.1016/j.ajhg.2015.06.005. [DOI] [PMC free article] [PubMed] [Google Scholar]
- 85.Bulik-Sullivan BK, et al. LD Score regression distinguishes confounding from polygenicity in genome-wide association studies. Nature genetics. 2015;47:291–295. doi: 10.1038/ng.3211. [DOI] [PMC free article] [PubMed] [Google Scholar]
- 86.Yang J, et al. Genomic inflation factors under polygenic inheritance. European Journal of Human Genetics. 2011;19:807–812. doi: 10.1038/ejhg.2011.39. [DOI] [PMC free article] [PubMed] [Google Scholar]
- 87.Yang J, et al. Common SNPs explain a large proportion of the heritability for human height. Nature genetics. 2010;42:565–569. doi: 10.1038/ng.608. [DOI] [PMC free article] [PubMed] [Google Scholar]
- 88.Loh PR, et al. Contrasting genetic architectures of schizophrenia and other complex diseases using fast variance-components analysis. Nature genetics. 2015;47:1385–1392. doi: 10.1038/ng.3431. [DOI] [PMC free article] [PubMed] [Google Scholar]
- 89.Finucane HK, et al. Partitioning heritability by functional annotation using genome-wide association summary statistics. Nature genetics. 2015;47:1228–1235. doi: 10.1038/ng.3404. [DOI] [PMC free article] [PubMed] [Google Scholar]
- 90.Yang J, et al. Genome partitioning of genetic variation for complex traits using common SNPs. Nature genetics. 2011;43:519–525. doi: 10.1038/ng.823. [DOI] [PMC free article] [PubMed] [Google Scholar]
- 91.Cotsapas C, et al. Pervasive Sharing of Genetic Effects in Autoimmune Disease. PLoS genetics. 2011;7:e1002254. doi: 10.1371/journal.pgen.1002254. [DOI] [PMC free article] [PubMed] [Google Scholar]
- 92.Sivakumaran S, et al. Abundant pleiotropy in human complex diseases and traits. American journal of human genetics. 2011;89:607–618. doi: 10.1016/j.ajhg.2011.10.004. [DOI] [PMC free article] [PubMed] [Google Scholar]
- 93.Styrkársdottir U, et al. Nonsense mutation in the LGR4 gene is associated with several human diseases and other traits. Nature. 2013;497:517–520. doi: 10.1038/nature12124. [DOI] [PubMed] [Google Scholar]
- 94.Denny JC, et al. Systematic comparison of phenome-wide association study of electronic medical record data and genome-wide association study data. Nature Biotechnology. 2013;31:1102–1110. doi: 10.1038/nbt.2749. [DOI] [PMC free article] [PubMed] [Google Scholar]
- 95.Gusev A, et al. Quantifying missing heritability at known GWAS loci. PLoS genetics. 2013;9:e1003993. doi: 10.1371/journal.pgen.1003993. [DOI] [PMC free article] [PubMed] [Google Scholar]
- 96.Stefansson H, et al. CNVs conferring risk of autism or schizophrenia affect cognition in controls. Nature. 2014;505:361–366. doi: 10.1038/nature12818. [DOI] [PubMed] [Google Scholar]
- 97.Pickrell JK, et al. Detection and interpretation of shared genetic influences on 42 human traits. Nature genetics. 2016 doi: 10.1038/ng.3570. This study applied a Bayesian framework to identify pleiotropic effects across a broad set of complex traits and diseases. [DOI] [PMC free article] [PubMed] [Google Scholar]
- 98.Voight BF, et al. Plasma HDL cholesterol and risk of myocardial infarction: a mendelian randomisation study. Lancet. 2012;380:572–580. doi: 10.1016/S0140-6736(12)60312-2. [DOI] [PMC free article] [PubMed] [Google Scholar]
- 99.Burgess S, Butterworth A, Thompson SG. Mendelian randomization analysis with multiple genetic variants using summarized data. Genetic epidemiology. 2013;37:658–665. doi: 10.1002/gepi.21758. [DOI] [PMC free article] [PubMed] [Google Scholar]
- 100.Burgess S, Dudbridge F, Thompson SG. Combining information on multiple instrumental variables in Mendelian randomization: comparison of allele score and summarized data methods. Stat Med. 2016;35:1880–1906. doi: 10.1002/sim.6835. [DOI] [PMC free article] [PubMed] [Google Scholar]
- 101.Lee SH, et al. Genetic relationship between five psychiatric disorders estimated from genome-wide SNPs. Nature genetics. 2013;45:984–+. doi: 10.1038/ng.2711. [DOI] [PMC free article] [PubMed] [Google Scholar]
- 102.Bulik-Sullivan B, et al. An atlas of genetic correlations across human diseases and traits. Nature genetics. 2015;47:1236–1241. doi: 10.1038/ng.3406. This study introduced a new method for estimating genome-wide genetic correlations from summary statistics. [DOI] [PMC free article] [PubMed] [Google Scholar]
- 103.Brown BC, Asian Genetic Epidemiology Network-Type 2 Diabetes, C. Ye CJ, Price AL, Zaitlen N. Transethnic Genetic-Correlation Estimates from Summary Statistics. American journal of human genetics. 2016;99:76–88. doi: 10.1016/j.ajhg.2016.05.001. [DOI] [PMC free article] [PubMed] [Google Scholar]
- 104.Nieuwboer HA, Pool R, Dolan CV, Boomsma DI, Nivard MG. GWIS: Genome-Wide Inferred Statistics for Functions of Multiple Phenotypes. American journal of human genetics. 2016 doi: 10.1016/j.ajhg.2016.07.020. [DOI] [PMC free article] [PubMed] [Google Scholar]
- 105.Hormozdiari F, et al. Imputing Phenotypes for Genome-wide Association Studies. American journal of human genetics. 2016;99:89–103. doi: 10.1016/j.ajhg.2016.04.013. [DOI] [PMC free article] [PubMed] [Google Scholar]
- 106.Nature Genetics. Asking for more. Nature genetics. 2012;44:733–733. [Google Scholar]
- 107.Homer N, et al. Resolving Individuals Contributing Trace Amounts of DNA to Highly Complex Mixtures Using High-Density SNP Genotyping Microarrays. PLoS genetics. 2008;4:e1000167. doi: 10.1371/journal.pgen.1000167. [DOI] [PMC free article] [PubMed] [Google Scholar]
- 108.Yang J, Zaitlen NA, Goddard ME, Visscher PM, Price AL. Advantages and pitfalls in the application of mixed-model association methods. Nature genetics. 2014;46:100–106. doi: 10.1038/ng.2876. [DOI] [PMC free article] [PubMed] [Google Scholar]
- 109.Sankararaman S, Obozinski G, Jordan MI, Halperin E. Genomic privacy and limits of individual detection in a pool. Nature genetics. 2009;41:965–967. doi: 10.1038/ng.436. [DOI] [PubMed] [Google Scholar]
- 110.Visscher PM, Hill WG. The Limits of Individual Identification from Sample Allele Frequencies: Theory and Statistical Analysis. PLoS genetics. 2009;5:e1000628. doi: 10.1371/journal.pgen.1000628. [DOI] [PMC free article] [PubMed] [Google Scholar]
- 111.Erlich Y, Narayanan A. Routes for breaching and protecting genetic privacy. Nat Rev Genet. 2014;15:409–421. doi: 10.1038/nrg3723. [DOI] [PMC free article] [PubMed] [Google Scholar]
- 112.Madsen BE, Browning SR. A groupwise association test for rare mutations using a weighted sum statistic. PLoS genetics. 2009;5:e1000384. doi: 10.1371/journal.pgen.1000384. [DOI] [PMC free article] [PubMed] [Google Scholar]
- 113.Li B, Leal SM. Methods for detecting associations with rare variants for common diseases: application to analysis of sequence data. American journal of human genetics. 2008;83:311–321. doi: 10.1016/j.ajhg.2008.06.024. [DOI] [PMC free article] [PubMed] [Google Scholar]
- 114.Price A, et al. Pooled association tests for rare variants in exon resequencing studies. 2010;86:832–838. doi: 10.1016/j.ajhg.2010.04.005. [DOI] [PMC free article] [PubMed] [Google Scholar]
- 115.Neale BM, et al. Testing for an Unusual Distribution of Rare Variants. PLoS genetics. 2011;7:e1001322. doi: 10.1371/journal.pgen.1001322. [DOI] [PMC free article] [PubMed] [Google Scholar]
- 116.Wu MC, et al. Rare-Variant Association Testing for Sequencing Data with the Sequence Kernel Association Test. The American Journal of Human Genetics. 2011;89:82–93. doi: 10.1016/j.ajhg.2011.05.029. [DOI] [PMC free article] [PubMed] [Google Scholar]
- 117.Daetwyler HD, Villanueva B, Woolliams JA. Accuracy of Predicting the Genetic Risk of Disease Using a Genome-Wide Approach. PloS one. 2008;3:e3395. doi: 10.1371/journal.pone.0003395. [DOI] [PMC free article] [PubMed] [Google Scholar]
- 118.Lee SH, Wray NR, Goddard ME, Visscher PM. Estimating missing heritability for disease from genome-wide association studies. American journal of human genetics. 2011;88:294–305. doi: 10.1016/j.ajhg.2011.02.002. [DOI] [PMC free article] [PubMed] [Google Scholar]
- 119.Zheng J, et al. LD Hub: a centralized database and web interface to perform LD score regression that maximizes the potential of summary level GWAS data for SNP heritability and genetic correlation analysis. Bioinformatics. 2016 doi: 10.1093/bioinformatics/btw613. [DOI] [PMC free article] [PubMed] [Google Scholar]