

Abstract
Objectives
Social activity is associated with healthy aging and preserved cognition. Such activity includes a confluence of social support and verbal interaction, each influencing cognition through rarely parsed, mechanistically distinct pathways. We created a novel verbal interaction measure for the Wisconsin Registry for Alzheimer’s Prevention (WRAP) and assessed reliability of resultant data, a first step toward mechanism-driven examination of social activity as a modifiable predictor of cognitive health.
Methods
Two WRAP subsamples completed a test-retest study to determine 8-week stability (N=107) and 2-year stability (N=136) of verbal interaction, and 2-year stability of perceived social support. Reliability was determined using quadratic-weighted kappa, percent agreement, or correlation coefficients.
Results
Reliability was fair to almost perfect. The association between social support and interaction quantity decreased with age.
Discussion
Social activity data demonstrate moderate to excellent temporal stability. Moreover, in older individuals, social support and verbal interaction represent two distinct dimensions of social activity.
Keywords: reliability, social support, verbal interaction, older adults, social activity questionnaire
Introduction
Social activity has been examined as a protective factor for several health outcomes (Cohen, 2004). Higher levels of social activity across the lifespan may be associated with better cognitive function and reduced risk for cognitive decline and Alzheimer’s disease (Fratiglioni, Wang, Ericsson, Maytan, & Winblad, 2000; James, Wilson, Barnes, & Bennett, 2011; Seeman, Lusignolo, Albert, & Berkman, 2001; Seeman et al., 2011; Zuelsdorff et al., 2013); however, mechanisms behind this relationship are not well documented. Here we consider two dimensions of social activity, social support and social (verbal) interaction, both of which may plausibly and independently influence cognitive function and rate of decline with advancing age. Research on social engagement and cognitive health has often interpreted the reduced risk for decline within a mechanistic framework of stress and coping, wherein social support provides relief from health-damaging stress (Cohen & Wills, 1985). Few studies have methodologically addressed other effects of social activity, such as intellectual stimulation during verbal interaction, despite the common conclusion that such stimulation represents a form of environmental enrichment and likely contributes to brain health and cognitive reserve (Bassuk, Glass, & Berkman, 1999; Hultsch, Hertzog, Small, & Dixon, 1999; Seeman et al., 2011; Ybarra et al., 2008; Ybarra & Winkielman, 2012).
The lack of tools designed to quantify verbal interaction in large populations of adults represents a gap that must be addressed before more rigorous exploration of potential benefits is possible. Although some studies have specifically sought to determine the potentially enriching role of verbal interaction, no validated instrument for collecting detailed information on quantity and quality of such interaction currently exists. One of the most ambitious time-use surveys (Hamermesh, Frazis, & Stewart, 2005) does attempt to quantify time spent socializing and communicating within select social domains, but the diary format employed may be difficult to utilize in large cohort studies and/or those seeking to minimize additional participant burden. Additionally, a few validated instruments assess the valence (positive vs. negative), but not quantity, of social exchanges (Newsom, Rook, Nishishiba, Sorkin, & Mahan, 2005; Ruehlman & Karoly, 1991). The ideal instrument should serve several purposes. First, it should accurately approximate the total amount of time that a participant spends actively engaged in conversation with other people. Second, it should assess average quality or valence of those interactions, which might be pleasant, unpleasant, or neutral. Valence of interaction could play a role in mitigation or generation of stress, thereby becoming important in stress-and-coping pathways (Ingersoll-Dayton, Morgan, & Antonucci, 1997; Rook, Luong, Sorkin, Newsom, & Krause, 2012; Sneed & Cohen, 2014; Windsor, Gerstorf, Pearson, Ryan, & Anstey, 2014); ergo, controlling for valence is essential in distinguishing the benefits of neuronally stimulating but affect-neutral verbal interaction from the cognitive health effects of interaction-related feelings of social support (positive valence) or stress (negative valence). Third, it should interrogate different domains of interaction, both to stimulate more accurate recall by participants and to differentiate between domains that represent a positive, neutral, or negative, potentially stress-generating, experience.
We developed and piloted a novel verbal interaction questionnaire, assessing quantity and quality of verbal interaction across a broad range of social milieu within the Wisconsin Registry for Alzheimer’s Prevention (WRAP)(Sager, Hermann, & La Rue, 2005). The WRAP study is a longitudinal cohort study collecting rich biological, sociodemographic, and lifestyle data from middle-aged and older adults to explore factors that may, over the adult life course, influence risk of developing Alzheimer’s disease. Our larger goal is to rigorously examine the cognitive benefits of modifiable sociobehavioral factors, including support as well as the more rarely explored verbal interaction construct, in the WRAP sample; we also hope to encourage and enable similar studies in other samples. As such, the primary aim of this preliminary study was to evaluate both the short- and long-term reliability of our social activity instrument. We hypothesized that among the population as a whole, test-retest reliability should be high over both intervals, and that it should be higher over a short six-week interval than over a two-year interval. In secondary analyses, undertaken as an early exploration of construct validity, we examined the impact of key life events on reliability. We hypothesized that if discrepancies in test-retest data are due to real changes in network rather than noise, then test-retest reliability should be notably lower for individuals reporting such upheavals. Finally, in consideration of the theory of socioemotional selectivity, which describes age-related emotional prioritization of close social ties, positing that over time more casual interactions become less emotionally rewarding (Carstensen, 1992), we also explored the relationship between quantity of interaction and the perception of available social support stratified by age. We predicted that interaction quantity would be less strongly associated with perceived support in older participants.
Material and methods
Participants
Study participants were drawn from WRAP, an ongoing, longitudinal cohort study of initially asymptomatic middle-aged and older adults. The WRAP sample is enriched for a parental history of Alzheimer’s disease (AD); two-thirds of the total WRAP sample (N=1,500) have at least one parent with diagnosed AD. All participants were cognitively normal at baseline as determined by scores on neuropsychological testing at their Wave 1 visit. Exclusion criteria for the current study include a history of multiple sclerosis, Parkinson’s disease, stroke, epilepsy, or meningitis. WRAP’s study design and assessment protocols are described in detail elsewhere (Sager et al., 2005). In brief, enrollment began in 2001; participants returned for follow-up visits four years after baseline (Wave 2) and every two years after that. At each visit, participants complete an extensive neuropsychological test battery and respond to questionnaires examining health and lifestyle factors. While certain elements of the battery and questionnaires are constant across all visits, the study protocol does allow for addition of promising new measures such as the one described in this paper.
Development and Implementation of the Questionnaire
The Perceived Social Support and Verbal Interaction Questionnaire described in this study represents a combination of established and novel items. First, social support items were drawn from the previously validated Medical Outcomes Study Social Support Survey (Sherbourne & Stewart, 1991). For each of nine items representing types of social support, participants were asked to rate the frequency of availability of social support on a five-point scale, with response options ranging from 0 (none of the time) to 4 (all of the time). Responses from all nine items were summed to create a support index score (possible range, 0-36). Second, questions on the quantity and quality of face-to-face verbal interactions were developed for seven distinct social domains; domains were chosen based on existing social network and social exchange literature (Heaney & Israel, 2008; Litwin, 2001; Peek & O’Neill, 2001; van Tilburg, 1998) and tailored for WRAP participants, many of whom are still in the workforce and/or engaged in hobbies or group activities. Participants reported quantity of verbal interaction on a six-point scale (Less than 30 minutes, Between 30 and 59 minutes, Between 1 and 1.5 hours, Between 1.5 and 2 hours, Over 2 hours, or a Not Applicable option) in each of seven social domains (see Supplementary Table 1). To account for the possibility of substitution or trade-off (for example, a decrease in time spent interacting with friends if time spent interacting with colleagues increased), a summed total time index score, using either midpoint of time range in a given response or written-in quantity, was created to represent the average number of minutes per week spent verbally interacting with others. To assess qualitative valence of verbal interactions, each of the social domains included a follow-up inquiry on quality. Items on mediated forms of synchronous interaction including phone calls and Skype, as well as asynchronous interactions including instant messaging, text messaging, email, and letter-writing are also included in the questionnaire. However, because evolving technologies and associated learned skills are an intrinsic and time-dependent part of such communications, and because different brain processes may be involved, the data from those items were considered separately and are not analyzed in the present study.
Survey Administration
The full Perceived Social Support and Verbal Interaction Questionnaire was added to the WRAP assessment packet for Wave 2 and all subsequent visits beginning in 2010. Two subsamples of WRAP participants are represented in the current study, designed to provide reliability data for future analyses incorporating the entirety of the longitudinal WRAP sample. Short-interval reliability of data was assessed in a convenience sample of participants (N=107) returning for a regularly scheduled study visit in the five months following IRB approval of the new items. These participants completed the new questionnaire as part of their visit and at that visit consented to complete the verbal interactions portion of the questionnaire again, via postage-paid mail-out, approximately six to eight weeks later. Long-interval reliability was assessed in a convenience sample of participants (N=136) with data from two regularly scheduled visits, approximately two years apart, available subsequent to the addition of the questionnaire to the WRAP assessment. All study activities were conducted with the approval of the University of Wisconsin Health Sciences Institutional Review Board and all subjects provided signed informed consent before participation.
Statistical Analyses
Acceptability and short- and long-interval test-retest reliability were assessed for the novel quantity and quality of verbal interaction variables. Long-interval test-retest reliability of social support items was assessed; reliability for up to one year has been established previously (Sherbourne & Stewart, 1991).
Acceptability of the verbal interaction items was assessed by a simple count of missing responses. Reliability was determined using quadratic-weighted kappa coefficients, percent agreement, or Pearson correlation coefficients. Pearson correlations were used to examine agreement for continuous variables (total weekly quantity of interaction time and a social support index score). A quadratic-weighted kappa statistic, which gives partial credit to similar (but not identical) categories, was used to determine reliability of within-domain categorical quantity- and quality-of-interaction variables; strength of agreement for these variables was defined according to Landis and Koch (Landis & Koch, 1977) as poor to fair (0.00-0.40), moderate (0.41-0.60), substantial (0.61-0.80), or almost perfect (≥0.81). Because low prevalence of one or more responses for a given item may lead to lower kappa values even when agreement is high, and this proved a concern for quality-of-interaction variables, we calculated overall percent agreement in addition to a weighted kappa coefficient for those variables.
To assess the contribution of real changes in social network connections to discrepancies in test-retest data, we utilized demographic and lifestyle data collected in WRAP, and stratified by the presence/absence of one or more major life events (change in marital status, living arrangement, or work status; long-term interval only). Strength of agreement was assessed in these “Stable” and “Change” strata. To simplify presentation while accounting for response prevalence, in these stratified analyses, quadratic-weighted kappa coefficients were calculated for quantity of interaction, and simple percent agreement for quality of interaction.
Finally, to explore our hypothesized distinction between the two dimensions of the social activity, perceived social support and verbal interaction we used Pearson correlations to examine the association between social support and total interaction quantity. We also combined both short- and long-interval samples and looked at the same association after stratifying by age (<65 vs. ≥65) to assess the socioemotional selectivity theory in our dataset.
Results
Two subsamples of WRAP participants are represented in the current study; sample characteristics for each group can be seen in Table 1. Mean sample ages were 59.0 and 59.5. Both samples were majority female and highly educated, with near two-thirds of each sample possessing at least a bachelor’s degree.
Table 1.
Key sample characteristics, short (8-week) and long (2-year) interval subsamples*
| Variable | Short Interval (N=107) | Long Interval (N=136) |
|---|---|---|
| Age, mean (SD) | 59.5 (7.3) | 59.0 (6.8) |
| Gender, N (%) | ||
| Female | 76 (71%) | 90 (66%) |
| Male | 31 (29%) | 46 (34%) |
| Education, N (%) | ||
| <Bachelor’s degree | 40 (37%) | 39 (29%) |
| ≥Bachelor’s degree | 67 (63%) | 97 (71%) |
| Life Events, N (%) | ||
| Stable | N/A | 100 (74%) |
| Change in marital/partner status | N/A | 9 (7%) |
| Change in living arrangement | N/A | 10 (7%) |
| Change in employment status | N/A | 25 (18%) |
| Weekly hours of interaction, mean (SD) | 20.3 (14.2) | 18.7 (12.7) |
A total of three participants were included in both groups
Frequency of response and acceptability
Distribution of responses (combined sample including both short- and long-interval subsamples, N=243) within each social domain can be seen in Table 2. The distribution of both quantity and quality responses varied by social domain. Acceptability, measured by the number of missing responses, appears excellent.
Table 2.
Percentage distribution of response to quantitative and qualitative verbal interaction items, by timepoint
| Quantitative Items (N=243) | |||||||
|---|---|---|---|---|---|---|---|
| Don’t have this contact | Less than 30 minutes | 30-59 minutes | 1-1.5 hours | 1.5-2 hours | Over 2 hours | Missing response | |
| If you have a spouse or partner, how much time on average do you spend in face-to-face conversations with them each day? | |||||||
| Test | 19.3 | 14.0 | 32.9 | 14.0 | 13.2 | 6.6 | 0.0 |
| Retest | 19.3 | 14.4 | 32.1 | 13.2 | 10.3 | 10.3 | 0.4 |
| How much time on average do you spend in face-to-face conversations with family members other than your spouse or partner each week? | |||||||
| Test | 7.0 | 35.4 | 21.8 | 10.7 | 11.5 | 13.2 | 0.4 |
| Retest | 5.3 | 33.3 | 22.2 | 12.8 | 13.6 | 12.8 | 0.0 |
| How much time on average do you spend in face-to-face conversations with close friends each week? | |||||||
| Test | 1.6 | 29.2 | 21.4 | 12.8 | 16.9 | 18.1 | 0.0 |
| Retest | 3.3 | 25.5 | 24.3 | 14.4 | 15.2 | 17.3 | 0.0 |
| When you go to religious services or church, how much time at each service do you spend in face-to-face conversations with other people? | |||||||
| Test | 34.6 | 49.4 | 12.8 | 2.9 | 0.4 | 0.0 | 0.0 |
| Retest | 35.0 | 49.4 | 14.0 | 0.8 | 0.4 | 0.4 | 0.0 |
| When you go to a meeting of a club, lodge, or parent group, how much time at each meeting do you spend in face-to-face interactions with other people? | |||||||
| Test | 43.2 | 17.7 | 23.0 | 10.7 | 3.7 | 1.6 | 0.0 |
| Retest | 42.8 | 17.3 | 21.0 | 8.2 | 9.1 | 1.6 | 0.0 |
| How much time on average do you spend in face-to-face conversations with colleagues each day that you work?a | |||||||
| Test | 2.1 | 10.3 | 14.4 | 10.7 | 14.0 | 17.3 | 0.0 |
| Retest | 2.1 | 9.9 | 17.7 | 11.9 | 9.1 | 15.6 | 0.0 |
| How much time on average do you spend in face-to-face conversations with strangers or people you don’t know very well each week (e.g., doctors, waitresses, store clerks, etc.)? | |||||||
| Test | 0.1 | 40.1 | 25.9 | 9.5 | 12.3 | 10.7 | 0.0 |
| Retest | <0.1 | 35.0 | 34.6 | 7.8 | 5.8 | 16.5 | 0.0 |
| Qualitative Items: How pleasant or unpleasant do you find these interactions to be most of the time?b | |||||||
| Unpleasant | Neutral | Pleasant | Missing response | ||||
| Spouse or partner | |||||||
| Test (N=196) | 2.6 | 11.2 | 85.7 | 0.5 | |||
| Retest (N=196) | 2.0 | 11.7 | 86.2 | 0.0 | |||
| Other family members | |||||||
| Test (N=226) | 2.7 | 4.9 | 92.0 | 0.4 | |||
| Retest (N=230) | 1.3 | 6.5 | 92.2 | 0.0 | |||
| Close friends | |||||||
| Test (N=239) | 0.0 | 2.1 | 97.5 | 0.4 | |||
| Retest (N=235) | 0.0 | 3.0 | 97.0 | 0.0 | |||
| Religious services or church | |||||||
| Test (N=171) | 1.2 | 9.5 | 85.4 | 0.0 | |||
| Retest (N=162) | 0.6 | 10.5 | 88.9 | 0.0 | |||
| Club, lodge, or parent group meetings | |||||||
| Test (N=119) | 0.0 | 5.9 | 94.1 | 0.0 | |||
| Retest (N=145) | 1.4 | 7.6 | 91.0 | 0.0 | |||
| Colleagues | |||||||
| Test (N=162) | 0.6 | 14.8 | 84.6 | 0.0 | |||
| Retest (N=145) | 0.7 | 11.0 | 95.7 | 0.0 | |||
| Strangers or people you don’t know very well | |||||||
| Test (N=241) | 0.0 | 23.2 | 76.8 | 0.0 | |||
| Retest (N=242) | 0.0 | 19.0 | 81.0 | 0.0 | |||
Only participants (N=167 at test timepoint and N=161 at retest timepoint) who reported working outside of the home were asked to quantify time spent interacting with colleagues. Those responding that they “don’t have this contact” do work outside the home but do not verbally interact with colleagues.
Sample sizes are variable because only individuals reporting some interaction in a given social domain answered a follow-up quality question.
Quantity of Interaction
Results from reliability analyses are shown in Table 3. For both short and long intervals, weighted kappa values for quantity items indicated moderate to substantial agreement between test and retest points. Only spouse/partner and church/religious meeting domains showed substantial agreement for both intervals, while family member and stranger domains demonstrated only moderate repeatability for both intervals. No major differences between short-term and long-term reliability were seen for any domain. Percent agreement, based on number of exactly repeated responses, was generally lower than the quadratic-weighted kappa statistic. Correlation in reported total weekly time spent interacting was reasonably strong for both short (r=.61, p<.001) and long (r=.58, p<.001) intervals.
Table 3.
Measures of agreement for quantity and quality of verbal interactions over short (8-week) and long (2-year) intervals
| Item | Kappa (CI) or Pearson’s r (p) | % agreement | ||
|---|---|---|---|---|
| Short | Long | Short | Long | |
| Quantity of Interaction (time spent in face-to-face conversation) | ||||
| Spouse or partner | .79 (.68-.90) | .72 (.61-.83) | 51 | 55 |
| Family members | .59 (.44-.73) | .53 (.38-.67) | 41 | 42 |
| Close friends | .69 (.56-.81) | .52 (.38-.65) | 44 | 38 |
| Church or religious meetings | .71 (.56-.85) | .75 (.66-.85) | 79 | 82 |
| Club meetings | .66 (.52-.80) | .52 (.39-.65) | 58 | 44 |
| Colleagues | .54 (.33-.74) | .70 (.57-.85) | 45 | 48 |
| Strangers | .60 (.44-.76) | .49 (.33-.65) | 50 | 47 |
| Total, weekly (Pearson’s r) | .61 (p<.001) | .58 (p<.001) | ||
| Quality of Interaction (within-domain valence: pleasant, neutral, or unpleasant) | ||||
| Spouse or partner | .45 (.21-.70) | .61 (.44-.78) | 84 | 83 |
| Family members | .35 (.06-.65) | .46 (.26-.66) | 91 | 90 |
| Close friends | .56 (.37-.75) | .40 (.20-.60) | 97 | 95 |
| Church or religious meetings | .49 (.30-.68) | .50 (.27-.73) | 88 | 89 |
| Club meetings | .47 (.28-.65) | .36 (.18-.55) | 93 | 89 |
| Colleagues | .45 (.26-.64) | .51 (.33-.70) | 81 | 86 |
| Strangers | .47 (.29-.64) | .54 (.40-.67) | 79 | 83 |
| Total Social Support (Pearson’s r) | N/A | .78 (p<.001) | ||
Quality of Interaction
Reports of “Unpleasant” interaction in a given domain were rare in all domains (1.8% of all quality-of-interaction responses, across both samples) and even “neutral” interactions were rarely reported in select domains such as friends and club meetings; that low prevalence is reflected in the very low quality-of-interaction weighted kappa values. Percent agreement was fairly high for both the short (79-97%) and long (83-95%) intervals. Agreement was lowest for interactions with strangers and highest for interactions with friends.
Social Support
Association between social support index scores over the long test-retest interval was strong (r=.78, p<.001). Data were not available to assess the test-retest reliability of social support over the short interval.
Life Events
In a stratified analysis, those participants in the long-interval sample who experienced major life events between visits - change in marital status (7%), living arrangement (7%), or employment status (25%) - showed patterns of test-retest agreement that were distinct from those seen in individuals with relative life stability (Figure 1). For quantity of interaction, weighted kappa values were lower among the life change group in all but one domain; the church/religious meeting domain represented a marked exception (Figure 1a). For quality of interaction variables, percent agreement was similar between the stable and life change groups across all domains (Figure 1b). However, in our summary index scores for quantity of interaction and social support, key differences reappeared (Figure 1c). In the group experiencing a major life event, test-retest agreement on interaction was relatively lower (r=.19, p=.287) than it was in the stable group (r=.67, p<.001). Social support showed somewhat greater agreement in the stable group.
Figure 1.
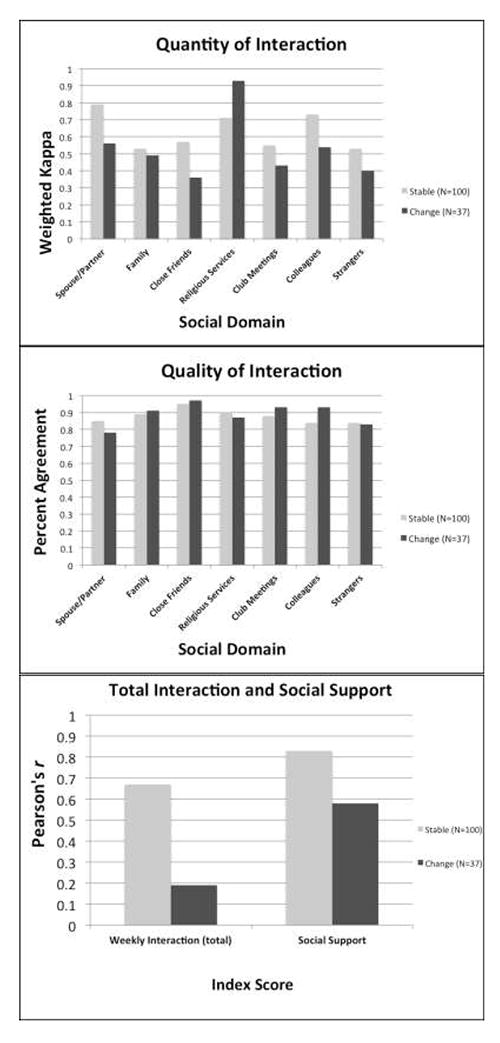
Agreement for quantity of interaction, quality of interaction, and summary index scores among stable and life change groups
Interaction and Support
In a combined sample of all test-retest comparisons (N=243), there were statistically significant, but somewhat weak correlations between total weekly interaction and social support (r=.25, p<.001). In a stratified analysis, participants under 65 years old (N=183) showed relatively stronger correlation between verbal interaction and social support (r=.30, p<.001, N=183) than did participants aged 65 and older (r=.06, p=.67, N=60).
Discussion
This preliminary study reports the development of a novel instrument designed to assess verbal interaction in adults, as well as the reliability assessment of this instrument and an established Perceived Social Support questionnaire. Repeatability of verbal interaction quantity was promising in a population of middle aged and older men and women. Weighted kappa values, which do accord partial credit for agreement when test-retest responses are similar but not identical, were stronger than percentage agreement, indicating that test-retest response shifts to nearby categories were common and should be expected. In contrast, the quality of interaction responses showed excellent percent agreement; moves between responses were rare. Consistent with the body of evidence showing that increased age is associated with reduced exposure to negative social interactions (Birditt, Fingerman, & Almeida, 2005; Fingerman, Miller, & Charles, 2008), the prevalence of the “Pleasant” response was often very high, and the “Unpleasant” response nearly absent. Because the response agreement due to chance alone (expected agreement) is high in such a situation, and kappa values decrease as expected agreement increases, the relatively low weighted kappa values were unsurprising (Viera & Garrett, 2005). Reliability of social support data, assessed only for the long interval, was good. Items were taken from the validated MOS questionnaire, so this finding was expected. This analysis does provide evidence that the good social support reliability seen in a study of a one-year interval in a community sample (Sherbourne & Stewart, 1991) holds for longer intervals in middle-aged to older samples as well.
A secondary analysis stratifying participants in the long-term interval sample by the presence or absence of at least one of three major life events during the test-retest interim was conducted to assess the contributions of presumably true changes in social network and behavior over both other time-dependent fluctuations and random error or noise. Although other life events, such as health events that limit mobility, impacting network and interaction were likely experienced by some of the individuals included in the stable (no major life events) group, resulting in some misclassification, our results indicate that there were differences in agreement between the groups; the summary score for overall quantity of interaction illustrates this especially well. While in most cases agreement was, as expected, lower in the “change” (life event) group, it is interesting to note that interactions at church or religious meetings actually remain most consistent in the change group, perhaps indicating a tendency to strongly adhere to individual preference (whether engaging in or eschewing religious meeting attendance, and associated interactions) in the face of major life changes. Though care must be taken when making assumptions of temporal stability in small samples, the finding that interim occurrence of a major life event led to time-discordant verbal interaction and social support responses was encouraging in terms of instrument validity.
Finally, our finding that the relationship between reported verbal interaction and perception of social support was somewhat weak (r=.25, p<.001) provided evidence for our hypothesis that the two dimensions of social activity are distinct from one another and should be considered separately when assessing cognitive health benefits. Further, we saw preliminary evidence of socioemotional selectivity in our participants; older participants demonstrated a weaker link between their quantity of social interaction and their perception of available social support than did younger participants, indicating that these social dimensions become even more distinct as individuals age.
This preliminary study has limitations. Most notably, data that would provide the opportunity for a rigorous assessment of convergent and divergent validity is unavailable for this sample. Our participants report spending an average of approximately twenty hours per week engaged in active, face-to-face conversation with other people, but the lack of similar instrumentation in other samples makes it difficult to know what “typical” weekly interactions might have been expected. Additionally, while our subsamples are representative of the WRAP sample as a whole, the WRAP sample may not be representative of broader aging populations: first, although WRAP enrollment is currently focused on underrepresented ethnic and socioeconomic groups, the current sample is mostly white, education levels are notably high, women are overrepresented, and although neuropsychological tests revealed no cognitive impairment in our study subsamples, the WRAP sample as a whole is enriched for a family history of AD and, as such, is at risk for earlier cognitive change and incident dementia compared to the general population. Further, sample sizes in stratified analyses were small, giving rise to wide confidence intervals. Finally, our ability to distinguish discordance due to poor recall or random error from discordance due to real changes in lifestyle and social networks was limited. Certainly self-reported verbal interaction data, as a proxy for gold standard measures such as short-term diary keeping or even automated audio recording, is potentially vulnerable to recall bias and to measurement error generally; this vulnerability must be considered particularly carefully in studies of cognitive impairment. However, maximizing recruitment, retention, and generalizability requires minimizing participant burden and many epidemiological studies must rely on self-report. In the absence of similar existing instruments, we believe that our verbal interaction measure, which demonstrated excellent acceptability, provides an important contribution to research on social networks and health; the benefits of casual conversation may be seen by providers and by patients alike as a particularly modifiable aspect of social networks, and an accessible form of activity regardless of age or ability. In consideration of a plausible and important role for social interaction in later-life health trajectories, we believe these early findings can inform a more nuanced understanding and analytic strategy in the study of psychosocial and sociobehavioral factors in healthy aging.
Supplementary Material
Acknowledgments
Funding
This work was supported by the University of Wisconsin – Madison Graduate School. The WRAP program is funded by the Helen Bader Foundation, Northwestern Mutual Foundation, Extendicare Foundation, Clinical and Translational Science Award (CTSA) program through the NIH National Center for Advancing Translational Sciences (NCATS) grant UL1-TR000427, and National Institute on Aging grant 5R01-AG27161-2 (Wisconsin Registry for Alzheimer’s Prevention: Biomarkers of Preclinical AD).
Footnotes
Declaration of Conflicting Interests
The authors declare no potential conflicts of interest with respect to the research, authorship, and/or publication of this article
References
- Bassuk SS, Glass TA, Berkman LF. Social disengagement and incident cognitive decline in community-dwelling elderly persons. Annals of Internal Medicine. 1999;131(3):165–173. doi: 10.7326/0003-4819-131-3-199908030-00002. [DOI] [PubMed] [Google Scholar]
- Birditt KS, Fingerman KL, Almeida DM. Age differences in exposure and reactions to interpersonal tensions: A daily diary study. Psychology of Aging. 2005;20(2):330. doi: 10.1037/0882-7974.20.2.330. [DOI] [PubMed] [Google Scholar]
- Carstensen LL. Social and emotional patterns in adulthood: Support for socioemotional selectivity theory. Psychology of Aging. 1992;7(3):331–338. doi: 10.1037//0882-7974.7.3.331. [DOI] [PubMed] [Google Scholar]
- Cohen S. Social relationships and health. American Psychologist. 2004;59(8):676–684. doi: 10.1037/0003-066X.59.8.676. [DOI] [PubMed] [Google Scholar]
- Cohen S, Wills TA. Stress, social support, and the buffering hypothesis. Psychological Bulletin. 1985;98(2):310–357. [PubMed] [Google Scholar]
- Fingerman KL, Miller L, Charles S. Saving the best for last: How adults treat social partners of different ages. Psychology of Aging. 2008;23(2):399–409. doi: 10.1037/0882-7974.23.2.399. [DOI] [PMC free article] [PubMed] [Google Scholar]
- Fratiglioni L, Wang HX, Ericsson K, Maytan M, Winblad B. Influence of social network on occurrence of dementia: A community-based longitudinal study. Lancet. 2000;355(9212):1315–1319. doi: 10.1016/S0140-6736(00)02113-9. [DOI] [PubMed] [Google Scholar]
- Hamermesh DS, Frazis H, Stewart J. Data Watch: The American Time Use Survey. Journal of Economic Perspectives. 2005;19(1):221–232. [Google Scholar]
- Heaney CA, Israel BA. Social networks and social support. In: Glanz K, Rimer BK, Viswanath K, editors. Health behavior and health education: theory, research, and practice. 4. San Francisco: Wiley & Sons; 2008. pp. 189–207. [Google Scholar]
- Hultsch DF, Hertzog C, Small BJ, Dixon RA. Use it or lose it: Engaged lifestyle as a buffer of cognitive decline in aging? Psychology of Aging. 1999;14(2):245–263. doi: 10.1037//0882-7974.14.2.245. [DOI] [PubMed] [Google Scholar]
- Ingersoll-Dayton B, Morgan D, Antonucci T. The effects of positive and negative social exchanges on aging adults. Journals of Gerontology Series B: Psychological Sciences and Social Sciences. 1997;52(4):S190–199. doi: 10.1093/geronb/52b.4.s190. [DOI] [PubMed] [Google Scholar]
- James BD, Wilson RS, Barnes LL, Bennett DA. Late-life social activity and cognitive decline in old age. Journal of the International Neuropsychological Society. 2011;17(6):998–1005. doi: 10.1017/S1355617711000531. [DOI] [PMC free article] [PubMed] [Google Scholar]
- Landis JR, Koch GG. The measurement of observer agreement for categorical data. Biometrics. 1977;33(1):159–174. [PubMed] [Google Scholar]
- Litwin H. Social network type and morale in old age. Gerontologist. 2001;41(4):516–524. doi: 10.1093/geront/41.4.516. [DOI] [PubMed] [Google Scholar]
- Newsom JT, Rook KS, Nishishiba M, Sorkin DH, Mahan TL. Understanding the relative importance of positive and negative social exchanges: Examining specific domains and appraisals. The Journals of Gerontology Series B: Psychological Sciences and Social Sciences. 2005;60B(6):P304–P312. doi: 10.1093/geronb/60.6.p304. [DOI] [PMC free article] [PubMed] [Google Scholar]
- Peek MK, O’Neill GS. Networks in later life: An examination of race differences in social support networks. International Journal of Aging and Human Development. 2001;52(3):207–229. doi: 10.2190/F1Q1-JV7D-VN77-L6WX. [DOI] [PubMed] [Google Scholar]
- Rook KS, Luong G, Sorkin DH, Newsom JT, Krause N. Ambivalent versus problematic social ties: Implications for psychological health, functional health, and interpersonal coping. Psychology of Aging. 2012;27(4):912–923. doi: 10.1037/a0029246. [DOI] [PMC free article] [PubMed] [Google Scholar]
- Ruehlman LS, Karoly P. With a little flak from my friends: Development and preliminary validation of the Test of Negative Social Exchange (TENSE) Psychological Assessment: A Journal of Consulting and Clinical Psychology. 1991;3(1):97–104. [Google Scholar]
- Sager MA, Hermann B, La Rue A. Middle-aged children of persons with Alzheimer’s disease: APOE genotypes and cognitive function in the Wisconsin Registry for Alzheimer’s Prevention. Journal of Geriatric Psychiatry and Neurology. 2005;18(4):245–249. doi: 10.1177/0891988705281882. [DOI] [PubMed] [Google Scholar]
- Seeman TE, Lusignolo TM, Albert M, Berkman L. Social relationships, social support, and patterns of cognitive aging in healthy, high-functioning older adults: MacArthur studies of successful aging. Health Psychology. 2001;20(4):243–255. doi: 10.1037//0278-6133.20.4.243. [DOI] [PubMed] [Google Scholar]
- Seeman TE, Miller-Martinez DM, Stein Merkin S, Lachman ME, Tun PA, Karlamangla AS. Histories of social engagement and adult cognition: Midlife in the U.S. Study. Journals of Gerontology Series B: Psychological Sciences and Social Sciences. 2011 doi: 10.1093/geronb/gbq091. [DOI] [PMC free article] [PubMed] [Google Scholar]
- Sherbourne CD, Stewart AL. The MOS social support survey. Social Science & Medicine. 1991;32(6):705–714. doi: 10.1016/0277-9536(91)90150-b. [DOI] [PubMed] [Google Scholar]
- Sneed RS, Cohen S. Negative social interactions and incident hypertension among older adults. Health Psychology. 2014;33(6):554–565. doi: 10.1037/hea0000057. [DOI] [PMC free article] [PubMed] [Google Scholar]
- van Tilburg T. Losing and gaining in old age: Changes in personal network size and social support in a four-year longitudinal study. Journals of Gerontology Series B: Psychological Sciences and Social Sciences. 1998;53(6):S313–323. doi: 10.1093/geronb/53b.6.s313. [DOI] [PubMed] [Google Scholar]
- Viera AJ, Garrett JM. Understanding interobserver agreement: The kappa statistic. Family Medicine. 2005;37(5):360–363. [PubMed] [Google Scholar]
- Windsor TD, Gerstorf D, Pearson E, Ryan LH, Anstey KJ. Positive and negative social exchanges and cognitive aging in young-old adults: Differential associations across family, friend, and spouse domains. Psychology of Aging. 2014;29(1):28–43. doi: 10.1037/a0035256. [DOI] [PubMed] [Google Scholar]
- Ybarra O, Burnstein E, Winkielman P, Keller MC, Manis M, Chan E, Rodriguez J. Mental exercising through simple socializing: Social interaction promotes general cognitive functioning. Personality and Social Psychology Bulletin. 2008;34(2):248–259. doi: 10.1177/0146167207310454. [DOI] [PubMed] [Google Scholar]
- Ybarra O, Winkielman P. On-line social interactions and executive functions. Frontiers in Human Neuroscience. 2012;6:75. doi: 10.3389/fnhum.2012.00075. [DOI] [PMC free article] [PubMed] [Google Scholar]
- Zuelsdorff ML, Engelman CD, Friedman EM, Koscik RL, Jonaitis EM, Rue AL, Sager MA. Stressful events, social support, and cognitive function in middle-aged adults with a family history of Alzheimer’s disease. Journal of Aging and Health. 2013;25(6):944–959. doi: 10.1177/0898264313498416. [DOI] [PMC free article] [PubMed] [Google Scholar]
Associated Data
This section collects any data citations, data availability statements, or supplementary materials included in this article.