

Abstract
Objective
The Sjögren's International Collaborative Clinical Alliance (SICCA) is an international data registry and biorepository derived from a multisite observational study of participants in whom genotyping was performed on the Omni2.5M platform and who had undergone deep phenotyping using common protocol‐directed methods. The aim of this study was to examine the genetic etiology of Sjögren's syndrome (SS) across ancestry and disease subsets.
Methods
We performed genome‐wide association study analyses using SICCA subjects and external controls obtained from dbGaP data sets, one using all participants (1,405 cases, 1,622 SICCA controls, and 3,125 external controls), one using European participants (585, 966, and 580, respectively), and one using Asian participants (460, 224, and 901, respectively) with ancestry adjustments via principal components analyses. We also investigated whether subphenotype distributions differ by ethnicity, and whether this contributes to the heterogeneity of genetic associations.
Results
We observed significant associations in established regions of the major histocompatibility complex (MHC), IRF5, and STAT4 (P = 3 × 10−42, P = 3 × 10⁻¹⁴, and P = 9 × 10⁻¹⁰, respectively), and several novel suggestive regions (those with 2 or more associations at P < 1 × 10⁻⁵). Two regions have been previously implicated in autoimmune disease: KLRG1 (P = 6 × 10⁻⁷ [Asian cluster]) and SH2D2A (P = 2 × 10⁻⁶ [all participants]). We observed striking differences between the associations in Europeans and Asians, with high heterogeneity especially in the MHC; representative single‐nucleotide polymorphisms from established and suggestive regions had highly significant differences in the allele frequencies in the study populations. We showed that SSA/SSB autoantibody production and the labial salivary gland focus score criteria were associated with the first worldwide principal component, indicative of higher non‐European ancestry (P = 4 × 10⁻¹⁵ and P = 4 × 10⁻⁵, respectively), but that subphenotype differences did not explain most of the ancestry differences in genetic associations.
Conclusion
Genetic associations with SS differ markedly according to ancestry; however, this is not explained by differences in subphenotypes.
Sjögren's syndrome (SS) is a systemic autoimmune disease affecting primarily the lacrimal and salivary glands and occurs in ∼0.5–1% of the population 1. Patients typically present with dry eyes and/or dry mouth, but confirmation of the diagnosis using American College of Rheumatology (ACR) classification criteria requires a positive result for any 2 of the 3 following tests: presence of SS autoantibodies (primarily SSA and SSB), presence of focal lymphocytic sialadenitis in labial salivary gland (LSG) biopsy, and degree of eye damage due to keratoconjunctivitis sicca (KCS) 2.
While there have been relatively few family studies in SS compared to the number of family studies in other autoimmune diseases, there is an increased prevalence of autoimmune diseases in families with SS 3, and the sibling risk ratio in a Taiwanese population was recently estimated to be 19% 4. Genetic variants in multiple HLA class II genes in the major histocompatibility complex (MHC) region 6p21.3 have been well established as SS risk factors 5. More recently, a genome‐wide association study (GWAS) of SS in subjects of European descent 6 established associations of SS with gene regions IRF5–TNP03, STAT4, IL12A, FAM167A–BLK, DDX6–CXCR5, and TNIP1. In addition, a GWAS of SS in Han Chinese participants identified GTF2I as a susceptibility locus in that population 7.
The Sjögren's International Collaborative Clinical Alliance (SICCA) is an international data registry and biorepository derived from a multisite observational study for which participants were enrolled between 2004 and 2012 from the University of Buenos Aires, Argentina; Peking Union Medical College, Beijing, China; Rigshopitalet, Copenhagen, Denmark; Kanazawa Medical University, Ishikawa, Japan; King's College, London, UK; University of California, San Francisco (UCSF), California; Aravind Eye Hospital, Madurai, India; Johns Hopkins University (JHU), Baltimore, Maryland; and University of Pennsylvania, Philadelphia, Pennsylvania. In addition to whole‐genome genotyping, SICCA participants underwent extensive phenotyping using common comprehensive protocol‐directed methods for collection of data and specimens across all sites 2, 8. More information about the SICCA registry is available online at http://sicca-online.ucsf.edu. SICCA collaborators in addition to those who are authors are listed in Appendix A.
Although the small set of genes described above have been identified as contributing to SS susceptibility, relatively little is known compared with what is known about other autoimmune diseases, particularly how susceptibility and severity are affected by ancestry and how subphenotypes may be influenced by different genes and/or ethnicity. For example, in systemic lupus erythematosus (SLE), Northern Europeans have less severe disease including lower susceptibility for nephritis 9, 10, and double‐stranded DNA (dsDNA)–negative SLE has a genetic profile different from that of dsDNA‐positive SLE 11. One population‐based study of SS in a multiethnic cohort in the greater Paris area showed that non‐European participants had a higher prevalence of SS, were younger, and were more likely to have SS autoantibodies and polyclonal hypergammaglobulinemia compared with non‐European participants 12.
The SICCA registry offers a unique opportunity to expand our knowledge of the genetic etiology of SS in 2 principal ways: 1) it is the first international SS cohort including participants of non‐European ancestry and participants of European ancestry genotyped together on a whole‐genome platform, and 2) extensive phenotyping using consistent methods across all sites allows these genetic data to be analyzed in conjunction with clinical data on disease manifestations, enabling the combined effects of genetics, ancestry, and subphenotypes to be jointly examined.
PATIENTS AND METHODS
Study population and clinical data
SICCA
All SS patients are SICCA participants who fulfilled the ACR classification criteria for primary SS 2. This collection is described in detail in refs. 2 and 8. All research was approved by an institutional review board or appropriate ethics committee at each SICCA site. Table 1 shows the distribution of these participants according to self‐reported ethnicity.
Table 1.
Numbers of participants according to data source and self‐reported ethnicitya
| Registry | European | African | Asian | Hispanic/Native American | Mixed/other/unspecified |
|---|---|---|---|---|---|
| SICCA | |||||
| Allb | 1,840 | 83 | 913 | 358 | 161 |
| Participants with SS | 669 | 51 | 570 | 164 | 59 |
| Participants without SS | 1,109 | 31 | 306 | 191 | 101 |
| AREDS | 1,659 | 0 | 0 | 0 | 0 |
| COGEND | 910 | 464 | 0 | 46 | 47 |
| IGANGWAS | 0 | 0 | 897 | 0 | 0 |
| HapMap | 18 | 11 | 8 | 16 | 0 |
SICCA = Sjögren's International Collaborative Clinical Alliance; SS = Sjögren's syndrome; AREDS = Age‐Related Eye Disease Study; COGEND = Collaborative Study of Nicotine Dependence; IGANGWAS = IgA Nephropathy genome‐wide association study (GWAS).
Includes participants with an ambiguous SS classification due to missing data and participants with secondary SS not included in the GWAS.
Evaluation of the classification criteria relies on the following measures from clinical data that we use in our analysis: 1) presence of SSA/Ro or SSB/La autoantibodies; 2) a focus score of >1, measuring the degree of focal sialadenitis in LSG biopsy specimens 13; and 3) an ocular staining score (OSS) of ≥3, measuring the degree of damage due to KCS 14. Fulfillment of 2 of the 3 criteria items described above is sufficient for classification as SS according to the ACR. SICCA participants who were unambiguously negative for SS (i.e., at least 2 of 3 criteria were known to be negative) were also included in the control group, along with healthy external (out‐of‐study) controls (see below).
External controls
Out‐of‐study controls were obtained from 3 dbGaP data sets: Age‐Related Eye Disease Study (AREDS; phs000001.v3.p1) Genetic Variation of Refractive Error Substudy (phs000429.v1.p1), Collaborative Study of Nicotine Dependence (COGEND; phs000404.v1.p1), and IgA Nephropathy GWAS (IGANGWAS; phs000431.v2.p1). Table 1 shows the distribution of these participants according to self‐reported ethnicity (see also Supplementary Methods, available on the Arthritis & Rheumatology web site at http://onlinelibrary.wiley.com/doi/10.1002/art.40040/abstract). Specimens obtained from AREDS and COGEND participants were typed on the Illumina HumanOmni2.5M‐4v1 platform, and IGANGWAS participants were typed on the Illumina Human610‐Quad v1 platform.
Genotyping and quality assurance
DNA specimens obtained from SICCA participants were genotyped in 2 phases on the Illumina HumanOmni2.5‐4v1 or Illumina HumanOmni2.5M‐8v1‐1 array (2.5 million single‐nucleotide polymorphisms [SNPs] genome‐wide) at the Center for Inherited Disease Research. Quality control and merging of genotypes from the 2 phases were performed at the University of Washington Genetics Coordinating Center, as previously described 15. SNPs were removed if they were monomorphic or positional duplicates; had a missing call rate of ≥2%; had 2 or more discordant calls in 170 SICCA duplicates; had 1 or more discordant calls in 38 cross‐phase SICCA duplicates; had 5 or more Mendelian errors in 76 SICCA and HapMap trios; had a Hardy‐Weinberg equilibrium test P value of <10−4 in participants with self‐identified European ancestry; or contained large chromosomal anomalies such as regions of aneuploidy. After quality control was performed (post–quality control), 1,444,884 SNPs were analyzed; these SICCA genotype data are available through dbGaP (accession no. phs000672.v1.p1). For this analysis, SNPs with a minor allele frequency (MAF) of <2% were removed.
Samples with unresolved identity issues (unexpected duplicates or genotypes inconsistent with expected family structure) or no case report form were removed. All remaining samples had call rates of ≥98%. For this analysis, family members were removed by selecting a maximum set of unrelated (through third‐degree relationships via identical by descent analysis) participants. The numbers of post–quality control samples are shown in Table 1.
All external control data sets were filtered to have 2% MAFs and 98% genotyping of SNPs and individuals. Additional cross‐study quality control performance is described in Supplementary Methods (available on the Arthritis & Rheumatology web site at http://onlinelibrary.wiley.com/doi/10.1002/art.40040/abstract). Overlap in post–quality control SNPs between the 1,444,884 SNPs from the Omni2.5M chip and the 483,279 SNPs from the Illumina 610K chip resulted in 302,689 SNPs for analyses in the Asian cluster, which included IGANGWAS controls; this is hereinafter referred to as the 300K overlap SNP set.
Statistical analysis
Ancestry
Principal components analysis (PCA) using EigenStrat 16 was used for ancestry estimation (see Supplementary Methods, available on the Arthritis & Rheumatology web site at http://onlinelibrary.wiley.com/doi/10.1002/art.40040/abstract). Three PCAs were performed: an intercontinental PCA of all participants (see Supplementary Figure 1, available on the Arthritis & Rheumatology web site at http://onlinelibrary.wiley.com/doi/10.1002/art.40040/abstract), yielding PC1 (principal component 1), PC2, and so on; an intracontinental PCA of a European‐only cluster (Supplementary Figure 2), yielding EPC1 (European PC1), EPC2, and so on; and an intracontinental PCA of an Asian‐only cluster (Supplementary Figure 3), yielding APC1 (Asian PC1), APC2, and so on. The Asian cluster was also split into Chinese and Japanese clusters (APC1 >0, APC1 <0) for some analyses.
Based on the leveling of the scree plots, we used EPC1 to adjust for ancestry within the European cluster, and we used APC1 and APC2 to adjust for ancestry within the Asian cluster. In the intercontinental PCA, the top 4 PCs were sufficient to cluster major populations: PC1 differentiated European versus Asian; similarly, PC2 differentiated African ancestry, PC3 differentiated American Indian ancestry, and PC4 differentiated Indian ancestry. PCs 5–9 were each highly correlated with one of the top 3 European or top 2 Asian PCs (see Supplementary Methods, available on the Arthritis & Rheumatology web site at http://onlinelibrary.wiley.com/doi/10.1002/art.40040/abstract); therefore, we adjusted for 9 PCs in our all‐subjects regressions to account for both intercontinental substructure and the intracontinental substructure of these population groups.
GWAS
Due to the multiethnic and multiplatform nature of our study, we performed multiple phases of analysis using logistic regression for each SNP as a predictor of case–control status: 1) analysis of all SICCA participants and external controls (AREDS and COGEND) genotyped on the Omni2.5M platform (1,444,854 SNPs), adjusting for 9 PCs, sex, and smoking status (see Supplementary Methods, available on the Arthritis & Rheumatology web site at http://onlinelibrary.wiley.com/doi/10.1002/art.40040/abstract); 2) analysis of only the European cluster, adjusting for the top intra‐European PC (EPC1), sex, and smoking status (see Supplementary Methods); 3) meta‐analysis of the 2 Asian clusters, including Chinese external controls (IGANGWAS) typed on the Illumina 610 Quad, for SNPs in the 300K overlap set. Analysis of the China and Japan subgroups were performed via logistic regression, adjusting for the top 2 intra‐Asian PCs (APC1 and APC2) and sex. The number of subjects included in each analysis is described in Figure 1 and Supplementary Table 1 (available on the Arthritis & Rheumatology web site at http://onlinelibrary.wiley.com/doi/10.1002/art.40040/abstract).
Figure 1.
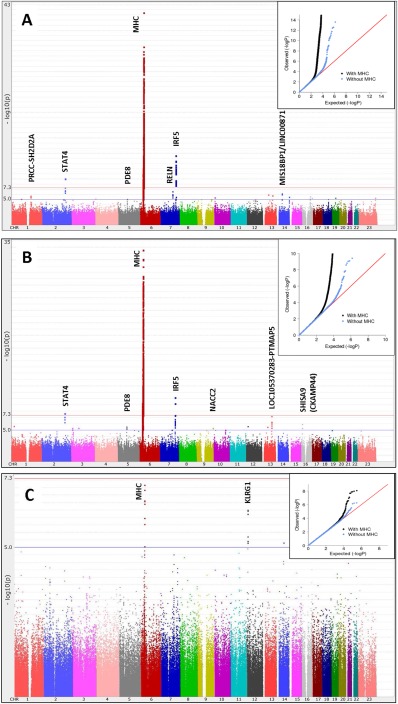
Manhattan plots of the results of the genome‐wide association studies (GWAS) with logistic regression in patients with Sjögren's syndrome. A, Global GWAS (1,405 cases, 1,622 Sjögren's International Collaborative Clinical Alliance [SICCA] controls, and 3,125 external controls) using 1,444,854 single‐nucleotide polymorphisms (SNPs), with adjustment for 9 intercontinental principal components (PCs) and smoking (λ = 1.02). B, European subgroup GWAS (585 cases, 966 SICCA controls, and 580 external controls) using the same set of SNPs described in A, with adjustment for 1 intra‐European PC and smoking (λ = 1.002). C, Meta‐analysis of the Chinese (λ = 1.03) and Japanese (λ = 1.03) subgroups of the Asian GWAS (460 cases, 224 SICCA controls, and 901 external controls) using 302,688 SNPs, with adjustment for 2 intra‐Asian PCs. Insets, Q–Q plots. MHC = major histocompatibility complex; Chr. = chromosome.
Regulatory evidence for sites of interest was collected from RegulomeDB 17 and ANNOVAR 18 data; evidence for association with related phenotypes was collected from National Center for Biotechnology Information Phenotype–Genotype Integrator (http://www.ncbi.nlm.nih.gov/gap/phegeni). For follow‐up in the KLRG1 region, we imputed genotypes for all European and Asian participants up to the 1000 Genomes reference panel starting from the 300K overlap SNP set, using IMPUTE2 software 19.
SNP selection for downstream analyses
We undertook several analyses in order to determine whether or not the apparent differences between Asian and European associations were true heterogeneity of association or were attributable to other factors such as differences in allele frequency between populations or disease heterogeneity between population groups and/or sites. For these analyses and for multivariate modeling, we chose representative SNPs from our case–control analyses: one SNP per region with at least 2 associations that were suggestive (P × 10−5) or stronger in any of our 3 GWAS (all participants, European cluster, and Asian cluster). We also selected representative SNPs from the top hits in published European 6 and Asian 7 GWAS. SNPs with the strongest association from the 300K overlap set were selected to allow comparisons and multivariate modeling with our full Asian control data; in some cases, a proxy SNP was chosen. A total of 24 SNPs were selected (see Supplementary Methods and Supplementary Table 2, available on the Arthritis & Rheumatology web site at http://onlinelibrary.wiley.com/doi/10.1002/art.40040/abstract).
Heterogeneity
We quantified heterogeneity between the European and Asian GWAS using Q and I2 statistics from meta‐analysis of the 2 studies, using Plink. For the MHC region, we also imputed HLA alleles using SNP2HLA 20 and the HapMap CEU (Utah residents with ancestry from northern and western Europe) reference panel for the Europeans and a Pan‐Asian reference panel (described in ref. 21) for the Asians. Associations with HLA allele doses in each population group were analyzed in Plink, and the results were meta‐analyzed to assess heterogeneity. In order to investigate or exclude heterogeneity of disease subtypes, we repeated some analyses using only cases meeting all 3 of the classification criteria.
RESULTS
Global GWAS
Our global GWAS (Figure 1A) of the approximately 1.4 million post–quality control SNPs showed genome‐wide significant peaks in established SS regions, namely the MHC, STAT4, and IRF5. We also observed several suggestive association peaks, as shown in Figure 1A and Table 2, with the most significant being in RELN (odds ratio [OR] 1.4, P = 3 × 10⁻⁷) on 7q22.1, and on 14q21.2 between MIS18BP1 and LINC00871 (OR 0.61, P = 7 × 10⁻⁷). A suggestive region on 1q23.1 (OR 1.5, P = 2 × 10⁻⁶) included SH2D2A, which has been shown to be associated with other autoimmune disorders. Our top SNPs in SH2D2A were located in peaks of DNase I hypersensitivity sites for numerous cell types, and this region has been shown via ChIP‐Seq to bind to protein CCAAT/enhancer binding protein β (CEBPB), a known regulator of immune and inflammatory response genes. Additional suggestive regions were in PDE8B (OR 0.75, P = 8 × 10⁻⁶) on 5q13.3 and NFAT5 (OR 1.28, P = 2 × 10⁻⁶) on 16q22.1.
Table 2.
Top SNPs in regions having 2 or more suggestive or stronger associations in the case–control analysesa
| GWAS | Chr. (kbp) | Gene region | SNP | OR | 95% CI | P | |
|---|---|---|---|---|---|---|---|
| All subjects | 1 (156,774) | PRCC/SH2D2A | rs16837677 | 1.54 | 1.29–1.84 | 2 × 10⁻⁶ | |
| All subjects | 1 (156,774) | PRCC/SH2D2A | rs16837672 | 1.53 | 1.28–1.83 | 2 × 10⁻⁶ | |
| All subjects | 2 (191,944) | STAT4 | rs11889341 | 1.40 | 1.26–1.56 | 9 × 10⁻¹⁰ | |
| European | 2 (191,965) | STAT4 | rs7574865 | 1.51 | 1.31–1.75 | 2 × 10⁻⁸ | |
| All subjects | 2 (191,965) | STAT4 | rs7574865 | 1.35 | 1.21–1.50 | 5 × 10⁻⁸ | |
| Europeans | 2 (191,969) | STAT4 | rs8179673 | 1.48 | 1.28–1.71 | 8 × 10⁻⁸ | |
| European | 3 (14,715) | GRIP2/CCDC174 | rs79407237 | 0.61 | 0.49–0.75 | 5 × 10⁻⁶ | |
| European | 3 (14,682) | GRIP2/CCDC174 | rs17318848 | 0.63 | 0.51–0.77 | 9 × 10⁻⁶ | |
| European | 5 (76,591) | PDE8B | rs181851 | 0.67 | 0.56–0.79 | 3 × 10⁻⁶ | |
| European | 5 (76,600) | PDE8B | rs11949070 | 0.67 | 0.57–0.80 | 5 × 10⁻⁶ | |
| All subjects | 5 (76,620) | PDE8B | rs10474500 | 0.75 | 0.66–0.85 | 8 × 10⁻⁶ | |
| All subjects | 5 (76,553) | PDE8B | rs10464287 | 1.53 | 1.27–1.84 | 9 × 10⁻⁶ | |
| All subjects | 6 (32,591) | MHC (HLA–DRB1, HLA–DQA1) | rs9271573 | 2.02 | 1.82–2.23 | 3 × 10−42 | |
| All subjects | 6 (32,623) | MHC (HLA–DQA1, HLA–DQB1) | rs3021302 | 2.24 | 1.97–2.54 | 2 × 10⁻³⁵ | |
| European | 6 (32,591) |
MHC (HLA–DRB1/HLA
|
rs9271573 | 2.29 | 2.01–2.62 | 3 × 10⁻³⁴ | |
| European | 6 (32,679) | MHC (HLA–DQB1/HLA–DQA2) | rs9275572 | 2.28 | 1.99–2.61 | 7 × 10⁻³³ | |
| Asian | 6 (33,056) | MHC (HLA–DPB1) | rs9277554 | 1.65 | 1.37–2.00 | 3 × 10⁻⁷ | |
| Asian | 6 (33,053) | MHC (HLA–DPB1) | rs9277464 | 1.65 | 1.37–1.99 | 3 × 10⁻⁷ | |
| All subjects | 7 (128,580) | IRF5/TNP03 | rs3823536 | 1.49 | 1.34–1.65 | 3 × 10⁻¹⁴ | |
| All subjects | 7 (128,716) | IRF5/TNP03 | rs59110799 | 1.72 | 1.49–1.99 | 3 × 10⁻¹³ | |
| European | 7 (128,580) | IRF5/TNP03 | rs3823536 | 1.54 | 1.36–1.76 | 7 × 10⁻¹¹ | |
| European | 7 (128,581) | IRF5/TNP03 | rs3807306 | 1.50 | 1.32–1.71 | 6 × 10⁻¹⁰ | |
| All subjects | 7 (103,405) | RELN | rs7341475 | 1.39 | 1.23–1.57 | 3 × 10⁻⁷ | |
| All subjects | 7 (103,404) | RELN | rs73180120 | 1.36 | 1.20–1.54 | 1 × 10⁻⁶ | |
| European | 7 (103,405) | RELN | rs7341475 | 1.43 | 1.22–1.68 | 9 × 10⁻⁶ | |
| European | 9 (138,947) | NACC2 | rs4842091 | 1.39 | 1.21–1.61 | 5 × 10⁻⁶ | |
| European | 9 (138,948) | NACC2 | rs11103291 | 1.39 | 1.21–1.61 | 5 × 10⁻⁶ | |
| Asian | 12 (9,163) | KLRG1/M6PR | rs1805673 | 0.62 | 0.51–0.74 | 6 × 10⁻⁷ | |
| Asian | 12 (9,154) | KLRG1/M6PR | rs11048434 | 0.63 | 0.53–0.75 | 6 × 10⁻⁷ | |
| All subjects | 13 (47,951) | HTR2A/LINC00562 | rs7999279 | 1.42 | 1.23–1.63 | 1 × 10⁻⁶ | |
| European | 13 (47,951) | HTR2A/LINC00562 | rs7999279 | 1.52 | 1.27–1.81 | 3 × 10⁻⁶ | |
| European | 13 (82,162) | LOC105370283‐PTMAP5 | rs17074492 | 1.53 | 1.31–1.79 | 6 × 10⁻⁸ | |
| European | 13 (82,177) | LOC105370283‐PTMAP5 | rs67218188 | 1.49 | 1.28–1.74 | 5 × 10⁻⁷ | |
| All subjects | 13 (82,162) | LOC105370283‐PTMAP5 | rs17074492 | 1.37 | 1.20–1.56 | 2 × 10⁻⁶ | |
| All subjects | 14 (46,407) | MIS18BP1/LINC00871 | rs1957173 | 0.61 | 0.50–0.74 | 7 × 10⁻⁷ | |
| All subjects | 14 (46,375) | MIS18BP1/LINC00871 | rs17116722 | 0.60 | 0.49–0.74 | 1 × 10⁻⁶ | |
| All subjects | 16 (69,704) | NFAT5 | rs7192380 | 1.28 | 1.16–1.42 | 2 × 10⁻⁶ | |
| All subjects | 16 (69,633) | NFAT5 | kgp11747098 | 1.26 | 1.14–1.40 | 7 × 10⁻⁶ | |
| European | 16 (13,002) | SHISA9 | rs9938751 | 0.59 | 0.48–0.73 | 1 × 10⁻⁶ | |
| European | 16 (12,988) | SHISA9 | rs8046800 | 0.61 | 0.50–0.76 | 5 × 10⁻⁶ |
Up to 2 single‐nucleotide polymorphisms (SNPs) are included for each genome‐wide association study (GWAS)/gene. Chr. = chromosome; OR = odds ratio; 95% CI = 95% confidence interval.
European versus Asian GWAS
We performed subpopulation GWAS in our 2 largest ethnic groups. The European subgroup was analyzed using the same set of 1.4 million SNPs as described above; the Asian group was analyzed using the 300K set of SNPs overlapping with the Asian external controls that were added to increase power for this analysis. Figures 1B and C show Manhattan plots for the European and Asian GWAS, respectively, and details of the top SNPs are shown in Table 2. Two aspects are striking. First, the MHC region, while being the most significant region in the Asian participants, had a much weaker effect than that in the Europeans (in Europeans, peak OR 2.29, 95% confidence interval [95% CI] 2.01–2.62, P = 3 × 10⁻³⁴; in Asians, peak OR 1.65, 95% CI 1.37–2.00, P = 3 × 10⁻⁷). Second, the KLRG1 region (for the top SNP, OR 0.62, P = 6 × 10⁻⁷) had the next strongest associations in Asians but did not appear to be associated in Europeans. KLRG1 has been shown to be associated with SLE 22. Top SNPs in this region show strong evidence of immune regulation; ChIP‐Seq analysis has shown that they bind to multiple proteins including NF‐κB subunit 1 in B lymphocytes and are within DNase I hypersensitivity sites of B lymphocytes, Th1 cells, and Th17 cells.
The European GWAS also showed multiple suggestive association peaks (Figure 1B and Table 2); the strongest association (OR 1.5, P = 6 × 10⁻⁸) was in LOC105370283, a noncoding RNA, on 13q31.1 and near pseudogene PTMAP5. Other suggestive gene regions were CCDC174 (OR 0.61, P = 5 × 10⁻⁶) on 3p25.1, NACC2 (OR 1.39, P = 5 × 10⁻⁶) on 9q34.3, and SHISA9/CKAMP44 (OR 0.59, P = 1 × 10⁻⁶) on 16p13.12.
MHC region
Figures 2A and B show MHC region associations in the Asian and European clusters, respectively. In order to determine whether the observed differences were attributable to power differences, we randomly selected a subset of the European cases and controls, with sample sizes equal to those in the Asian analysis (460 cases and 1,125 controls) and repeated the analysis. Figure 2C shows the results of that analysis, which continued to demonstrate striking differences in significance and the location of peaks that are not explained by sample size differences. The top SNPs in Europeans were rs9271573 (P = 3 × 10⁻³⁴) and rs9275572 (P = 7 × 10⁻³³), which flank HLA–DQA1 and HLA–DQB1, as shown in Figure 2B. The top SNP in a secondary peak, rs6937545 (P = 6 × 10⁻³⁰), is downstream of HLA–DRA. The top SNPs in 2 association peaks in Asians (Figure 2A) were rs9277554 (P = 3 × 10⁻⁷) near HLA–DPB1 and rs6903608 (P = 1 × 10⁻⁶) in HLA–DRB9 (between HLA–DRA and HLA–DRB1).
Figure 2.
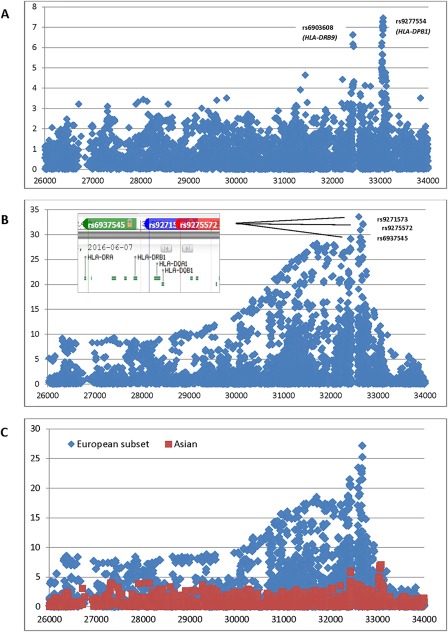
Major histocompatibility complex association plots. A, Asian subgroup. B, European subgroup. Inset. Relative positions of top single‐nucleotide polymorphisms and HLA genes from dbSNP. C, European subgroup (blue) with sample sizes (460 cases and 1,125 controls) equal to those in the Asian subgroup (red).
We also analyzed associations in imputed HLA alleles in the European and Asian subsets (Supplementary Table 3, available on the Arthritis & Rheumatology web site at http://onlinelibrary.wiley.com/doi/10.1002/art.40040/abstract) and conducted a meta‐analysis to assess heterogeneity. Of 41 alleles (of a total of 361) with significant (P < 0.0001) associations in Europeans, Asians, or in the meta‐analysis, 17 had an I2 value of >80%, indicating high heterogeneity, with an I2 value of 96.4 for HLA–DQA1*0103 (OR in Europeans [OREuro] 0.45, and OR in Asians [ORAsia] 1.56) and an I2 value of 94.9 for HLA–DQB1*0201 (OREuro 2.38 and ORAsia 1.03). In addition, 7 associations in Asians (all in HLA–DPA1/DPB1) could not be analyzed in Europeans due to low frequency.
KLRG1 region
In order to determine whether there might be associations in Europeans with untyped SNPs in the KLRG1 region, we imputed up to the 1000 Genomes reference panel starting from the set of SNPs common to both the Omni2.5M and Illumina 610K platforms. Supplementary Figure 4 (available on the Arthritis & Rheumatology web site at http://onlinelibrary.wiley.com/doi/10.1002/art.40040/abstract) shows associations of genotyped and imputed SNPs in the KLRG1 region for European and Asian participants separately. These data continued to show an Asian‐only effect of multiple KLRG1 SNPs on SS risk. Supplementary Table 4 (available on the Arthritis & Rheumatology web site at http://onlinelibrary.wiley.com/doi/10.1002/art.40040/abstract) shows the allele frequencies of the suggestive KLRG1 SNPs in various participant subgroups in our data set, indicating that the external controls were similar to internal controls, and that effect sizes were higher in the Chinese cluster than in the Japanese cluster.
Representative SNPs and multivariate modeling
We selected 24 representative SNPs in 20 regions with at least 2 suggestive (P < 1 × 10⁻⁵) or stronger associations in any of our 3 GWAS (all subjects, Europeans, and Asians) and from the top hits (or proxies) in published European 6 and Asian 7 GWAS (see Patients and Methods). Supplementary Table 2 (available on the Arthritis & Rheumatology web site at http://onlinelibrary.wiley.com/doi/10.1002/art.40040/abstract) contains details of the SNP/proxy selection, and Supplementary Table 5 (available on the Arthritis & Rheumatology web site at http://onlinelibrary.wiley.com/doi/10.1002/art.40040/abstract) contains results from the 3 GWAS. Although STAT4 and IRF5 SNPs did not meet the criteria for suggestive associations in our Asian GWAS, the ORs for these SNPs were similar across analyses. TNFAIP3 also had similar ORs across analyses and has been implicated previously in both European 23 and Asian 7 studies. Interestingly, the results of this analysis suggested that one of the GTF2I SNPs may be associated in Europeans, although it previously was implicated only in Asians 7. According to our data, BLK and CXCR5 SNPs had a stronger effect in Asians, whereas the effect of IL2A was much lower.
We also performed multivariate modeling of these SNPs in the European and Asian subgroups separately, adjusting for intra‐European and intra‐Asian PCs, respectively (see Patients and Methods). We executed logistic regression analysis with backward selection, with thresholds of P < 0.01 for the European subset and P < 0.05 for the Asian subset due to the smaller sample size. The results of this analysis are shown in Supplementary Table 6, available on the Arthritis & Rheumatology web site at http://onlinelibrary.wiley.com/doi/10.1002/art.40040/abstract. These data continue to support that GTF2I is a risk variant in Europeans and also indicate that the effect of the PRCC–SH2D2A region may be more prominent in Asians or non‐Europeans.
Investigation of sources of heterogeneity
As shown in Supplementary Figure 5 (available on the Arthritis & Rheumatology web site at http://onlinelibrary.wiley.com/doi/10.1002/art.40040/abstract), we plotted the heterogeneity P value from the Q statistic for the 24 representative SNPs between the European and Asian analyses versus the difference in MAF between controls in the 2 population groups. Although most of these SNPs had highly significant allele frequency differences, there was also substantial heterogeneity of association; i.e., the frequency differences did not fully explain these differences in association.
One potential source of genetic heterogeneity is the heterogeneity of underlying subphenotypes in the population groups. Table 3 shows the percentage of cases positive for SSA/SSB autoantibodies, focus score criteria, and OSS criteria. The percentage of cases positive for these criteria was much higher in the Asian cluster compared with the European cluster, which may be attributable to ascertainment and/or associations between ethnicity and subphenotypes (see below). Next, we studied the degree to which global ancestry, represented by our top 3 worldwide PCs, correlates with the subphenotypes described above. As shown in Table 3, we observed strongly significant correlations between PC1 (European/Asian axis) and all 3 subphenotypes (for SSA/SSB, r = −0.27 [P = 5 × 10−47); for focus score, r = −0.18 [P = 2 × 10⁻²¹]; for OSS, r = −0.12 [P = 2 × 10⁻¹⁴]). We also observed strongly significant correlations between PC3 (American Indian/non–American Indian axis) and the focus score and OSS, although the correlation coefficients were modest (absolute value <0.1).
Table 3.
Subphenotype differences between the European and Asian clusters, and correlations with the top 3 worldwide PCs, in SICCA participantsa
| SSA/SSB | Focus score | OSS | |
|---|---|---|---|
| European cluster, no. meeting criteria/total no. (%) | 553/1,663 (33) | 526/1,568 (34) | 1,126/1,600 (70) |
| Asian cluster, no. meeting criteria/total no. (%) | 439/704 (62) | 351/647 (54) | 575/680 (85) |
| Top 3 worldwide PCs | |||
| PC1, r (P) | −0.27 (5 × 10−47) | −0.18 (2 × 10⁻²¹) | −0.12 (2 × 10⁻¹⁴) |
| PC2, r (P) | −0.025 (0.16) | 0.0053 (0.77) | −0.013 (0.49) |
| PC3, r (P) | −0.035 (0.055) | −0.054 (0.0034) | −0.050 (0.0059) |
PC1 = principal components cluster 1; SICCA = Sjögren's International Collaborative Clinical Alliance; OSS = ocular staining score.
Because it is possible that the relationship between ancestry and subphenotype was confounded by the geographic recruitment site, we adjusted for site via meta‐analysis and provide site‐specific statistics for PC1 (see Supplementary Table 7, available on the Arthritis & Rheumatology web site at http://onlinelibrary.wiley.com/doi/10.1002/art.40040/abstract). The mean value for PC1 was higher or equal throughout in the subphenotype‐negative versus the subphenotype‐positive cases, with the exception that values were slightly lower for the India site (SSA/SSB) or the Denmark and JHU sites (OSS). We observed a very strong association between SSA/SSB status and PC1, both adjusted for strata (meta‐analysis P = 4 × 10⁻¹⁵, heterogeneity Q = 0.38) and within the sites having the most variance in PC1 (i.e., higher power to detect associations): for UCSF, P = 8 × 10⁻⁷; for Argentina, P = 1 × 10⁻⁵; for UK, P = 0.00065; and for JHU, P = 0.0040. For the focus score and OSS, the strata‐adjusted P values were P = 4 × 10⁻⁵ and P = 0.071, respectively, and the most strongly associated strata is Argentina for both (P = 5 × 10⁻⁶ and P = 0.0061, respectively). We concluded that the degree of European ancestry is likely to be protective for these subphenotypes (see Discussion).
Finally, to understand whether this difference was driving the apparent European and Asian heterogeneity, we re‐analyzed our data using only cases positive for all 3 subphenotypes. As shown in Figure 3, we plotted the 95% CIs for associations in the European and Asian cases, for all SS cases, and for only those meeting all 3 subphenotype criteria. In most cases, the 95% CIs for associations in the 2 European groups and the 2 Asian groups were more similar to each other than to the 95% CIs for associations in the 2 groups meeting 3 criteria, indicating that subphenotypes are not driving differences in association. A notable exception was HLA–DPB1, for which the 95% CIs in Europeans became more similar to those in Asians when the analyses were restricted to cases positive for 3 criteria; HLA–DPB1 was associated with positive SSA/SSB and focus score status in both Europeans (for SSA/SSB, OR 1.69 [P = 1.3 × 10⁻⁸]; for focus score, OR 1.36 [P = 0.00071]) and Asians (for SSA/SSB, OR 1.64 [P = 0.00032]; for focus score, OR 1.47 [P = 0.0049]). It was common in our study for effect sizes to become stronger when the analyses were restricted to cases positive for all 3 criteria; this was particularly true for HLA–DQB1 and HLA–DQA1 in Europeans. HLA–DQA1 and HLA–DQB1 alleles were very strongly associated with SSA/SSB and focus score status in the European participants (for SSA/SSB, OR 4.42 [P = 1.2 × 10⁻³⁴] and OR 3.20 [P = 1.0 × 10⁻³²], respectively; for focus score, OR 2.98 [P = 1.6 × 10⁻²¹] and OR 2.52 [P = 3.7 × 10⁻²⁴], respectively) but not in the Asian participants.
Figure 3.
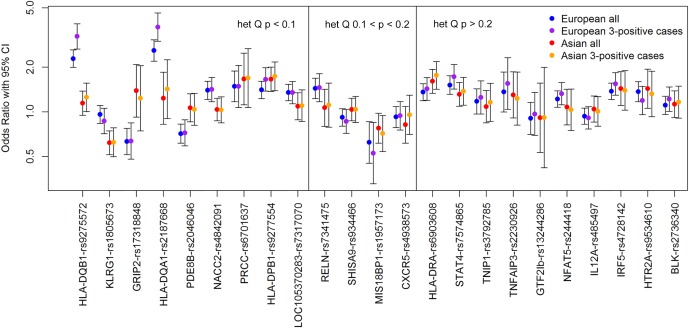
Associations in Europeans versus associations in Asians. Cases designated 3‐positive are positive for the SSA/SSB, focus score, and ocular staining score criteria. The single‐nucleotide polymorphisms are ordered according to decreasing heterogeneity (het) based on higher Q values. 95% CI = 95% confidence interval.
DISCUSSION
The current study is the first international multiethnic GWAS of SS and to our knowledge is the only international cohort with standardized deep phenotyping. Thus, it is particularly well‐suited to assess relationships between ancestry and genetic etiology and how these may differ depending on the clinical subtypes of SS, particularly for the 2 largest ethnic groups, Europeans and Asians.
The results of our GWAS implicate several novel suggestive regions of association (having at least 2 SNPs with a P value of less than 1 × 10⁻⁵). Two of these, SH2D2A and KLRG1, have been associated with other autoimmune diseases. It has been suggested 24 that a P value more liberal than standard genome‐wide significance (P < 5 × 10⁻⁸) is appropriate in this case, because genes are often associated with multiple autoimmune diseases and involve overlapping clinical subphenotypes. SH2D2A has been associated with juvenile rheumatoid arthritis 25, multiple sclerosis 26, and inflammatory neuropathies 27, 28. SH2D2A encodes a T cell–specific adapter protein (TSAd) expressed in activated T cells, natural killer cells, and endothelial cells and is thought to function in T cell signal transduction 29. We also found regulatory evidence for this region: it has been shown to bind to CEBPB, a regulator of immune and inflammatory responses, and our top SNPs in this region are within DNase I hypersensitivity peaks for numerous cell types. KLRG1 has been shown to be associated with SLE in a previous study 22 that examined both adult and childhood‐onset SLE in multiple ethnic groups. In that study, significant haplotypes varied by ethnicity, with the most significant haplotype being in Asian Americans, and with European Americans having no significantly associated haplotype. This corroborates our finding of KLRG1 being associated with SS only in Asians.
The strongest novel region in our 3 GWAS was observed in the European GWAS (OR 1.5, P = 6 × 10⁻⁸) in LOC105370283, a noncoding RNA on 13q31.1 that is near pseudogene PTMAP5. This region was associated (P = 5 × 10⁻⁹) with C‐reactive protein, a biomarker of inflammation, in the Framingham cohort 30 and contains a DNase I hypersensitivity site for human retinal epithelial cells. Another interesting suggestive region was NFAT5; members of the NF‐AT family of proteins are transcription factors involved in the immune response.
Striking differences between our European and Asian GWAS pertain to the significance and locations of MHC associations. The locations of MHC peaks in Europeans are consistent with those observed in a previous study 6, which also identified genes HLA–DQA1, HLA–DQB1, and HLA–DRA as being most significant. The peaks observed in the Asians in our study are similar to the 2 previously reported independent association signals 7; both studies showed an association peak at HLA–DPB1. Although the top peak reported in ref. 7 was between HLA–DRB1 and HLA–DQA1, HLA–DRB9 is within the same region of long‐range linkage disequilibrium in MHC class II. We observed high heterogeneity between European and Asian associations in our representative markers for the peak MHC regions. Similarly, high MHC heterogeneity between European and Chinese participants has recently been reported in SLE 31.
We have shown that the first worldwide ancestry PC is significantly associated with subphenotypes, especially SSA/SSB autoantibody production, even within sites and adjusting for site differences. Because this PC distinguishes between European and Asian clusters, this could be attributed to either the presence of Asian ancestry or the absence of European ancestry. However, association of PC1 with subphenotypes within Argentinians, and a much weaker association with the American Indian axis (PC3), leads us to believe that the degree of European ancestry is primarily driving the PC1 association. Further work is needed to confirm this finding, with more detailed ancestry admixture data. If European ancestry is indeed protective for all SS subphenotypes, this implies that European ancestry is protective for SS in general, as has been seen in SLE. This is consistent with a study by Maldini et al 12, which demonstrated a higher prevalence of SS and SS autoantibodies in non‐Europeans versus Europeans in the greater Paris area. More population‐based studies of SS prevalence are needed to confirm this hypothesis.
Finally, we demonstrate that the heterogeneity of association seen in many of the top regions is not explained, in most cases, by differing subphenotype distributions within different ethnic groups. Allele frequencies in these SNPs differed significantly between the European and Asian subgroups and likely reflect different underlying haplotype structures, as has been shown for KLRG1 in SLE 22. Because associated variants are likely only tagging the actual causal variants, whether disease‐causing mutations are present in some populations but not others or actually have different biologic effects in different populations, will be the subject of future research.
A limitation of the current study is the paucity of non‐European control data sets. We included 2 European control data sets derived from dbGaP (AREDS and COGEND), which were genotyped on the same platform and in the same laboratory concurrently. We identified these in advance and thus were able to do duplicate genotyping in a small subset of cases, for quality control. We obtained a control data set for our Asian cluster, IGANGWAS; however, it was genotyped on the Illumina 610 Quad platform, with only ∼300,000 SNPs common to both platforms. Thus, our Asian analysis was limited to this smaller set, and comparisons between the ancestry groups have this caveat. We performed an imputation of this data set up to the 1.4 million post–quality control SNPs of the Omni2.5M platform, and during the quality control process compared the frequencies of the imputed external versus internal controls (SICCA participants without SS) for each SNP. The resulting Q–Q plot indicated systematic bias of the imputed SNPs; therefore, we chose not to include these data in the final analysis. Related to this, the 24 SNPs that we used for heterogeneity comparisons and multivariate modeling were drawn from the 300K overlap SNP set, which sometimes resulted in weak proxies; this may have led to overestimation or underestimation of the heterogeneity of causal variants and their effects in multivariate models.
A related limitation of our study is that it may not have had sufficient power to identify novel variants; recently discovered variants in European 6 and Asian 7 cohorts have identified risk alleles with ORs as low as 1.28 and 1.44, respectively. Our all‐subjects analysis had 80% power to detect ORs of 1.31–1.50 (for MAFs of 0.1–0.45), while our European and Asian analyses had power to detect ORs of 1.49–1.75 and 1.65–2.01, respectively. We are very encouraged by the presence of suggestive genes already known to influence autoimmunity, which we consider the most promising for future follow‐up. These data are also available for use in larger collaborations that may be more appropriately suited to establishing novel associations.
Our SS case–control comparison used the ACR 2012 criteria for SS and included SS‐negative subjects who were positive for 1 criterion, with external Asian controls added to increase power. Our results for the top SNPs were very similar if the subjects positive for only 1 criterion are omitted or if the newer 2016 ACR/European League Against Rheumatism criteria 32 were used (see Supplementary Table 8, available on the Arthritis & Rheumatology web site at http://onlinelibrary.wiley.com/doi/10.1002/art.40040/abstract).
In summary, we have conducted the first multiethnic GWAS in SS and analyses of European versus Asian associations. Several suggestive association peaks warrant further follow‐up in future studies, particularly in 2 regions previously implicated in autoimmune diseases. We observed strong associations between SS subphenotypes and genetic ancestry; however, this does not explain the heterogeneity of the associations seen in the European versus Asian subpopulations. Issues of genetic etiology, ancestry, and subphenotype heterogeneity have been studied very little in SS compared with autoimmune diseases such as SLE. Our study gives new insights into these relationships and provides a basis for future work on the genetic etiology of SS.
AUTHOR CONTRIBUTIONS
All authors were involved in drafting the article or revising it critically for important intellectual content, and all authors approved the final version to be published. Dr. Criswell had full access to all of the data in the study and takes responsibility for the integrity of the data and the accuracy of the data analysis.
Study conception and design
Taylor, S. Shiboski, Daniels, Greenspan, C. Shiboski, Criswell.
Acquisition of data
Doheny, Lam, Baer, Challacombe, Lanfranchi, Schiødt, Srinivasan, Umehara, Vivino, Zhao, S. Shiboski, Daniels, Greenspan, C. Shiboski, Criswell.
Analysis and interpretation of data
Taylor, Wong, Levine, McHugh, Laurie, Lam, Criswell.
Supporting information
Supplementary Table 1. Study participants by GWAS analysis.
Supplementary Table 2. Selection of representative SNPs for regions suggestive in our study and significant in published GWAS*
Supplementary Table 3. Associations with imputed HLA alleles.
Supplementary Table 4. Allele frequencies of top 7 KLRG1 SNPs in Asian analsys (1e‐5 < p < 1e‐7) by subgroup.
Supplementary Table 5: Representative SNPs for regions suggestive in our study and significant in published GWAS.
Supplementary Table 6: Multivariate analysis of representative SNPs for regions suggestive in our study and significant in published GWAS.
Supplementary Table 7: PC1 differences between positive and negative subphenotype groups, by site and combined.
Supplementary Table 8. Association of top SNPs by outcome definition: ACR 2012 definition, ACR 2012 definition omitting subjects having 1 positive criteria, and ACR 2016 criteria.
Supplementary Figure 1. PC1 and PC2 of worldwide PCA of SICCA cohort and external controls.
Supplementary Figure 2. EPC1 and EPC2 of European PCA of SICCA cohort and external controls.
Supplementary Figure 3. EPC1 and EPC2 of European PCA of SICCA cohort and external controls.
Supplementary Figure 4. Genotyped and imputed SNP associations in A) Asian and B) European subgroups.
Supplementary Figure 5. Euro‐Asian heterogeneity of representative SNPs by minor allele frequency (MAF) difference. Solid red line = “significant” heterogeneity (Q p < 0.1); dashed red line = “moderate” heterogeneity (Q p < 0.2; all points above have I2 > 30).
ACKNOWLEDGMENTS
We are very grateful to the SICCA participants for their time and dedication to this research. We would also like to thank the IGANGWAS, COGEND, and AREDS participants and researchers for their valuable contributions. We acknowledge the contribution of data from AREDS, which were accessed through dbGaP (accession no. phs000001.v3.p1). Funding support for AREDS was provided by the National Eye Institute (N01‐EY‐ [NEI AREDS] April 21, 2010, version G Page 5 of 8 0‐2127). We also acknowledge the contribution of data from Genetic Architecture of Smoking and Smoking Cessation, accessed through dbGaP (accession no. phs000404.v1.p1). Funding support for genotyping, which was performed at the Center for Inherited Disease Research (CIDR), was provided by 1 X01 HG005274‐01. The CIDR is fully funded through a federal contract from the National Institutes of Health to Johns Hopkins University (contract no. HHSN268200782096C). Assistance with the cleaning of genotype data, as well as with general study coordination, was provided by the Gene Environment Association Studies Coordinating Center (U01HG004446). Funding support for the collection of data sets and samples was provided by the Collaborative Study of Nicotine Dependence (P01‐CA089392) and the University of Wisconsin Transdisciplinary Tobacco Use Research Center (grants P50‐DA019706 and P50‐A084724). Finally, we acknowledge the contribution of data from IGANGWAS, conducted by the IGANGWAS investigators and supported by the NIDDK. The data from IGANGWAS reported herein were derived from dbGaP (accession no. phs000431.v2.p1).
APPENDIX A. ADDITIONAL COLLABORATORS IN THE SJÖGREN'S INTERNATIONAL COLLABORATIVE CLINICAL ALLIANCE
Collaborators in the Sjögren's International Collaborative Clinical Alliance, in addition to the authors, are as follows: D. Cox, R. Jordan, D. Lee, Y. DeSouza, D. Drury, A. Do, L. Scott, J. Nespeco, J. Whiteford, M. Margaret, and K. Sack (University of California, San Francisco); I. Adler, A. C. Smith, A. M. Bisio, M. S. Gandolfo, A. M. Chirife, A. Keszler, S. Daverio, and V. Kambo (University of Buenos Aires and German Hospital, Buenos Aires, Argentina); Y. Dong, Y. Jiang, D. Xu, J. Su, D. Du, H. Wang, Z. Li, J. Xiao, Q. Wu, C. Zhang, W. Meng, and J. Zhang (Peking Union Medical College Hospital, Beijing, China); S. Johansen, S. Hamann, J. Schiødt, H. Holm, P. Ibsen, A. M. Manniche, S. P. Kreutzmann, and J. Villadsen (Rigshospitalet, Copenhagen, Denmark); S. Sugai, Y. Masaki, T. Sakai, N. Shibata, M. Honjo, N. Kurose, T. Nojima, T. Kawanami, T. Sawaki, and K. Fujimoto (Kanazawa Medical University, Ishikawa, Japan); E. Odell, P. Morgan, L. Fernandes‐Naglik, B. Varghese‐Jacob, S. Ali, and M. Adamson (King's College London, London, UK); S. Seghal, R. Mishra, V. Bunya, M. Massaro‐Giordano, S. K. Abboud, A. Pinto, Y. W. Sia, and K. Dow (University of Pennsylvania, Philadelphia); E. Akpek, S. Ingrodi, W. Henderson, C. Gourin, and A. Keyes (Johns Hopkins University, Baltimore, Maryland); M. Srinivasan, J. Mascarenhas, M. Das, A. Kumar, P. Joshi, R. Banushree, U. Kim, B. Babu, A. Ram, R. Saravanan, K. N. Kannappan, and N. Kalyani (Aravind Eye Hospital, Madurai, India).
This article was not prepared in collaboration with the Susceptibility Loci for IgA Nephropathy Study (IGANGWAS) investigators and does not necessarily reflect the opinions or views of the IGANGWAS, dbGaP, or the National Institute of Diabetes and Digestive and Kidney Diseases.
The Sjögren's International Collaborative Clinical Alliance (SICCA) cohort was supported by the NIH (National Institute for Dental and Craniofacial Research [NIDCR], National Eye Institute, and Office of Research on Women's Health grant N01‐DE‐32626). The SICCA Biorepository and Data Registry is supported by NIH grant HHSN‐26S201300057C from the NIDCR. Genotyping at the Johns Hopkins Center for Inherited Disease Research was supported by NIH grant HHSN‐268201200008I. Dr. Baer's work was supported by NIH grant R01‐DE‐12354‐15A1. Drs. Taylor and Criswell's work was supported by the Rosalind Russell/Ephraim P. Engleman Rheumatology Center of the University of California.
REFERENCES
- 1. Ice JA, Li H, Adrianto I, Lin PC, Kelly JA, Montgomery CG, et al. Genetics of Sjögren's syndrome in the genome‐wide association era. J Autoimmun 2012;39:57–63. [DOI] [PMC free article] [PubMed] [Google Scholar]
- 2. Shiboski SC, Shiboski CH, Criswell L, Baer A, Challacombe S, Lanfranchi H, et al. American College of Rheumatology classification criteria for Sjögren's syndrome: a data‐driven, expert consensus approach in the Sjögren's International Collaborative Clinical Alliance cohort. Arthritis Care Res (Hoboken) 2012;64:475–87. [DOI] [PMC free article] [PubMed] [Google Scholar]
- 3. Cobb BL, Lessard CJ, Harley JB, Moser KL. Genes and Sjögren's syndrome. Rheum Dis Clin North Am 2008;34:847–68, vii. [DOI] [PMC free article] [PubMed] [Google Scholar]
- 4. Kuo CF, Grainge MJ, Valdes AM, See LC, Luo SF, Yu KH, et al. Familial risk of Sjögren's syndrome and co‐aggregation of autoimmune diseases in affected families: a nationwide population study. Arthritis Rheumatol 2015;67:1904–12. [DOI] [PMC free article] [PubMed] [Google Scholar]
- 5. Cruz‐Tapias P, Rojas‐Villarraga A, Maier‐Moore S, Anaya JM. HLA and Sjögren's syndrome susceptibility: a meta‐analysis of worldwide studies. Autoimmun Rev 2012;11:281–7. [DOI] [PubMed] [Google Scholar]
- 6. Lessard CJ, Li H, Adrianto I, Ice JA, Rasmussen A, Grundahl KM, et al. Variants at multiple loci implicated in both innate and adaptive immune responses are associated with Sjögren's syndrome. Nat Genet 2013;45:1284–92. [DOI] [PMC free article] [PubMed] [Google Scholar]
- 7. Li Y, Zhang K, Chen H, Sun F, Xu J, Wu Z, et al. A genome‐wide association study in Han Chinese identifies a susceptibility locus for primary Sjögren's syndrome at 7q11.23. Nat Genet 2013;45:1361–5. [DOI] [PubMed] [Google Scholar]
- 8. Daniels TE, Criswell LA, Shiboski C, Shiboski S, Lanfranchi H, Dong Y, et al. An early view of the International Sjögren's Syndrome Registry. Arthritis Rheum 2009;61:711–4. [DOI] [PMC free article] [PubMed] [Google Scholar]
- 9. Chung SA, Tian C, Taylor KE, Lee AT, Ortmann WA, Hom G, et al. European population substructure is associated with mucocutaneous manifestations and autoantibody production in systemic lupus erythematosus. Arthritis Rheum 2009;60:2448–56. [DOI] [PMC free article] [PubMed] [Google Scholar]
- 10. Richman IB, Chung SA, Taylor KE, Kosoy R, Tian C, Ortmann WA, et al. European population substructure correlates with systemic lupus erythematosus endophenotypes in North Americans of European descent. Genes Immun 2010;11:515–21. [DOI] [PMC free article] [PubMed] [Google Scholar]
- 11. Chung SA, Taylor KE, Graham RR, Hom G, Ortmann WA, Lee AT, et al. Refining genome‐wide association results for SLE according to anti‐dsDNA autoantibody production [abstract]. Arthritis Rheum 2008;58 Suppl:S344. [Google Scholar]
- 12. Maldini C, Seror R, Fain O, Dhote R, Amoura Z, de Bandt M, et al. Epidemiology of primary Sjögren's syndrome in a French multiracial/multiethnic area. Arthritis Care Res (Hoboken) 2014;66:454–63. [DOI] [PubMed] [Google Scholar]
- 13. Daniels TE, Cox D, Shiboski CH, Schiodt M, Wu A, Lanfranchi H, et al. Associations between salivary gland histopathologic diagnoses and phenotypic features of Sjögren's syndrome among 1,726 registry participants. Arthritis Rheum 2011;63:2021–30. [DOI] [PMC free article] [PubMed] [Google Scholar]
- 14. Whitcher JP, Shiboski CH, Shiboski SC, Heidenreich AM, Kitagawa K, Zhang S, et al. A simplified quantitative method for assessing keratoconjunctivitis sicca from the Sjögren's Syndrome International Registry. Am J Ophthalmol 2010;149:405–15. [DOI] [PMC free article] [PubMed] [Google Scholar]
- 15. Laurie CC, Doheny KF, Mirel DB, Pugh EW, Bierut LJ, Bhangale T, et al. Quality control and quality assurance in genotypic data for genome‐wide association studies. Genet Epidemiol 2010;34:591–602. [DOI] [PMC free article] [PubMed] [Google Scholar]
- 16. Price AL, Patterson NJ, Plenge RM, Weinblatt ME, Shadick NA, Reich D. Principal components analysis corrects for stratification in genome‐wide association studies. Nat Genet 2006;38:904–9. [DOI] [PubMed] [Google Scholar]
- 17. Boyle AP, Hong EL, Hariharan M, Cheng Y, Schaub MA, Kasowski M, et al. Annotation of functional variation in personal genomes using RegulomeDB. Genome Res 2012;22:1790–7. [DOI] [PMC free article] [PubMed] [Google Scholar]
- 18. Wang K, Li M, Hakonarson H. ANNOVAR: functional annotation of genetic variants from high‐throughput sequencing data. Nucleic Acids Res 2010;38:e164. [DOI] [PMC free article] [PubMed] [Google Scholar]
- 19. Howie BN, Donnelly P, Marchini J. A flexible and accurate genotype imputation method for the next generation of genome‐wide association studies. PLoS Genet 2009;5:e1000529. [DOI] [PMC free article] [PubMed] [Google Scholar]
- 20. Jia X, Han B, Onengut‐Gumuscu S, Chen WM, Concannon PJ, Rich SS, et al. Imputing amino acid polymorphisms in human leukocyte antigens. PLoS One 2013;8:e64683. [DOI] [PMC free article] [PubMed] [Google Scholar]
- 21. Pillai NE, Okada Y, Saw WY, Ong RT, Wang X, Tantoso E, et al. Predicting HLA alleles from high‐resolution SNP data in three Southeast Asian populations. Hum Mol Genet 2014;23:4443–51. [DOI] [PubMed] [Google Scholar]
- 22. Armstrong DL, Reiff A, Myones BL, Quismorio FP Jr, Kleiin‐Gitelman M, McCurdy D, et al. Identification of new SLE‐associated genes with a two‐step Bayesian study design. Genes Immun 2009;10:446–56. [DOI] [PMC free article] [PubMed] [Google Scholar]
- 23. Nocturne G, Boudaoud S, Miceli‐Richard C, Viengchareun S, Lazure T, Nititham J, et al. Germline and somatic genetic variations of TNFAIP3 in lymphoma complicating primary Sjögren's syndrome. Blood 2013;122:4068–76. [DOI] [PMC free article] [PubMed] [Google Scholar]
- 24. Zhernakova A, Stahl EA, Trynka G, Raychaudhuri S, Festen EA, Franke L, et al. Meta‐analysis of genome‐wide association studies in celiac disease and rheumatoid arthritis identifies fourteen non‐HLA shared loci. PLoS Genet 2011;7:e1002004. [DOI] [PMC free article] [PubMed] [Google Scholar]
- 25. Smerdel A, Dai KZ, Lorentzen AR, Flato B, Maslinski S, Thorsby E, et al. Genetic association between juvenile rheumatoid arthritis and polymorphism in the SH2D2A gene. Genes Immun 2004;5:310–2. [DOI] [PubMed] [Google Scholar]
- 26. Lorentzen AR, Smestad C, Lie BA, Oturai AB, Akesson E, Saarela J, et al. The SH2D2A gene and susceptibility to multiple sclerosis. J Neuroimmunol 2008;197:152–8. [DOI] [PubMed] [Google Scholar]
- 27. Notturno F, Pace M, de Angelis MV, Caporale CM, Giovannini A, Uncini A. Susceptibility to chronic inflammatory demyelinating polyradiculoneuropathy is associated to polymorphic GA repeat in the SH2D2A gene. J Neuroimmunol 2008;197:124–7. [DOI] [PubMed] [Google Scholar]
- 28. Uncini A, Notturno F, Pace M, Caporale CM. Polymorphism of CD1 and SH2D2A genes in inflammatory neuropathies. J Peripher Nerv Syst 2011;16 Suppl 1:48–51. [DOI] [PubMed] [Google Scholar]
- 29. Pandya AD, Leergaard TB, Dissen E, Haraldsen G, Spurkland A. Expression of the T cell‐specific adapter protein in human tissues. Scand J Immunol 2014;80:169–79. [DOI] [PubMed] [Google Scholar]
- 30. Benjamin EJ, Dupuis J, Larson MG, Lunetta KL, Booth SL, Govindaraju DR, et al. Genome‐wide association with select biomarker traits in the Framingham Heart study. BMC Med Genet 2007;8 Suppl 1:S11. [DOI] [PMC free article] [PubMed] [Google Scholar]
- 31. Morris DL, Sheng Y, Zhang Y, Wang YF, Zhu Z, Tombleson P, et al. Genome‐wide association meta‐analysis in Chinese and European individuals identifies ten new loci associated with systemic lupus erythematosus. Nat Genet 2016;48:940–6. [DOI] [PMC free article] [PubMed] [Google Scholar]
- 32. Shiboski CH, Shiboski SC, Seror R, Criswell LA, Labetoulle M, Lietman TM, et al. 2016 American College of Rheumatology/European League Against Rheumatism classification criteria for primary Sjögren's syndrome: a consensus and data‐driven methodology involving three international patient cohorts. Arthritis Rheumatol 2017;69:35–45. [DOI] [PMC free article] [PubMed] [Google Scholar]
Associated Data
This section collects any data citations, data availability statements, or supplementary materials included in this article.
Supplementary Materials
Supplementary Table 1. Study participants by GWAS analysis.
Supplementary Table 2. Selection of representative SNPs for regions suggestive in our study and significant in published GWAS*
Supplementary Table 3. Associations with imputed HLA alleles.
Supplementary Table 4. Allele frequencies of top 7 KLRG1 SNPs in Asian analsys (1e‐5 < p < 1e‐7) by subgroup.
Supplementary Table 5: Representative SNPs for regions suggestive in our study and significant in published GWAS.
Supplementary Table 6: Multivariate analysis of representative SNPs for regions suggestive in our study and significant in published GWAS.
Supplementary Table 7: PC1 differences between positive and negative subphenotype groups, by site and combined.
Supplementary Table 8. Association of top SNPs by outcome definition: ACR 2012 definition, ACR 2012 definition omitting subjects having 1 positive criteria, and ACR 2016 criteria.
Supplementary Figure 1. PC1 and PC2 of worldwide PCA of SICCA cohort and external controls.
Supplementary Figure 2. EPC1 and EPC2 of European PCA of SICCA cohort and external controls.
Supplementary Figure 3. EPC1 and EPC2 of European PCA of SICCA cohort and external controls.
Supplementary Figure 4. Genotyped and imputed SNP associations in A) Asian and B) European subgroups.
Supplementary Figure 5. Euro‐Asian heterogeneity of representative SNPs by minor allele frequency (MAF) difference. Solid red line = “significant” heterogeneity (Q p < 0.1); dashed red line = “moderate” heterogeneity (Q p < 0.2; all points above have I2 > 30).