

Abstract
Background
Outpatient care facilities provide a variety of basic healthcare services to individuals who do not require hospitalisation or institutionalisation, and are usually the patient's first contact. The provision of outpatient care contributes to immediate and large gains in health status, and a large portion of total health expenditure goes to outpatient healthcare services. Payment method is one of the most important incentive methods applied by purchasers to guide the performance of outpatient care providers.
Objectives
To assess the impact of different payment methods on the performance of outpatient care facilities and to analyse the differences in impact of payment methods in different settings.
Search methods
We searched the Cochrane Central Register of Controlled Trials (CENTRAL), 2016, Issue 3, part of the Cochrane Library (searched 8 March 2016); MEDLINE, OvidSP (searched 8 March 2016); Embase, OvidSP (searched 24 April 2014); PubMed (NCBI) (searched 8 March 2016); Dissertations and Theses Database, ProQuest (searched 8 March 2016); Conference Proceedings Citation Index (ISI Web of Science) (searched 8 March 2016); IDEAS (searched 8 March 2016); EconLit, ProQuest (searched 8 March 2016); POPLINE, K4Health (searched 8 March 2016); China National Knowledge Infrastructure (searched 8 March 2016); Chinese Medicine Premier (searched 8 March 2016); OpenGrey (searched 8 March 2016); ClinicalTrials.gov, US National Institutes of Health (NIH) (searched 8 March 2016); World Health Organization (WHO) International Clinical Trials Registry Platform (ICTRP) (searched 8 March 2016); and the website of the World Bank (searched 8 March 2016).
In addition, we searched the reference lists of included studies and carried out a citation search for the included studies via ISI Web of Science to find other potentially relevant studies. We also contacted authors of the main included studies regarding any further published or unpublished work.
Selection criteria
Randomised trials, non‐randomised trials, controlled before‐after studies, interrupted time series, and repeated measures studies that compared different payment methods for outpatient health facilities. We defined outpatient care facilities in this review as facilities that provide health services to individuals who do not require hospitalisation or institutionalisation. We only included methods used to transfer funds from the purchaser of healthcare services to health facilities (including groups of individual professionals). These include global budgets, line‐item budgets, capitation, fee‐for‐service (fixed and unconstrained), pay for performance, and mixed payment. The primary outcomes were service provision outcomes, patient outcomes, healthcare provider outcomes, costs for providers, and any adverse effects.
Data collection and analysis
At least two review authors independently extracted data and assessed the risk of bias. We conducted a structured synthesis. We first categorised the comparisons and outcomes and then described the effects of different types of payment methods on different categories of outcomes. We used a fixed‐effect model for meta‐analysis within a study if a study included more than one indicator in the same category of outcomes. We used a random‐effects model for meta‐analysis across studies. If the data for meta‐analysis were not available in some studies, we calculated the median and interquartile range. We reported the risk ratio (RR) for dichotomous outcomes and the relative change for continuous outcomes.
Main results
We included 21 studies from Afghanistan, Burundi, China, Democratic Republic of Congo, Rwanda, Tanzania, the United Kingdom, and the United States of health facilities providing primary health care and mental health care. There were three kinds of payment comparisons.
1) Pay for performance (P4P) combined with some existing payment method (capitation or different kinds of input‐based payment) compared to the existing payment method
We included 18 studies in this comparison, however we did not include five studies in the effects analysis due to high risk of bias. From the 13 studies, we found that the extra P4P incentives probably slightly improved the health professionals' use of some tests and treatments (adjusted RR median = 1.095, range 1.01 to 1.17; moderate‐certainty evidence), and probably led to little or no difference in adherence to quality assurance criteria (adjusted percentage change median = ‐1.345%, range ‐8.49% to 5.8%; moderate‐certainty evidence). We also found that P4P incentives may have led to little or no difference in patients' utilisation of health services (adjusted RR median = 1.01, range 0.96 to 1.15; low‐certainty evidence) and may have led to little or no difference in the control of blood pressure or cholesterol (adjusted RR = 1.01, range 0.98 to 1.04; low‐certainty evidence).
2) Capitation combined with P4P compared to fee‐for‐service (FFS)
One study found that compared with FFS, a capitated budget combined with payment based on providers' performance on antibiotic prescriptions and patient satisfaction probably slightly reduced antibiotic prescriptions in primary health facilities (adjusted RR 0.84, 95% confidence interval 0.74 to 0.96; moderate‐certainty evidence).
3) Capitation compared to FFS
Two studies compared capitation to FFS in mental health centres in the United States. Based on these studies, the effects of capitation compared to FFS on the utilisation and costs of services were uncertain (very low‐certainty evidence).
Authors' conclusions
Our review found that if policymakers intend to apply P4P incentives to pay health facilities providing outpatient services, this intervention will probably lead to a slight improvement in health professionals' use of tests or treatments, particularly for chronic diseases. However, it may lead to little or no improvement in patients' utilisation of health services or health outcomes. When considering using P4P to improve the performance of health facilities, policymakers should carefully consider each component of their P4P design, including the choice of performance measures, the performance target, payment frequency, if there will be additional funding, whether the payment level is sufficient to change the behaviours of health providers, and whether the payment to facilities will be allocated to individual professionals. Unfortunately, the studies included in this review did not help to inform those considerations.
Well‐designed comparisons of different payment methods for outpatient health facilities in low‐ and middle‐income countries and studies directly comparing different designs (e.g. different payment levels) of the same payment method (e.g. P4P or FFS) are needed.
Plain language summary
Payment methods for outpatient care facilities
Review aim
The aim of this Cochrane review was to assess the effect of different payment systems for outpatient care facilities. We collected and analysed all relevant studies to answer this question and included 21 studies.
Key messages
Pay‐for‐performance systems probably have only small benefits or make little or no difference to healthcare provider behaviour or patients' use of healthcare services. We are uncertain whether they cause harm. We are uncertain about the benefits and harms of other payments systems because the research is lacking or of very low certainty.
What was studied in the review?
Many healthcare services are offered to patients through outpatient facilities rather than to inpatients in hospitals. Outpatient facilities are also known as ambulatory care facilities, and include primary healthcare centres, outpatient clinics, urgent care centres, family planning centres, mental health centres, and dental clinics.
Different systems to reimburse outpatient (ambulatory) care facilities for their services are available to governments and health insurers. These systems include:
• budget systems, where the facility is given a fixed amount of money in advance to cover expenses for a fixed period;
• capitation payment systems, where the facility is paid a fixed amount of money in advance to provide specific services to each enrolled patient for a fixed period;
• fee‐for‐service systems, where payment is based on the specific services that the healthcare facility provides;
• pay‐for‐performance systems, where payment is partly based on the performance of the facility's healthcare providers.
Different payment systems can have different effects on how healthcare facilities deliver care. These changes can be intentional or unintentional and can lead to both benefits and harms. At best, a payment system can encourage healthcare providers to offer the right healthcare services to the right patients in the best and most cost‐efficient way. However, payment systems can also lead providers to offer poor‐quality, expensive, and unnecessary care, which can ultimately have a negative impact on patients' health.
This Cochrane review assessed the effect of different payment systems for outpatient care facilities. Other Cochrane reviews have assessed the effect of different payment systems for individual healthcare professionals and for inpatient facilities.
Main results
We found 21 relevant studies from the United Kingdom, the United States, Rwanda, Burundi, Tanzania, Afghanistan, China, and Democratic Republic of Congo. Most of the studies were from primary healthcare facilities. The studies assessed capitation systems, fee‐for‐service systems, and different types of pay‐for‐performance systems.
Pay‐for‐performance systems:
• probably slightly improve providers' use of some tests and treatments;
• probably lead to little or no difference in providers' compliance with quality assurance criteria;
• may lead to little or no difference in patients' use of health services;
• may lead to little or no difference in patients' health status.
Capitation combined with a pay‐for‐performance system targeted at reducing antibiotic use probably slightly reduces antibiotic prescriptions when compared to a fee‐for‐service system.
Two studies compared capitation with fee‐for‐service systems, however, we assessed the certainty of the evidence as very low.
We did not find any relevant studies that assessed budget systems.
How up‐to‐date is this review?
We searched for studies that had been published up to March 2016.
Summary of findings
Background
Description of the condition
Outpatient care facilities, also known as ambulatory health facilities, are organisations that deliver healthcare services to individuals who do not require hospitalisation or institutionalisation. They provide a variety of types of health care including preventive health care, treatment of acute illness, dental care, and some types of maternal and family‐planning care. Most of these services are first‐contact and basic healthcare services. The provision of outpatient care contributes to immediate and large gains in health status, and a large portion of total health expenditure goes to outpatient healthcare services, especially in low‐ and middle‐income countries (Berman 2000).
Description of the intervention
Based on Barnum's framework of "flow of funds under generic reforms" (Figure 1), the flow of funds would typically be from the Ministry of Health to government providers, and from social or private insurers, if they exist, to providers. Different payment methods can be used for different outpatient care facilities (Barnum 1995).
1.
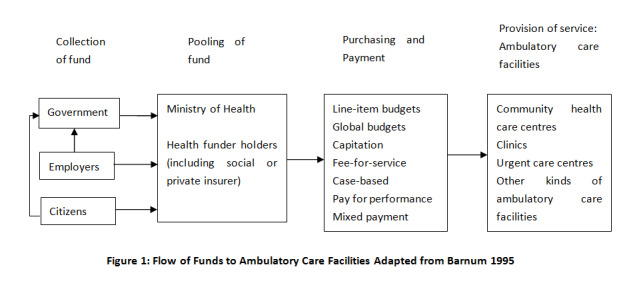
The most commonly used payment systems to remunerate outpatient care facilities are budgets, capitation, fee‐for‐service, pay for performance, and mixed systems (Barnum 1995; Langenbrunner 2009; WHO 2000).
Line‐item budgets
The allocation of a fixed amount of funds to a healthcare provider to cover specific line items (or input costs), such as personnel, utilities, medicines, and supplies, for a certain period of time (Langenbrunner 2009). Line‐item budgets are widely used in low‐ and middle‐income countries and are often an important part of a centrally directed healthcare system (Barnum 1995).
Global budgets
A payment fixed in advance to cover aggregate expenditures for a given period. This method is used by government or insurers to pay hospitals (Hirdes 1996; Wolfe 1993), as well as some types of outpatient care facilities. For example, in 1996 the National Health Insurance program in Taiwan implemented a global budget payment system for clinics with the aim of reducing pharmaceutical expenditures (Lee 2006). Global budgets can be an important element of health sector reforms such as decentralisation of the healthcare system.
Capitation
The provider is paid a predetermined fixed rate in advance to provide a defined set of services for each individual enrolled with the provider for a fixed period. Capitation payment may be a flat fee for each of the enrollees or it can be a risk‐adjusted fee, based on the relative risk of the registered population. This payment method has been widely used in low‐, middle‐, and high‐income countries. For example, in Thailand, capitation was used to motivate hospitals to provide comprehensive health services (ILO/UNDP 1993); it was also used to pay primary care providers in Hungary (Deeble 1992).
Fee‐for‐service
Providers are reimbursed based on specific items provided. Fee‐for‐service, with fixed‐fee schedules or without (unconstrained), is commonly used in such countries as Canada, China, Japan, and the Republic of Korea; among private insurers in the Gulf states, such as Saudi Arabia; in indemnity plans in the United States (a type of health insurance that reimburses the patient or provider as expenses are incurred) (Pati 2005); and in parts of Western Europe, such as Austria and Germany.
Pay for performance
The payment is directly linked to the performance of healthcare providers. Pay for performance can be used to pay individuals, groups of people, or organisations by government or insurers. Pay‐for‐performance schemes vary widely in terms of the types of performance that are targeted, how performance is measured, when payments for performance are paid, the size of payments for performance, and the proportion of total reimbursements that is paid for performance (Witter 2012).
Mixed systems
A mixed system may be adopted simply because it is administratively more practical or to counter the adverse incentives of specific payment methods while retaining their desirable features. Most provider payment systems are mixed.
Categories of payment methods
Provider payment methods can be categorised based on three characteristics (Table 4) (Langenbrunner 2009):
1. Outpatient care facilities payment methods and characteristics.
| Payment methods | Payment rate determined | Payment made | Payment related to | |||
| Prospectively | Retrospectively | Prospectively | Retrospectively | Inputs | Outputs | |
| Line‐item budgets | √ | √ | √ | |||
| Global budgets | √ | √ | √ | √ | ||
| Capitation | √ | √ | √ | |||
| Fee‐for‐service | ||||||
| ‐Unconstrained | √ | √ | √ | |||
| ‐Fixed | √ | √ | √ | |||
| Pay for performance | √ | √ | √ | |||
whether payment rates to providers for a single service or a package of services are set prospectively (in advance) or retrospectively (after services are provided). For prospectively set payment methods, services are bundled into a package reimbursed at a fixed payment rate, and some financial risk is shifted from the purchaser to the provider. Alternatively, payment rates are set retrospectively when the provider is simply reimbursed the amount that is billed, the reimbursement rates reflect the cost of providing the services, and the purchaser bears all the financial risk;
whether payment to the provider is made prospectively (before services are provided) or retrospectively (after services are provided). With prospective rate setting, the actual payment may be made either prospectively or retrospectively;
whether the payment that is made to providers is based on inputs used to provide services (i.e. all costs of providing services are financed) or on outputs produced, such as cases treated, bed‐days completed, or individual services provided (i.e. each test, procedure, or consultation).
How the intervention might work
Different types of payment methods have different incentives. Retrospective payment systems provide incentives to providers to deliver more services, and thereby might increase utilisation of services. There is little risk for providers, provided the payments are appropriate, and there are no incentives for patient selection. However, retrospective payment systems can also provide incentives to provide unnecessary and inappropriate care. Retrospective payments can also provide incentives to deliver desired services, thereby improving quality. In contrast, prospective payment methods can provide incentives to deliver rational levels of services, to improve efficiency, and to contain costs (Langenbrunner 2009).
An input‐based payment method creates incentives to increase the number of inputs. An output‐based payment method creates stronger incentives to increase the number or quality of services delivered. The lower the levels of aggregation at which services are defined as outputs, the greater the incentives are to increase the number of services delivered.
Based on these theoretical incentives, different payment methods might be expected to have different effects on the quality and quantity of services provided per patient, the efficiency (cost per unit), and selection of patients (risk selection) (Table 5).
2. Incentives in pure reimbursement systems of outpatient care facilities.
| Reimbursement type | Performance | ||||
| Services/Case | Quantity | Quality | Cost/Unit | Risk selection | |
| Line‐item budgets | ‐ | ‐‐ | ‐ | + | 0 |
| Global budgets | ‐‐ | ‐ | ‐ | ‐‐ | 0 |
| Capitation | ‐‐ | ‐‐ | ‐ | ‐‐ | ++ |
| Fee‐for‐service | |||||
| ‐Unconstrained | ++ | + | ‐‐ | ‐ | 0 |
| ‐Fixed | ++ | + | ‐‐ | ‐‐ | + |
| Case‐based | ‐‐ | ++ | ++ | ‐‐ | + |
| Pay for performance | + | ++ | ++ | ‐‐ | + |
Line‐item budgets are input‐based, whereas global budgets can be input‐ or output‐based payments. Both are prospective, which means that providers have incentives to under‐provide services (negative effects) and increase inputs, and no incentives to improve the efficiency of the input mix. The main incentive of global budgets is to encourage providers to control healthcare costs, rather than to improve performance.
Fee‐for‐service with a fixed‐fee schedule and bundling of services is output‐based, which provides incentives to increase the number of services delivered, including unnecessary ones (negative effects), and to reduce the amount of input per service. Fee‐for‐service with no fixed‐fee schedule (unconstrained) is input‐based and retrospective. The provider has incentives to increase the number of services and increase inputs.
Capitation is output‐based and prospective. The provider has incentives to increase output or attract more patients to enrol, which increases the total payment received. Providers might attract enrollees through improved quality of care, additional services that are not typically covered, or other measures that patients may perceive as increasing the benefit of enrolling with that provider rather than with another provider. It also provides incentives to improve efficiency of the input mix and decrease inputs, focus on less expensive health promotion and prevention, and attempt to select healthier enrollees (negative effects).
Pay‐for‐performance is output‐based and retrospectively paid for the providers. Providers are informed as to how much they could be paid with different levels of performance on service provision. It motivates the providers behaviour to the desired performance target, which could be the improvement in quantity or quality of services; however, it can also result in providers selecting the patients who are easier to achieve the performance target (e.g. blood pressure control) and ignoring the services that are not included in the performance target (negative effects).
Administrative costs are incurred whatever payment methods are used. Administrative costs include the costs of making payments and monitoring inputs, outputs (quantity and quality of services provided). More complex payment methods, such as pay‐for‐performance schemes, entail more administrative costs.
Why it is important to do this review
Several systematic reviews have evaluated the effects of payment to individual health providers (Flodgren 2011; Gosden 2000; Scott 2011). However, little is known about the effects of the different types of payment system on performance of healthcare facilities.
This review focused on payment for healthcare facilities providing outpatient services. Together with the Cochrane reviews on payment methods for individual health professionals and payment methods for hospitals (Jia 2015; Mathes 2014), this review will contribute to the evidence on which types of payment methods are effective in improving provision of outpatient health services, from which policy advice can be disseminated to policymakers in different countries and managers of health insurance.
Objectives
To assess the impact of different payment methods on the performance of outpatient care facilities and to analyse the differences in impact of payment methods in different settings.
Methods
Criteria for considering studies for this review
Types of studies
Randomised trials, including cluster‐randomised trials
Non‐randomised trials
Interrupted time series and repeated measures studies with:
a clearly defined point in time when the intervention occurred;
at least three data points before and three data points after the intervention.
Controlled before‐after studies with:
contemporaneous data collection;
a minimum of two intervention and two control sites.
Types of participants
We evaluated the payment targeted to health facilities, so outpatient care facilities are the participants included in this review. Outpatient care facilities, also known as ambulatory health facilities, are those facilities that provide health services to individuals who do not require hospitalisation or institutionalisation, including community healthcare centres, clinics (including outpatient clinics), urgent care centres, family planning centres, mental health centres, and dental clinics. We also included primary care practices (groups of individual professionals).
As some studies might investigate the individual patients to measure the performance of health facilities as the impact of payment methods, the participants in this review also included patients receiving services from outpatient care facilities.
Types of interventions
The payment methods varied with respect to the level at which the incentives were targeted. We only included the provider payment method that was used to transfer funds from the purchaser of healthcare services to the level of health facilities (including groups of individual professionals). In this review, payment methods included:
global budgets;
line‐item budgets;
capitation;
fee‐for‐service (fixed and unconstrained) (FFS);
pay for performance (P4P);
mixed payment.
We included comparisons of:
any two types or combinations of the above payment methods for outpatient care facilities; or
changes in the design of a payment method, such as increasing or decreasing the level of funding, changing the payment frequency, or changing performance target used in P4P.
We excluded methods of paying individuals who work in outpatient care facilities.
Types of outcome measures
Primary outcomes
To be included, the study must have reported at least one of the following objective measures of outpatient care facilities' performance in health services provision.
-
Service provision outcomes (controlled by providers' behaviour):
Quantity of health services provided (e.g. proportion of patients getting aspirin prescription, rate of referral of smokers to quit line);
Quality of health services provided (e.g. adherence to guidelines, quality score for certain health services).
-
Patient outcomes (not only controlled by providers' behaviour):
Patients' utilisation of health services (e.g. proportion of women having any prenatal care, proportion of children being fully immunised);
Patients' intermediate and final health outcomes (e.g. blood pressure of patients with hypertension, health‐related quality of life, mortality).
Healthcare provider outcomes (e.g. workload, work morale)
Costs for providers (e.g. cost per service, administration costs, total cost for purchasers)
Adverse effects (e.g. unnecessary services, reduced access to services (especially for disadvantaged populations), and patient selection)
Secondary outcomes
Satisfaction of patients, providers, or other stakeholders.
Search methods for identification of studies
Electronic searches
We searched the following databases.
Cochrane Central Register of Controlled Trials (CENTRAL), 2016, Issue 3, part of the Cochrane Library (searched 8 March 2016)
MEDLINE, 1946 to present, In‐Process and Other Non‐Indexed Citations, OvidSP (searched 8 March 2016)
Embase, 1947 to present, OvidSP (searched 24 April 2014)
PubMed, 1966 to present (searched 8 March 2016)
Dissertations and Theses Database, 1861 to present, ProQuest (searched 8 March 2016)
Conference Proceedings Citation Index, 1990 to present (ISI Web of Science) (searched 8 March 2016)
IDEAS Research Papers in Economics, 1927 to present (searched 8 March 2016)
EconLit, 1969 to present (searched 8 March 2016)
ProQuest (searched 8 March 2016)
POPLINE (Population Information Online), 1970 to present, K4Health (searched 8 March 2016)
China National Knowledge Infrastructure (CHKD‐CNKI), 1915 to present, (searched 8 March 2016)
Chinese Medicine Premier (Wanfang Data), 1988 to present, (searched 8 March 2016)
Website of the World Health Organization(www.who.int/en/) (searched 8 March 2016)
Website of the World Bank (www.worldbank.org/) (searched 8 March 2016)
The Cochrane Effective Practice and Organisation of Care (EPOC) Group Information Specialist developed the MEDLINE strategy in consultation with the authors.
Search strategies are comprised of keywords and controlled vocabulary terms. We applied no language limits. We searched all databases from database start date to date of search.
Searching other resources
Grey literature
We conducted a grey literature search to identify studies not indexed in the databases listed above. We searched one grey literature database: OpenGrey (System for Information on Grey Literature in Europe) (www.opengrey.eu/) (searched 8 March 2016).
Trial registries
ClinicalTrials.gov, US National Institutes of Health (clinicaltrials.gov/) (searched 8 March 2016)
World Health Organization International Clinical Trials Registry Platform (WHO ICTRP) (www.who.int/ictrp/en/) (searched 8 March 2016)
In addition, we:
searched reference lists of all relevant papers identified;
searched Science Citation Index and Social Sciences Citation Index, ISI Web of Science, for papers citing any studies included in the review;
searched PubMed for related citations to any studies included in the review;
contacted authors of relevant papers regarding any further published or unpublished work.
All search strategies are provided in Appendix 1.
Data collection and analysis
Selection of studies
Two review authors scanned titles and abstracts of all articles obtained from the search and retrieved the full text of articles deemed relevant. Two review authors independently assessed full texts of studies for inclusion. Any disagreements on inclusion were resolved by discussion with a third review author or EPOC editor.
The screening process and results are reported in a study flow chart (Figure 2). We described all included studies in the Characteristics of included studies tables, even if the included studies did not report usable results for re‐analysis or synthesis. We listed studies that appeared to meet the inclusion criteria, but were eventually excluded, in the Characteristics of excluded studies table.
2.
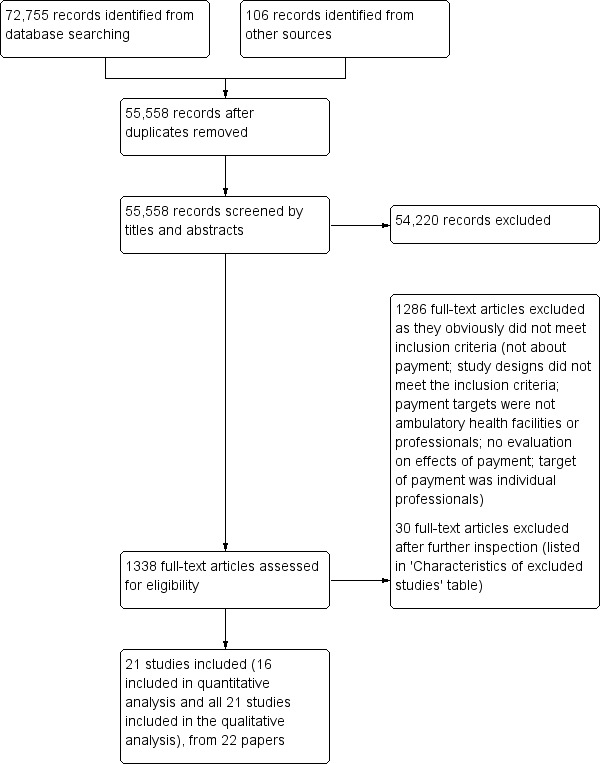
Study flow diagram.
Data extraction and management
Two review authors independently carried out data extraction using a data extraction form adopted from the Cochrane good practice data collection form (EPOC 2013a). The information we extracted included:
general information of study;
participants and setting;
study method;
intervention groups, including payment method description, duration of intervention, if patients can choose providers, how purchasers monitored the implementation of payment;
outcomes, including outcome measures, time points measured, unit of measurement, and person measuring outcomes;
results, including results reported by authors, analysis method, unintended effects, if re‐analysis was required and possible.
Any disagreements were resolved by discussion with a third review author or the EPOC contact editor. Data were managed in Microsoft Word. For interrupted time series (ITS) studies reporting time series data that are not appropriately analysed, we extracted and re‐analysed the data as described in the EPOC resources for review authors (EPOC 2013b).
Assessment of risk of bias in included studies
We used the EPOC suggested 'Risk of bias' criteria to assess the risk of bias for each outcome in all included studies (EPOC 2013c). For each criterion, two review authors independently described what was reported in the study, commented on the description, and judged the risk of bias. Any unresolved disagreements were discussed with a third review author, and, if consensus could not be reached, with the EPOC contact editor. We summarised the overall risk of bias across criteria for the primary outcome of the included studies. For randomised trials, non‐randomised trials, and controlled before‐after studies, we primarily considered four criteria: baseline outcome measurements, baseline characteristics measurements, incomplete outcome data addressed, and protection against contamination. If all four criteria were scored 'low risk of bias' for the outcome in a study, the summary assessment was that there was a low risk of bias; if one or more key criteria were scored 'unclear', the summary assessment was unclear risk of bias. If one or more key criteria were scored 'high risk of bias', the summary assessment was high risk of bias. For ITS studies, when we summarised the overall risk of bias across these criteria, we primarily considered the following criteria: intervention independence, intervention affecting data collection, and incomplete outcome data addressed.
Measures of treatment effect
For randomised trials, non‐randomised trials, and controlled before‐after studies, we recorded or calculated risk ratios (RRs) with 95% confidence intervals (CIs) for dichotomous outcomes. If adjusted analysis was done, we reported the effect estimates reported by the authors, also converting them into RRs when possible. For continuous outcomes, when possible, we reported the absolute change from a statistical analysis adjusted for baseline differences or the relative change adjusted for baseline differences in the outcome measures. If not enough data were provided for statistical analysis, we only reported the absolute and relative change adjusted for baseline differences.
For interrupted time series and repeated measures studies, we attempted to report the difference between the predicted value based on the pre‐intervention trend and the estimated value based on the change in level and postintervention trend at relevant time points (including immediately after the intervention (change in level), one year, two years, and three years). However, in all included interrupted time series studies, only one paper provided enough data for us to calculate the above effect outcomes, so for other interrupted time series studies, we only used change in level immediately after intervention and change in trend to measure the treatment effects, or the effects results reported by the authors if any re‐analysis was not possible.
We included five controlled before‐after studies with very high risk of bias and unclear reporting for a large number of outcomes, but did not use them in effects analyses (Bonfrer 2014a; Canavan 2008; Rudasingwa 2015; Soeters 2008; Soeters 2011).
Unit of analysis issues
We planned to re‐analyse comparisons that allocated clusters (e.g. clinics in one district) but did not account for clustering, if we could extract the intracluster coefficient. However, all included studies adjusted for clustering in their analyses.
Dealing with missing data
We contacted the original investigators to request missing data. At the time of submission of this review we had not received any response on missing data. We used the available data for those studies reporting the point estimate of effect measures without confidence intervals or, if that information was missing, we included the study in the review, but not in analyses of the effects of payment methods. If information on subgroup analyses was missing (e.g. for P4P, the size of the incentive or frequency of payment), we contacted the original investigators to request information. We received replies from two authors regarding P4P interventions. If we did not receive a response clarifying the P4P design, we did not include the study in subgroup analyses.
Assessment of heterogeneity
We conducted meta‐analysis to synthesise the effect measures of included studies if they had:
similar intervention and comparison payment methods: the payment methods evaluated by all studies were defined as the same category of payment;
same participants: e.g. all targets of payment methods included were primary care clinics or practices;
same category of outcome measures: e.g. all outcome measures were health service provision measures, or all were patient outcome measures.
When the included studies were similar enough based on the above criteria, we used the Chi2 test and I2 statistic to assess statistical heterogeneity. When the P value from a Chi2 test was smaller than 0.1, we interpreted this as an indication that the observed difference in results across studies was unlikely to have occurred by chance alone.
We used the random‐effects model for meta‐analysis across studies, because the payment methods included several components; the payment methods conducted by different purchasers or in different areas were not exactly the same; and the effectiveness of payment methods may also have been influenced by many contextual factors that varied in different studies. In addition, the outcome measures under the same category were not exactly the same in different studies.
We explored heterogeneity in the design of payment methods through prespecified subgroup analyses. We downgraded the certainty of the evidence for results from meta‐analyses with high levels of heterogeneity without a compelling explanation for the heterogeneity.
Assessment of reporting biases
We planned to use funnel plots to examine asymmetry and assess the potential of any asymmetry being due to publication bias. However, there were too few studies of similar comparisons to allow for a meaningful assessment of asymmetry.
Data synthesis
We conducted a structured synthesis, as described in the EPOC resources for review authors (EPOC 2013d). We firstly categorised the comparisons and outcomes, and then described the effects of different kinds of payment methods on different categories of outcomes. We also listed and described the differences in context and components of payment methods in different studies. We considered the potential influence of these factors on the effects of the payment methods in the Discussion. We planned on using meta‐analysis if we found more than one study with similar comparisons and outcomes. Only three randomised trials, Bardach 2013, Engineer 2016, and Petersen 2013, and one controlled before‐after study, Basinga 2011, were similar enough and provided sufficient data for a meta‐analysis. For these studies, we firstly used a fixed‐effect model for meta‐analysis within a study, if the study included more than one outcome in the same category of outcome measures (service provision measures or patients outcome measures). We then used the random‐effects model for meta‐analysis across studies. If the data for meta‐analysis were not available in some studies, we calculated the median and interquartile range of effect sizes, if there was a sufficient number of included studies. We reported RRs for dichotomous outcomes and the relative change for continuous outcomes.
For the synthesised effects of each comparison, we assessed the certainty of evidence for each outcome(i.e. the extent of our confidence in the estimate of effect across studies) using the GRADE approach (Guyatt 2008).
Subgroup analysis and investigation of heterogeneity
Based on the incentives of different reimbursement systems for outpatient care facilities (Table 5), in the protocol for this review we hypothesised and analysed the following factors (Table 6) that might affect the size of effects of payment methods to explain any differences in the effects of payment methods.
3. Factors that might modify the effects of changes in payment methods on the delivery of services per case.
| Explanatory factors | How we will categorise the factor | Hypothesised direction of the interaction | Basis for the hypothesis |
| Larger fees (per service) | Relative increase in fees (continuous) | Larger (positive) effects with larger relative increases | The larger the incentive, the larger the effect |
| Duration of follow‐up | When outcomes are measured relative to when the change was made (continuous) | Larger (positive) effects with shorter follow‐up | Other changes and adjustments over time might reduce the initial incentive. |
| Ownership | For‐profit vs not‐for‐profit ownership | Larger (positive) effects with for‐profit ownership | For‐profit facilities might be more motivated to increase income and therefore more sensitive to changes in incentives. |
| Multiple providers | Choice of providers available to patients vs little or no choice of providers | Larger (negative) effects with little or no choice | Need to attract and retain patients might provide counteractive incentives to offer more services. |
| Monitoring | Monitoring vs no monitoring of the delivery of services | Larger (negative) effects without monitoring | Monitoring might provide counteractive incentives to offer more services. |
Larger fees: Relative increase in fees.
Duration of follow‐up: When outcomes are measured relative to when the change was made.
Ownership: For‐profit versus not‐for‐profit ownership.
Multiple providers: Choice of providers available to patients versus little or no choice of providers.
Monitoring: Monitoring versus no monitoring of the delivery of services.
Of the three kinds of comparisons included in this review, there were enough studies for conducting subgroup analysis for only one comparison (between P4P plus existing capitation or input‐based payment with the existing payment method). Especially for the P4P, we hypothesised and analysed the following factors that might affect the size of effects of P4P payment to explain any differences in the effects of payment methods; these factors and hypothesis were based on the dimensions of P4P schemes defined by Conrad and Perry and the analysis of results‐based financing by Oxman (Conrad 2009; Oxman 2009).
Type of performance measures applied by P4P: service provision measures, patient outcome measures, or combined measures (P4P with provision measures leads to larger effects because provision behaviour is easier to change).
Type of performance target applied by P4P: threshold payment, or pay for each instance of service (P4P with pay for each instance of service leads to larger effects because one instance of service is easier to achieve).
Size of incentive (percentage of P4P payment on total income level): lower than 10%, 10% to 30%, higher than 30% (the larger the size, the larger the effects).
Frequency of monitoring and feedback: quarterly, annual (the more frequently the monitoring and feedback, the larger the effects).
Frequency of payment: quarterly, annual (the more frequently the payment, the larger the effects).
Resourcing: involvement of extra fund or not (involvement of extra fund leads to larger effects because of the support of extra resources).
Individual payment inside facility: no payment to individual, equally allocated to individual, or allocated to individual based on individual performance (allocation to individual based on individual performance leads to larger effects because individual health workers are more motivated).
Duration of follow‐up: 1 year or less, 1.5 to 2 years, 3 years (larger effects with shorter follow‐up because changes and adjustments over time might reduce the initial incentive).
We did not include two factors we had prespecified in the protocol in the review: ownership (for‐profit versus not‐for‐profit ownership) and multiple providers (choice of providers available to patients versus little or no choice of providers), because data and information from the included studies were insufficient.
Sensitivity analysis
We did not use imputed data and did not include studies with a high risk of bias in meta‐analyses. We therefore did not conduct sensitivity analyses to assess the robustness of the findings in relation to assumptions about imputed data or judgments about the risk of bias, as planned in the protocol.
Results
Description of studies
See: Characteristics of included studies
Results of the search
We identified 55,558 references after removing duplicates. We screened this large number of references because the searches were conducted without the study design filters in MEDLINE Ovid and Embase in order to also find relevant studies for a larger scoping review on payment for health facilities or individual providers.
Two researchers independently examined these references. We retrieved 1338 full‐text articles regarded as potentially relevant, which two review authors read independently. We included 21 studies evaluating payment methods for outpatient health facilities (Figure 2). Basinga 2011 and a 2010 unpublished working paper by the same authors were from the same study (a P4P program in Rwanda). They had the same outcomes measures, analysis methods, and study results, so we listed the unpublished working paper as a secondary reference to Basinga 2011. Bonfrer 2014a, Soeters 2008, and Rudasingwa 2015 were also from the same study (a P4P program in Burundi), but they applied different outcome measures, data sources, and analysis methods, therefore we treated them as three studies in the analysis.
Included studies
Study design
We included 21 studies (see Characteristics of included studies): eight randomised trials (An 2008; Bardach 2013; Engineer 2016; Hillman 1998; Hillman 1999; Petersen 2013; Roski 2003; Yip 2014), six controlled before‐after studies (Basinga 2011; Bonfrer 2014a; Canavan 2008; Rudasingwa 2015; Soeters 2008; Soeters 2011), four interrupted time series studies (Catalano 2000; Catalano 2005; McLintock 2014; Serumaga 2011), and three repeated measure studies (Alshamsan 2012; Chien 2012; Lee 2011).
Participants and settings
All of the facilities in the included studies provided primary health care or mental health care, although the facilities had different names in different countries. Four studies evaluated P4P for general practitioner practises in the United Kingdom (Alshamsan 2012; Lee 2011; McLintock 2014; Serumaga 2011). Nine studies were conducted in the United States, of which two included community mental health centres (Catalano 2000; Catalano 2005). The remaining seven studies included clinics providing different types of primary health care, Bardach 2013, An 2008, Petersen 2013, Roski 2003, Hillman 1998, and Hillman 1999, or physician groups providing primary health care (Chien 2012). Eight studies were conducted in low‐ and middle‐income countries (Rwanda (Basinga 2011), Tanzania (Canavan 2008), Burundi (Soeters 2008), Democratic Republic of Congo (Bonfrer 2014a; Rudasingwa 2015; Soeters 2011), China (Yip 2014), and Afghanistan (Engineer 2016)). All of these studies from low‐ and middle‐income countries included primary healthcare facilities (centres).
Interventions' characteristics and comparison interventions
Characteristics of included studies tables provide a summary of the interventions and comparisons. The interventions varied. There were three types of comparisons: P4P plus some existing payment method (capitation or input‐based payment) compared to the existing payment method (Alshamsan 2012; An 2008; Bardach 2013; Basinga 2011; Bonfrer 2014a; Canavan 2008; Chien 2012; Engineer 2016; Hillman 1998; Hillman 1999; Lee 2011; McLintock 2014; Petersen 2013; Roski 2003; Rudasingwa 2015; Serumaga 2011; Soeters 2008; Soeters 2011); P4P combined with capitation compared to FFS (Yip 2014); and capitation versus FFS (Catalano 2000; Catalano 2005).
Most of the payment methods evaluated in the included studies were P4P, however the design of these P4P interventions varied. Based on the dimensions of P4P schemes defined by Conrad and Perry and the analysis of results‐based financing by Oxman (Conrad 2009; Oxman 2009), we systematically disentangled the P4P payment methods into seven components and described their characteristics (Table 7): the performance measures applied by P4P, the performance target for payment applied by P4P, size of incentive, frequency of monitoring, frequency of payment, individual payment inside the facility, and resourcing (if involvement of extra funding).
4. The characteristics of P4P payments included in review.
| Study | Performance measures | Performance target | Size of incentive | Frequency of monitoring | Frequency of payment | Individual payment | Resourcing (if with more funds) |
|
Alshamsan 2012 Lee 2011 Serumaga 2011 McLintock 2014 |
Both provision and outcome measures: 76 clinical quality indicators and 70 indicators relating to organisation of care and patient experience. Of the clinical indicators, 10 relate to maintaining disease registers, 56 to processes of care (such as measuring disease parameters and giving treatments), and 10 to intermediate outcomes (such as controlling blood pressure). | Threshold payment: Practices are awarded points based on the proportion of patients for whom targets are achieved, between a lower achievement threshold of 40% for most indicators (i.e. practices must achieve the targets for over 40% of patients to receive any points) and an upper threshold that varies according to the indicator. Each point earned the practice the certain level of money, adjusted for patient population size and disease prevalence. A maximum of 1000 points was available. | The highest level of performance payment is 25% of total income. | Annual | Annual | Allocated to individual based on individual performance | Yes |
| An 2008 | Provision outcome measures: referral of smokers to consultation | Threshold payment combined with payment for each instance: Clinics that referred 50 smokers would receive a USD 5000 performance bonus. Clinics would also receive $25 for each referral beyond the initial 50. | Not clear, but mentioned "This incentive amount was arrived at after consultation with the management team and represents an amount that was judged as likely to be meaningful to most clinics ..." | 10 months | 10 months | Into clinics' operation fund, no payment to individual physicians and administrators | Yes |
| Bardach 2013 | Both provision and outcome measures: 4 quality goals, including aspirin prescription, blood pressure control, cholesterol control, and smoking cessation intervention provision | Payment for each instance of performance measure unit: An incentive was paid for every instance of a patient meeting the quality goal (e.g. 1 blood pressure control USD 20). A higher payment was paid for patients with certain comorbidities or, as proxies for socioeconomic status, had Medicaid insurance or were uninsured. | Approximately 5% of an average physician's annual salary | Quarterly | Annual | Allocated to individual based on individual performance | Yes |
| Basinga 2011 | Process measures: The 14 key maternal and child healthcare output indicators. Some of these output indicators are reasons for a visit, such as prenatal care or delivery, whereas others are services provided during a visit, such as tetanus vaccination during prenatal care. | Payment for each instance of performance measure unit: Basis for payment is calculated based on the number of 14 kinds of services provided; the final payment level is adjusted based on quality index. | Facility funding increased by 22% | Quarterly | Quarterly | 77% of P4P1 funds to allocate to individual personnel, amounting to 35% increase in salary | No, control group funding also increased by the same level. |
| Canavan 2008 | Process measures: outpatient utilisation rate, delivery rate, VCT2 clients | Threshold payment: 50% of support paid upfront for the year; 50% paid retrospectively if all the targets are met (outpatient utilisation rate 0.6, delivery rate 20/1000, VCT2 clients 20/1000). | 8% of facility income | Semi‐annual | Semi‐annual | 50% maximum bonus allocated to individual | Yes |
| Chien 2012 | Both provision and outcome measures: diabetes patient completing all the missing care processes, and whether glycated haemoglobin and low‐density lipoprotein levels were lowered or at goal levels | Payment for each instance of performance measure unit: Certain amount of money for each patient paid if this patient met the performance target, e.g. USD 15 for 1 glycated haemoglobin test, USD 35 for glycated haemoglobin < 7%. | Not clear, but mentioned that "then incentive amount ... may not have been strong enough" | Annual | Annual | Not clear | Yes |
| Engineer 2016 | Provision outcome measures: volume of 9 primary health services provided, combined with service provision quality indicators | Payment for each instance of performance measure unit: Certain amount of bonus per unit per quarter, e.g. USD 1.30 to USD 2.67 for first antenatal care visit; final payment was also adjusted by quality indicators. | The bonus amounts paid were about 6% to 11% above health workers' base salary, and increased to about 14% to 28% depending on the health worker's cadre. | Quarterly | Quarterly | All allocated to individual, but the allocation method was determined by health facility managers, including giving individual bonuses proportional to the health worker's salary, giving them in equal amounts to all staff, or giving them based on their determination of an individual's contribution to the performance indicators. | Yes |
| Hillman 1998 | Provision outcome measures: compliance with a quality assurance policy, i.e. is referral of clinically indicated for Pap test, colorectal screening, or mammography | Threshold payment: 3 intervention sites with highest compliance scores received full bonus (20% of capitation); 3 with the next highest scores and the 3 improving most from previous audit both received partial bonus (10% of capitation). | 10% to 20% of capitation for all female members 50 years of age and older | Semi‐annual | Semi‐annual | Not clear, 38.5% of sites were solo group. | Yes |
| Hillman 1999 | Provision outcome measures: compliance with provision of defined services for children, including immunisation, other preventive services | Threshold payment: 3 intervention sites with highest compliance scores received full bonus (20% of capitation); 3 with the next highest scores and the 3 improving most from previous audit both received partial bonus (10% of capitation). | 10% to 20% of capitation for all paediatric members up to 7 years | Semi‐annual | Semi‐annual | Not clear, 42.1% of sites were solo group. | Yes |
| Petersen 2013 | Combined provision and outcome measures: blood pressure thresholds or appropriately responding to uncontrolled blood pressure, prescribing guideline‐recommended antihypertensive medications | Payment for each instance: a maximum prerecord reward of USD 18.20, USD 9.10 for each successful measure | Mean level was 1.6% of a physician's salary. | 4 months | 4 months | Equally allocated to individual physician, non‐physician in team | Yes |
| Roski 2003 | Provision outcome measures: Tobacco status clearly identified at each visit and documented in their medical records for their last visit; smokers should have provision of advice to quit smoking documented in their medical record. | Threshold payment: Performance targets were set at approximately 15 percentage points above the average performance for these clinic practices as assessed by the medical group 2 years prior to the effort described here. Incentive amounts were based on the number of providers per clinic. Specifically, clinics with 1 to 7 providers could receive a USD 5000 award, and clinics with 8 or more providers were eligible for a USD 10,000 bonus. Clinics that reached or exceeded only 1 of the 2 performance goals were eligible for half the amount. | Not clear, just discussed "it is not clear whether significantly higher incentive payments would have been able to focus clinic sites' attention more strongly on ..." |
Semi‐annual | Annual | Not clear, just mentioned "Clinics were provided with suggestions on how to spend earned incentive payments (i.e., travel and registration for educational courses). Ultimately, clinics decided how to allocate incentive payments." | Yes |
|
Soeters 2008 Bonfrer 2014a Rudasingwa 2015 |
Provision measures: health provision actions and quality composite index | Payment for each instance: Fixed amount paid per targeted action; multiplied by quality bonus ranging from 1 to 1.25 based on quarterly reviews of quality. | Studies published at different times reported different proportions: 58% of facility total revenue in 2009; in 2014, this part accounted for 40% of total health facility budget; in 2010, 20% of total health facility revenue. |
Quarterly | Quarterly | Allocated to individual based on individual performance, using a systematic approach called "indices". | Yes |
| Soeters 2011 | Provision measures: health provision actions and quality composite index with 154 indicators | Payment for each instance: Fixed amount paid per targeted action; top‐up of 15% available, based on quarterly reviews of quality. Also 15% additional payment for remote facilities. | Not clear, but should be the major component of funding for the health centres | Quarterly | Quarterly | Just mentioned facilities having discretion to pay staff. | Yes |
| Yip 2014 | Provision measures: antibiotic prescription rates and patient satisfaction | Threshold payment: 70% of the budget allocated to health facilities firstly, withholding the balance until after performance assessments at the middle and end of the year; after each assessment, the performance scores were compared between each health facility to the average score in the county; each centre that scored above the average received more than the 30% of the budget that had been withheld, in proportion to how much above the county average its score was. Each centre that scored below the average received less than the 30%, in proportion to how much lower than average its score was. | 30% of capitation budget | Semi‐annual | Semi‐annual | No allocation to individual | No |
1P4P: pay for performance 2VCT: voluntary counselling and testing
Performance measures applied by P4P
There were two categories of performance measures: provision performance measures and outcome performance measures. For the provision measures, payment was based on the providers' performance on the process of service provision, for example percentage of tobacco use identified and percentage of smokers receiving advice to quit (Roski 2003), percentage of patients whose blood pressure was measured (Serumaga 2011), percentage of patients with guideline‐based prescriptions and treatments (Petersen 2013), number or percentage of women having any prenatal care (Basinga 2011; Soeters 2008; Soeters 2011), or number or percentage of women with a facility‐based delivery (Basinga 2011; Bonfrer 2014a; Canavan 2008; Engineer 2016; Rudasingwa 2015; Soeters 2008; Soeters 2011). For the outcome measures, payment was based on patients' health or behaviour outcomes, for example the percentage of patients with blood pressure controlled (Alshamsan 2012; Bardach 2013; Petersen 2013), total cholesterol control (Alshamsan 2012; Lee 2011), or the percentage of smokers with seven‐days sustained abstinence from smoking (Roski 2003). There were also several P4P programs that used combined process and outcome performance measures (Alshamsan 2012; Bardach 2013; Lee 2011; Petersen 2013; Serumaga 2011).
Performance target for payment
This component is the level of performance for which the incentives were paid. There are two main categories in the included P4P methods: threshold payment and payment for each instance of performance. Threshold payment means that the providers only received the performance incentives if they achieved a certain level of performance, and this level of performance could be absolute performance or relative performance compared with other providers or their previous performance, for example at least 40% of covered patients with diabetes who have a record of total cholesterol (Alshamsan 2012; Lee 2011; Serumaga 2011), the outpatient utilisation rate achieving at least 0.6 per resident and the facility‐based delivery achieving at least 20/1000 (Canavan 2008), referral of at least 50 smokers (An 2008), percentage of tobacco status identified achieving 15% above the average performance (Roski 2003), or being one of six facilities with the highest compliance scores or one of three facilities improving the most from a previous audit (Hillman 1998; Hillman 1999). Payment for each instance of performance means providers received an award for each instance of service provision or patient's health improvement, for example payment of USD 20 for one case of blood pressure control (Bardach 2013), USD 15 for one glycated haemoglobin test (Chien 2012), or USD 18.20 payment for one blood pressure control or appropriate response to uncontrolled blood pressure (Petersen 2013). One P4P program used a combined performance target (An 2008), in which the intervention clinics who referred 50 smokers received a USD 5000 performance bonus, and clinics also received USD 25 for each referral beyond the initial 50.
Size of incentive
This component is the percentage of P4P incentives to the total income level of health facilities or individuals (if incentives were allocated to individuals within facilities). Some P4P incentives accounted for less than 10% of total income level of health facilities or individuals (Bardach 2013; Canavan 2008; Petersen 2013); in two P4P programs evaluated in four studies (Alshamsan 2012; Basinga 2011; Lee 2011; Serumaga 2011), incentive levels were about 20% to 25% of total facilities' income; in one program in Burundi (Soeters 2008), the P4P payments constituted 58% of facilities' revenue. In three studies, the levels of incentive were only compared with part of the facilities' revenue (20% of capitation for some female members 50 years of age and older) (Hillman 1998; Hillman 1999); 30% of capitation fee from one insurance plan (Yip 2014)). Several studies did not report the exact level of incentive (An 2008; Chien 2012; Roski 2003; Soeters 2011).
Frequency of monitoring and payment
The frequency of monitoring and payment was the same in most P4P programs, including quarterly (Basinga 2011; Bonfrer 2014a; Engineer 2016; Rudasingwa 2015; Soeters 2008; Soeters 2011), 4 months (Petersen 2013), semi‐annual (Canavan 2008; Hillman 1998; Hillman 1999; Yip 2014), 10 months (An 2008), and annual (Alshamsan 2012; Chien 2012; Lee 2011; McLintock 2014; Serumaga 2011). Two P4P programs had four times, in Bardach 2013, and two times, in Roski 2003, of monitoring on performance respectively, but both paid the health facilities annually.
Individual payment within facilities
How the facilities allocate the payment to individual health workers is an important component, potentially related to the effects of P4P methods. Some payment methods were explicitly described as incentives or bonuses allocated to individual physicians based on their individual performance (Alshamsan 2012; Bardach 2013; Bonfrer 2014a; Lee 2011; Rudasingwa 2015; Serumaga 2011; Soeters 2008), or were equally allocated to individuals (Petersen 2013). In P4P programs in Rwanda and Tanzania (Basinga 2011; Canavan 2008), part of P4P incentives received by facilities was used to increase individual's income, but the allocation criteria were not clear. In a P4P program in Afghanistan (Engineer 2016), all of the P4P incentives received by facilities were used to pay individual health workers, and facility managers decided the allocation criteria. In two P4P programs, facilities did not use the extra payment to reward individual health professionals (An 2008; Yip 2014). Four studies did not provide information on how the facilities allocated P4P payments to individuals (Hillman 1998; Hillman 1999; Roski 2003; Soeters 2011).
Resourcing (if extra funding)
Some P4P programs included the input of additional resources (Alshamsan 2012; An 2008; Bardach 2013; Bonfrer 2014a; Chien 2012; Engineer 2016; Hillman 1998; Hillman 1999; Lee 2011; Petersen 2013; Roski 2003; Rudasingwa 2015; Serumaga 2011; Soeters 2008; Soeters 2011), and the additional resources were paid based on performance. In another two P4P programs (Basinga 2011; Yip 2014), there was no input of additional resources, but adjusting of existing resources from input‐based payment or FFS to P4P.
Study outcomes
We categorised the majority of outcome measures in the included studies into two types: service provision measures and patient outcome measures.
Provision measures included the quantity and quality of service provision. They included the services related to the control of risk factors for chronic diseases, An 2008, Bardach 2013, Petersen 2013, Roski 2003, Serumaga 2011, Hillman 1998, Hillman 1999, and Rudasingwa 2015, and the general outpatient consultations (Yip 2014), for example the rate of smokers referred to a quit line (An 2008), the percentage of hypertension patients prescribed guideline‐recommended medications (Petersen 2013), and the percentage of outpatient visits with an antibiotic prescription (Yip 2014).
Patient outcome measures included patients' utilisation of health services and their intermediate and final health status changes, which could not be entirely controlled by providers. This category of outcome measures covered maternal and children healthcare services, Basinga 2011, Soeters 2008, Soeters 2011, Bonfrer 2014a, Engineer 2016, and Rudasingwa 2015, and the control of risk factors for chronic diseases (Alshamsan 2012; Bardach 2013; Lee 2011; Petersen 2013; Roski 2003; Serumaga 2011), for example the percentage of children aged 12 to 23 months being fully immunised (Basinga 2011), the percentage of general population with cholesterol control (Bardach 2013), the glycated haemoglobin level of diabetic patients (Alshamsan 2012), and the percentage of smokers’ 7‐day sustained abstinence from smoking (Roski 2003).
One study evaluating the effects of capitation compared with FFS also included costs of services as outcome measures, including total inpatient costs and total costs of treating people younger than 18 (Catalano 2000).
All outcome measures reported in the included studies are listed in Table 8.
5. Outcome measures of included studies (for studies included in effects analysis).
| Study | Primary outcomes | Secondary outcomes | Unintended or adverse effects | Length of observation | ||
| Provision outcomes | Patient outcomes | Costs | ||||
| Bardach 2013 | Proportion of patients 18 years or older with IVD1 or 40 years or older with DM2 taking aspirin or another antithrombotic therapy (including cilostazol, clopidogrel bisulfate, warfarin sodium, dipyridamole); Proportion of patients 18 years or older identified as current smokers who received certain smoking cessation services (cessation counselling, referral for counselling, or prescription or increased dose of a cessation aid) |
Proportion of patients aged 18 to 75 years with hypertension getting blood pressure control (with blood pressure lower than 140/90 mmHg (if without DM2) or lower than 130/80 mmHg (if with DM2)) (Health); Proportion of male patients 35 years or older and female patients 45 years or older without IVD1 or DM2 who have cholesterol control (total cholesterol lower than 240 mg/dL or low‐density lipoprotein lower than 160 mg/dL measured in the past 5 years) (Health) |
— | — | — | 12 months |
| Petersen 2013 | Proportion of physicians' patients getting the guideline‐recommended antihypertensive medications | Proportion of physicians' patients with blood pressure control or appropriate response to uncontrolled blood pressure (Health) | — | — | Performance of physician groups during the final intervention period to the post‐washout performance period | 24 months |
| Chien 2012 | — | Probability of diabetes patients getting glycated haemoglobin testing (Utilisation); Probability of diabetes patients getting lipid testing (Utilisation); Probability of diabetes patients getting dilated eye exam (Utilisation) |
— | — | — | 12 months |
| Basinga 2011 | Probablity of respondents getting tetanus vaccine during prenatal visit | Probability of respondents having any prenatal care (Utilisation); Probability of respondents having 4 or more prenatal care visits (Utilisation); Probability of respondents having institutional delivery (Utilisation); Probability of children younger than 23 months preventive visit in previous 4 weeks (Utilisation); Probability of children aged 24 to 59 months preventive visit in previous 4 weeks (Utilisation); Probability of children aged 12 to 23 months being fully immunised (Utilisation) |
— | — | — | 23 months |
| Roski 2003 | Percentage of tobacco users identified at last visit; Percentage of smokers who received advice to quit; Percentage of smokers who were offered assistance to quit at last visit |
Percentage of respondents reporting using any aids for smoking cessation (Utilisation); Percentage of respondents reporting using any medication for quitting (Utilisation); Percentage of respondents reporting using any counselling services (Utilisation); Percentage of smoker respondents 7‐day sustained abstinence from smoking (Health); Percentage of respondents being current smokers (7‐day point prevalence); Percentage of respondents reporting intention to quit within 30 days (Health) |
— | — | — | 12 months for provision outcomes; 18 months for patient outcomes |
| Serumaga 2011 | Proportion of patients receiving 0, 1, 2, and 3 or more classes of antihypertensive drugs as a proportion of all study patients | Proportion of patients with blood pressure measured each month (Utilisation); Proportion of patients with controlled blood pressure (blood pressure less than 150/90 mmHg) (Health); Percentage of patients with hypertension‐related adverse outcomes (myocardial infarction, stroke, renal failure, heart failure) or on all‐cause mortality (Health) |
— | — | — | 12 months; 24 months; 36 months |
| An 2008 | Rate of referral of smokers to quit line | Rate of smokers enrolled into quit line (Utilisation) | — | The marginal cost per additional quit line enrollee | — | 10 months |
| Hillman 1999 | Compliance scores3 of providers for immunisation; Compliance scores of providers for other indicators; Overall compliance scores of providers |
— | — | — | — | 6 months; 12 months; 18 months |
| Hillman 1998 | Compliance scores for Pap test; Compliance scores for colorectal screening; Compliance scores for mammography; Compliance scores for breast exam; Total compliance scores |
— | — | — | — | 6 months; 12 months; 18 months |
| Alshamsan 2012 | — | Glycated haemoglobin level for diabetes patients; Total cholesterol level for diabetes patients (Health); Systolic blood pressure for diabetes patients (Health); Diastolic blood pressure for diabetes patients (Health) |
— | — | Ethnic disparities in all outcomes | 12 months; 24 months; 36 months |
| Lee 2011 | — | Total cholesterol level for CHD4 patients (Health); Total cholesterol level for stroke patients (Health); Systolic blood pressure for CHD4 patients (Health); Systolic blood pressure for stroke patients (Health); Systolic blood pressure for hypertension patients (Health); Diastolic blood pressure for CHD4 patients (Health); Diastolic blood pressure for stroke patients (Health); Diastolic blood pressure for hypertension patients (Health) |
— | — | Ethnic disparities in all outcomes | 12 months; 24 months; 36 months |
| Yip 2014 | Percentage of visits with antibiotic prescription in Township Health Centre; Percentage of visits with antibiotic prescription in Village Posts |
— | — | Patient satisfaction score in Township Health Centre; Patient satisfaction score in Village Posts; Total expenditure per visit; Total drug expenditure visit |
Patient volume | — |
| Catalano 2000 | Number of people younger than 18 receiving outpatient services | Number of people younger than 18 receiving inpatient services; Number of people younger than 5 in treatment; Number of disruptive children in treatment; Number of people younger than 18 treated in emergency |
Total outpatient costs; Total costs of treating people younger than 18; Total inpatient costs |
— | — | 12 months 18 months |
| Catalano 2005 | — | Number of emergency visits by adults who had a primary mental or substance use disorder | — | — | — | 12 months |
| Engineer 2016 | — | Percentage of current use of modern family planning methods;
Percentage of at least 1 antenatal checkup from a skilled provider;
Percentage of skilled birth attendant present at latest delivery;
Percentage of postnatal checkup within 42 days of delivery by
a skilled provider;
Percentage of children who received pentavalent 3 vaccination; Concentration index for institutional deliveries; Concentration index for children's utilisation of outpatient services |
— | 20 indicators covering 5 domains of quality of care: Client and community perspectives, including an index of overall client satisfaction and perceived quality of care; Human resources perspectives, including a health worker satisfaction index and health worker motivation index; Physical capacity of health facility inputs (drugs, equipment, infrastructure); Quality of service provision, measuring 4 processes of care; and Management systems | — | 23 to 25 months |
| McLintock 2014 | Percentage of patients on the diabetes register or CHD4 register, or both, for whom case finding, diagnosis, and prescription for depression has been undertaken | — | — | — | Percentage of patients with non‐target long‐term physical conditions for whom case finding for depression, diagnosis, and prescription has been undertaken | 60 months |
1IVD: ischaemic vascular disease 2DM: diabetes mellitus 3Compliance scores: the extent of providers' consistent with the quality assurance criteria 4CHD: coronary heart disease
Excluded studies
Studies that initially appeared to meet the inclusion criteria but that were eventually excluded are listed in the Characteristics of excluded studies table. We excluded all of these studies because they did not fulfil the criteria for study design.
Risk of bias in included studies
Our assessment of the risk of bias for each of the included studies can be found in the 'Risk of bias' tables in the Characteristics of included studies tables.
Of the eight randomised trials, we assessed one study as at low risk of bias (Bardach 2013). We judged the remaining seven trials as having an unclear risk of bias for all the primary outcomes (An 2008; Engineer 2016; Hillman 1998; Hillman 1999; Petersen 2013; Roski 2003; Yip 2014). One major issue with some of the randomised trials was that the statistical comparison of the characteristics and outcomes of participants at baseline was not done (An 2008; Hillman 1998; Hillman 1999). This is not important for large randomised trials because of the randomised allocation; however, in this review small numbers of health facilities (12 to 143) were randomised.
Basinga 2011 was described as a randomised trial by the authors, but during the study the original randomised allocation of districts was changed. Originally, eight blocks were randomised into two comparison groups, and one group in each block was randomly assigned to the intervention group. However, before implementation of the baseline survey, the administrative district boundaries were redefined by the government in a decentralisation process. As a result, some of the districts selected for this study were combined with districts that already had existing P4P schemes. Consequently, the researchers had to switch the assignment (intervention or control) for eight districts from four blocks, and add one block to the sample. Due to the unclear allocation process and changed allocation, we grouped and analysed this study as a controlled before‐after study. Despite the change of allocation, the intervention and control groups were comparable in terms of the main characteristics and outcomes measured at baseline, so we rated this study as a controlled before‐after study with a low risk of bias.
We assessed five other included controlled before‐after studies as being at high risk of bias (Bonfrer 2014a; Canavan 2008; Rudasingwa 2015; Soeters 2008; Soeters 2011; ). The main issue with these studies was that the control areas had very different characteristics from the intervention areas. Another concern was that there were several different interventions or supports from international donors at the same time the intervention was evaluated (Bonfrer 2014a; Canavan 2008; Rudasingwa 2015; Soeters 2008; Soeters 2011). It was therefore not clear if the effects of the payment interventions were independent of other changes. We included these studies and described their characteristics in this review, but did not use them in analysing intervention effects.
Of seven ITS or repeated measure studies, we assessed one study as having a low risk of bias (Chien 2012), five studies as having an unclear risk of bias (Alshamsan 2012; Catalano 2000; Catalano 2005; Lee 2011; Serumaga 2011), and one study as having a high risk of bias for the primary outcomes (McLintock 2014). Catalano 2000 and Catalano 2005 used different data sources before and after the intervention. Alshamsan 2012, Lee 2011, Serumaga 2011, and McLintock 2014 all used existing medical record databases, and general practitioners' recording of performance measures may have improved in the intervention group (and not in the control group) after the intervention, because the financial incentives for their performance were based on what they recorded.
Effects of interventions
See: Table 1; Table 2; Table 3
Summary of findings for the main comparison. P4P plus some existing payment method compared with existing payment method for provision and patient outcomes.
| P4P plus some existing payment method compared with existing payment method for provision and patient outcomes | ||||
|
Patient or population: outpatient health facilities Settings: United States, United Kingdom, Rwanda, Afghanistan Intervention: P4P plus some existing payment method Comparison: existing payment method (capitation or input‐based payment) | ||||
| Outcomes |
Impact: RR for dichotomous outcomes and relative percentage change for continuous outcomes Median (range) |
No of participants (studies) | Certainty of the evidence (GRADE) | Comments |
| Provision outcomes (prescription of testing or treatment, dichotomous) | The adjusted RR median = 1.095 (ranged from 1.01 to 1.17) | 3 randomised trials and 1 CBA |
Moderate ⊕⊕⊕⊝ |
Of 3 randomised trials, 2 were rated as unclear risk of bias, and only 1 was rated as low risk of bias. The certainty was downgraded 1 level because of limitation in study design. |
| Provision outcomes (compliance with quality criteria, continuous) | The adjusted percentage change median = ‐1.345% (ranged from ‐8.49% to 5.8%) | 2 randomised trials |
Moderate ⊕⊕⊕⊝ |
2 randomised trials were rated as unclear risk of bias. The certainty was downgraded 1 level because of limitation in study design. |
| Patients' utilisation of health services (dichotomous) | The adjusted RR median = 1.01 (ranged from 0.96 to 1.15) | 3 randomised trials and 1 CBA |
Low ⊕⊕⊝⊝ |
3 randomised trials were rated as unclear risk of bias. The certainty was downgraded 1 level because of limitation in study design. The heterogeneity among estimates of effect of different studies was tested, and the certainty was downgraded 1 level because of inconsistency. |
| Patients' health outcomes (dichotomous) | The adjusted RR median = 1.01 (ranged from 0.98 to 1.04) | 1 randomised trial |
Low ⊕⊕⊝⊝ |
This trial was rated as unclear risk of bias. In addition, only 1 study targeting small primary health clinics in the United States was included, and the certainty was downgraded 1 level because of indirectness. |
| Provider outcomes | — | 0 | — | |
| Costs | The P4P intervention costs were greater than usual care costs without P4P incentives by USD 86,796 in total, and USD 83 per additional referral to telephone counselling and USD 300 per additional enrollee to quit line services. | 1 randomised trial |
Low ⊕⊕⊝⊝ |
This trial was rated as unclear risk of bias. In addition, only 1 study targeted 1 specific health service (referral to telephone counselling for smokers) in the United States, and the certainty was downgraded 1 level because of indirectness. |
| Adverse effects | When the P4P intervention ended, there was a significant reduction in performance in the intervention group compared with the control group. | 1 randomised trial |
Low ⊕⊕⊝⊝ |
This trial was rated as unclear risk of bias. In addition, only 1 study targeted primary care clinics in 5 Veterans Affairs networks in the United States, and the certainty was downgraded 1 level because of indirectness. |
| CBA: controlled before‐after study; P4P: pay for performance; RR: risk ratio | ||||
| GRADE Working Group grades of evidence
High certainty: This research provides a very good indication of the likely effect. The likelihood that the effect will be substantially different** is low.
Moderate certainty: This research provides a good indication of the likely effect. The likelihood that the effect will be substantially different** is moderate.
Low certainty: This research provides some indication of the likely effect. However, the likelihood that it will be substantially different** is high.
Very low certainty: This research does not provide a reliable indication of the likely effect. The likelihood that the effect will be substantially different** is very high. **Substantially different = a large enough difference that it might affect a decision. | ||||
Summary of findings 2. Capitation plus P4P compared with FFS for provision improvement.
| Capitation plus P4P compared with FFS for provision improvement | ||||
|
Patient or population: primary healthcare facilities in rural areas Settings: China Intervention: capitation plus P4P Comparison: FFS | ||||
| Outcomes | Impact: RR(95% CI) | No of participants (studies) | Certainty of the evidence (GRADE) | Comments |
| Provision outcomes | The adjusted RR for dichotomous outcome was 0.84 (95% CI 0.74 to 0.96) | 1 randomised trial |
Moderate ⊕⊕⊕⊝ |
This trial was rated as unclear risk of bias, and the certainty was downgraded 1 level because of limitation in study design. |
| Patient outcomes | — | 0 | — | |
| Provider outcomes | — | 0 | — | |
| Costs | — | 0 | — | |
| Adverse effects | — | 0 | — | |
| CI: confidence interval; FFS: fee‐for‐service; P4P: pay for performance; RR: risk ratio | ||||
| GRADE Working Group grades of evidence
High certainty: This research provides a very good indication of the likely effect. The likelihood that the effect will be substantially different** is low.
Moderate certainty: This research provides a good indication of the likely effect. The likelihood that the effect will be substantially different** is moderate.
Low certainty: This research provides some indication of the likely effect. However, the likelihood that it will be substantially different** is high.
Very low certainty: This research does not provide a reliable indication of the likely effect. The likelihood that the effect will be substantially different** is very high. **Substantially different = a large enough difference that it might affect a decision. | ||||
Summary of findings 3. Capitation compared with FFS for provision, patient, and cost outcomes.
| Capitation compared with FFS for provision, patient, and cost outcomes | ||||
|
Patient or population: mental health centres Settings: United States Intervention: capitation Comparison: FFS | ||||
| Outcomes | Impacts | No of participants (studies) | Certainty of the evidence (GRADE) | Comments |
| Provision outcomes (number of children treated as outpatients or for disruptive behaviour, or the number of very young children treated, continuous) | 1 study showed that in for‐profit mental health centres, capitation resulted in more children being treated as outpatients and for disruptive behaviour, and more very young children being treated. | 1 ITS study |
Very low ⊕⊝⊝⊝ |
The study design is ITS and was initially graded as moderate. This study was rated as unclear risk of bias, and so was downgraded 1 level because of limitation in study design. In addition, this study only targeted mental health centres in the United States, and the certainty was downgraded 1 level because of indirectness. |
| Patient outcomes (number of children in inpatient or emergency treatment, continuous) | 1 study showed that capitation resulted in a decrease in the number of inpatients. 2 studies showed contradictory results for the change in number of Emergency department visits. | 2 ITS studies |
Very low ⊕⊝⊝⊝ |
These 2 ITS studies were rated as unclear risk of bias, so the certainty was downgraded. The studies only targeted mental health centres in the United States, and so the certainty was downgraded because of indirectness. In addition, there was inconsistency in the results of the studies. |
| Cost outcomes (cost level, continuous) | 1 study showed that capitation resulted in a reduction in total costs for all services and costs for inpatient care in all mental health centres, and an increase in outpatients only in for‐profit mental health centres. | 1 ITS study |
Very low ⊕⊝⊝⊝ |
The study design is ITS and was initially graded as moderate. This study was rated as unclear risk of bias, and so was downgraded 1 level because of limitation in study design. In addition, this study only targeted mental health centres in the United States, and the certainty was downgraded 1 level because of indirectness. |
| Provider outcomes | — | 0 | — | |
| Adverse effects | — | 0 | — | |
| FFS: fee‐for‐service; ITS: interrupted time series | ||||
| GRADE Working Group grades of evidence High certainty: This research provides a very good indication of the likely effect. The likelihood that the effect will be substantially different** is low. Moderate certainty: This research provides a good indication of the likely effect. The likelihood that the effect will be substantially different** is moderate. Low certainty: This research provides some indication of the likely effect. However, the likelihood that it will be substantially different** is high. Very low certainty: This research does not provide a reliable indication of the likely effect. The likelihood that the effect will be substantially different** is very high. **Substantially different = a large enough difference that it might affect a decision. | ||||
Comparison 1: P4P plus existing capitation or input‐based payment compared to the existing payment method
Eighteen studies compared P4P plus existing capitation or input‐based payment with the existing payment method (Alshamsan 2012; An 2008; Bardach 2013; Basinga 2011; Bonfrer 2014a; Canavan 2008; Chien 2012; Engineer 2016; Hillman 1998; Hillman 1999; Lee 2011; McLintock 2014; Petersen 2013; Roski 2003; Rudasingwa 2015; Serumaga 2011; Soeters 2008; Soeters 2011), and we excluded five controlled before‐after studies from the effects analysis due to high risk of bias (Bonfrer 2014a; Canavan 2008; Rudasingwa 2015; Soeters 2008; Soeters 2011). Thirteen studies were included in the effects analysis under this comparison (Alshamsan 2012; An 2008; Bardach 2013; Basinga 2011; Chien 2012; Engineer 2016; Hillman 1998; Hillman 1999; Lee 2011; McLintock 2014; Petersen 2013; Roski 2003; Serumaga 2011). These studies found that adding P4P to an existing payment method probably slightly improved the care provided by health professionals (moderate‐certainty evidence) and may have little or no effect on utilisation of health services or patient outcomes (low‐certainty evidence) (Table 1).
Effect on provision outcomes
Nine studies reported provision outcomes, of which six randomised trials, Bardach 2013, Hillman 1998, Hillman 1999, Petersen 2013, Roski 2003, and An 2008, and one controlled before‐after study, Basinga 2011, reported seven dichotomous provision outcomes and nine continuous provision outcomes. Two ITS studies reported six dichotomous provision outcomes (McLintock 2014; Serumaga 2011). The nine studies included a variety of specific provision outcome measures (Table 8).
In the six randomised trials, Bardach 2013, Hillman 1998, Hillman 1999, Petersen 2013, Roski 2003, and An 2008, and the controlled before‐after study, Basinga 2011, that we included in the effects analysis, four studies reported dichotomous outcomes (Bardach 2013; Basinga 2011; Petersen 2013; Roski 2003). Of these, three studies reported an adjusted risk ratio (RR) and its confidence interval (CI), or reported other outcome measures and relevant data to calculate an adjusted RR and its CI (Bardach 2013; Basinga 2011; Petersen 2013). If we included only those three studies in the primary synthesis analysis (Table 9), the adjusted RR for improvement in service provision was 1.08 (95% CI 1.03 to 1.14) (Analysis 1.1). If we included all four studies in the primary analysis, the adjusted RR for improvement in services provision across the four studies ranged from 1.01 to 1.17 (median = 1.095). Three studies reported nine continuous outcomes (Table 10) (An 2008; Hillman 1998; Hillman 1999). Only one study did not report baseline data for calculating the baseline adjusted relative change (An 2008), and this study was excluded from this analysis. For the continuous provision outcomes, the adjusted percentage change ranged from ‐8.49% to 5.8% (median = ‐1.345%).
6. Effects of P4P on dichotomous provision outcomes.
| Study | Outcome measures | Control/baseline level | Risk ratio | Confidence intervals |
| 1.USA Bardach 2013, randomised trial | Proportion of patients with ischaemic vascular disease or diabetes mellitus getting aspirin therapy prescription | 59.7% | 1.10 | 1.04, 1.16 |
| Proportion of patients getting smoking cessation intervention | 18.9% | 1.23 | 1.03, 1.46 | |
| Synthesised effects inside the study (fixed‐effect model) | — | 1.11 | 1.05, 1.17 | |
| 2. USA Petersen 2013, randomised trial | Percentage of patients prescribed guideline‐recommended medications | 63.0% | 1.01 | 0.92, 1.12 |
| 3. Rwanda Basinga 2011, CBA | Proportion of respondents getting tetanus vaccine during prenatal visit | 67.0% | 1.08 | 0.997, 1.15 |
| Synthesised effect across the above 3 studies (random‐effects model) | — | 1.08 | 1.03, 1.14 | |
| 4. USA Roski 2003, randomised trial | Percentage of patients identified as tobacco users at last visit | 40.5% | 1.20 | — |
| Percentage of smokers who received advice to quit | 35.4% | 1.17 | — | |
| Percentage of smokers who were offered assistance to quit at last visit | 19.7% | 0.72 | — | |
| Synthesised effects inside the study (median) | — | 1.17 | — | |
| Synthesised effect across the above 4 studies (median) | — | 1.095 | — | |
CBA: controlled before‐after study P4P: pay for performance
1.1. Analysis.
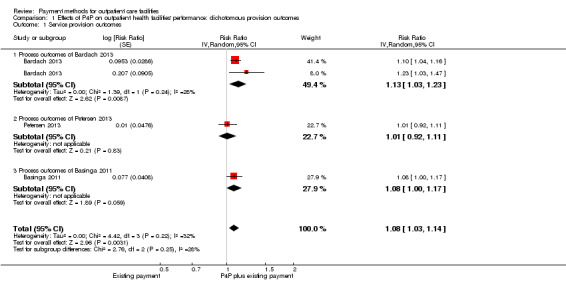
Comparison 1 Effects of P4P on outpatient health facilities' performance: dichotomous provision outcomes, Outcome 1 Service provision outcomes.
7. Effects of P4P on continuous provision outcomes.
| Study | Outcome measures | Control/baseline level | Absolute change | Relative change |
| 1. USA An 2008, randomised trial | Rate of referral of smokers to quit line (not adjusted by baseline, not used for analysis) | 4.2% | 7.2% | +171% |
| 2. USA Hillman 1999, randomised trial | Compliance scores for immunisation | 60.2% | 4.8% | +7.97% |
| Compliance scores for other indicators | 55.2% | 3.2% | +5.80% | |
| Overall compliance scores | 53.7% | 2.8% | +5.21% | |
| Synthesised effects inside the study (median) | — | 3.2% | 5.80% | |
| 3. USA Hillman 1998, randomised trial | Compliance scores for Pap test | 25.4% | ‐5.2% | ‐20.47% |
| Compliance scores for colorectal screening | 14.9% | 3.3% | +22.15% | |
| Compliance scores for mammography | 40.9% | ‐5.1% | ‐12.47% | |
| Compliance scores for breast exam | 23.0% | ‐0.2% | ‐0.87% | |
| Total compliance scores | 27.1% | ‐2.3% | ‐8.49% | |
| Synthesised effects inside the study (median) | — | ‐2.3% | ‐8.49% | |
| Synthesised effect across the above 4 studies (median) | — | — | ‐1.345% | |
P4P: pay for performance
One ITS study evaluated the impact of P4P on the proportion of patients receiving one, two, or three blood pressure control drugs (Serumaga 2011). It found little or no impact (Table 11). The second ITS study evaluated the impact of P4P on diagnosis and treatment of depression in patients with diabetes and coronary heart disease (McLintock 2014). It found an increase in the rate of diagnoses and the rate of new antidepressant prescriptions, but little or no change in the increase trend of these indicators.
8. Effect measures of included ITS and RM studies.
| Comparison 1: P4P plus some existing payment method vs existing payment method | |||||
| Study | Immediate change in level | Change in trend | Other effects results reported by authors | ||
| Estimate | Confidence interval | Estimate | Confidence interval | ||
| Serumaga 2011, ITS | |||||
| Proportion of patients receiving 1 drug (%) (provision outcome) | 0.07 | ‐0.83, 0.98 | 0.03 | ‐0.01 to 0.07 | ‐ |
| Proportion of patients receiving 2 drugs (%) (provision outcome) | 0.03 | ‐0.19, 0.26 | ‐0.01 | ‐0.01 to 0.02 | ‐ |
| Proportion of patients receiving 3 or more drugs (%) (provision outcome) | 0.11 | ‐0.26, 0.47 | 0.02 | ‐0.15 to 0.18 | ‐ |
| Percentage of patients with blood pressure measured each month (%) (patient outcome, utilisation) | 0.85 | ‐3.04, 4.74 | ‐0.01 | ‐0.24 to 0.21 | ‐ |
| Proportion of patients with controlled blood pressure (%) (patient outcome, health) | ‐1.19 | ‐2.06, 1.09 | ‐0.01 | ‐0.06 to 0.03 | ‐ |
| Percentage of patients with hypertension‐related adverse outcomes (myocardial infarction, stroke, renal failure, heart failure) or on all‐cause mortality (%) (patient outcome, health) | 0.07 | ‐0.13, 0.28 | 0.05 | ‐0.02 to 0.07 | ‐ |
| Alshamsan 2012, RM | |||||
| Systolic blood pressure level (patient outcome, health) | ‐1.95 | ‐2.87, ‐1.02 | ‐1.04 | ‐1.42 to ‐0.64 | ‐ |
| Diastolic blood pressure level (patient outcome, health) | ‐0.51 | ‐1.05, 0.01 | 0.19 | ‐0.03 to 0.41 | ‐ |
| Total cholesterol level (patient outcome, health) | ‐0.12 | ‐0.18, ‐0.06 | 0.03 | 0.01 to 0.05 | ‐ |
| Glycated haemoglobin level (patient outcome, health) | 0.04 | ‐0.04, 0.12 | 0.19 | 0.15 to 0.22 | ‐ |
| Lee 2011, RM | |||||
| Systolic blood pressure level for CHD patients (patient outcome, health) | ‐0.81 | ‐2.01, 0.49 | ‐0.53 | ‐1.09 to 0.02 | ‐ |
| Diastolic blood pressure level for CHD patients (patient outcome, health) | ‐0.32 | ‐1.06, 0.42 | 0.32 | ‐0.00 to 0.64 | ‐ |
| Total cholesterol level for CHD patients (patient outcome, health) | ‐0.01 | ‐0.08, 0.06 | 0.02 | ‐0.01 to 0.05 | ‐ |
| Systolic blood pressure level for stroke patients (patient outcome, health) | ‐1.92 | ‐3.89, 0.05 | ‐0.79 | ‐1.64 to 0.06 | ‐ |
| Diastolic blood pressure level for stroke patients (patient outcome, health) | ‐0.38 | ‐1.50, 0.74 | 0.26 | ‐0.22 to 0.74 | ‐ |
| Total cholesterol level for stroke patients (patient outcome, health) | ‐0.11 | ‐0.23, 0.02 | ‐0.01 | ‐0.05 to 0.07 | ‐ |
| Systolic blood pressure level for hypertension patients (patient outcome, health) | ‐1.18 | ‐1.76, ‐0.61 | ‐0.83 | ‐1.08 to ‐0.58 | ‐ |
| Diastolic blood pressure level for hypertension patients (patient outcome, health) | ‐0.77 | ‐1.10, ‐0.43 | 0.03 | ‐0.11 to 0.18 | ‐ |
| McLintock 2014 | |||||
| Rate of coded case finding for depression in patients with diabetes and CHD (provision outcome) | ‐ | ‐ | ‐ | ‐ | Increase from 0.07/1000 to 7.45/1000 per month (OR 99.76, 95% CI 83.15 to 119.68) |
| Rate of new depression‐related diagnoses in patients with diabetes and CHD (provision outcome) | ‐ | ‐ | ‐ | ‐ | Increase from 21/1000 to 94/1000 per month (OR 2.09, 95% CI 1.92 to 2.27), the trends before and after interventions were 0. |
| Rate of new antidepressant prescribing in these patients (provision outcome) | ‐ | ‐ | ‐ | ‐ | Rates of prescribing increased over the full period of observation. The trends before and after interventions were similar. |
| Chien 2012 | |||||
| Rate of patients receiving glycated haemoglobin testing (patient outcome, utilisation) | ‐ | ‐ | ‐ | ‐ | After the intervention the adjusted RR 1.00 (95% CI 0.94 to 1.04) |
| Rate of patients receiving lipid testing (patient outcome, utilisation) | ‐ | ‐ | ‐ | ‐ | After the intervention the adjusted RR 1.02 (95% CI 0.99 to 1.04) |
| Rate of patients receiving dilated eye exam (patient outcome, utilization) | ‐ | ‐ | ‐ | ‐ | After the intervention the adjusted RR 0.95 (95% CI 0.84 to 1.05) |
| Comparison 3: Capitation vs FFS | |||||
| Study | Immediate change in level | Change in trend | Other effects results reported by authors | ||
| Estimate | Confidence interval | Estimate | Confidence interval | ||
| Catalano 2005, ITS | |||||
| Number of emergency visits in not‐for‐profit health centres' area (patient outcome, health) | ‐7.422 | ‐12.808 to ‐2.036 | ‐0.332 | ‐0.510 to ‐0.154 | ‐ |
| Number of emergency visits in for‐profit health centres' area (patient outcome, health) | ‐5.305 | ‐12.861 to 2.251 | ‐0.164 | ‐0.419 to 0.091 | ‐ |
| Catalano 2000, ITS | |||||
| Number of people in outpatient treatment (provision outcome) | ‐ | ‐ | ‐ | ‐ | Weekly mean increase from 1196 before to 1299 after the intervention in for‐profit community health centres, the difference between real and expected level from history trend being 82.92, P < 0.01. No effects on not‐for‐profit community health centres. |
| Number of very young (< 5 years old) children in treatment (provision outcome) | ‐ | ‐ | ‐ | ‐ | Weekly mean increase from 94 before intervention to 100 after intervention in for‐profit community health centres, the difference between real and expected level from history trend being 18.53, P < 0.01. No effects on not‐for‐profit community health centres. |
| Number of children who receive treatment for disruptive behaviour (provision outcome) | ‐ | ‐ | ‐ | ‐ | Weekly mean increase from 287 before intervention to 318 after intervention in for‐profit community health centres, the difference between real and expected level from history trend being 72, P < 0.01. No effects on not‐for‐profit community health centres. |
| Number of inpatients treated (patient outcome, health) | ‐ | ‐ | ‐ | ‐ | Weekly mean decrease from 77 before intervention to 13 after intervention in not‐for‐profit health centres, the difference between real and expected level from history trend being ‐49, P < 0.01, weekly mean decreasing from 96 to 45 in for‐profit health centres, the difference between real and expected level from history trend being ‐52, P < 0.01. |
| Number of people treated in emergency (patient outcome, health) | ‐ | ‐ | ‐ | ‐ | Weekly mean change from 7.9 to 7.6 in for‐profit community health centres, the difference between real and expected level from history trend being 6.66, P < 0.01. No effects on not‐for‐profit community health centres. |
| Total costs for all services | ‐ | ‐ | ‐ | ‐ | Weekly mean change from 507,796 before intervention to 534,800 after intervention, the difference between real and expected level from history trend being USD ‐211,400 in not‐for‐profit health centres P < 0.01, weekly mean changing from 421,705 to 441,341, the difference between real and expected level from history trend being USD ‐178,500 in for‐profit health centres P < 0.01. |
| Total costs for inpatient care | ‐ | ‐ | ‐ | ‐ | Weekly mean change from 186,834 to 51,717, the difference between real and expected level from history trend being USD ‐134,200 in not‐for‐profit health centres P < 0.01, weekly mean changing from 216,166 to 111,238, the difference between real and expected level from history trend being USD ‐201,200 in for‐profit health centres P < 0.01. |
| Total outpatient costs | ‐ | ‐ | ‐ | ‐ | Weekly mean change from 205,539 to 330,102 in for‐profit health centres, the difference between real and expected level from history trend being USD 44,577, P < 0.01. No effects on not‐for‐profit community health centres. |
CHD: coronary heart disease CI: confidence interval FFS: fee‐for‐service ITS: interrupted time series study OR: odds ratio P4P: pay for performance RM: repeated measures study RR: risk ratio
Effect on patient outcomes
Among the 13 studies included in this comparison, 10 studies reported patient outcomes, including five randomised trials and one controlled before‐after study reporting 23 dichotomous outcomes and 3 continuous outcomes (An 2008; Bardach 2013; Basinga 2011; Engineer 2016; Petersen 2013; Roski 2003), and 4 ITS or repeated measures (RM) studies reporting 6 dichotomous outcomes and 12 continuous outcomes (Alshamsan 2012; Chien 2012; Lee 2011; Serumaga 2011). The specific patient outcome measures varied (Table 8). We grouped these outcome measures into outcomes related to utilisation of services and outcomes related to health outcomes, as described in the Methods section.
The outcome measure for one trial was a combination of patient outcome and provision outcome and was excluded from analysis (Petersen 2013). In the remaining studies, three studies' outcomes were related to utilisation of services (Basinga 2011; Engineer 2016; Roski 2003), of which two studies reported an adjusted RR and its CI, or reported relevant data to calculate an adjusted RR and its CI (Basinga 2011; Engineer 2016). Including only these two studies in the primary analysis (Table 12), the adjusted RR for improvement in service utilisation was 1.11 (95% CI 1.02 to 1.22) (Analysis 2.1). If we included all four studies in the primary analysis, the adjusted RR for improvement in service utilisation across the four studies ranged from 0.96 to 1.15 (median = 1.01).
9. Effects of P4P on dichotomous patient outcomes.
| Study | Outcome measures | Control/baseline level | Risk ratio | Confidence intervals |
| Utlisation outcomes | ||||
| 1. Rwanda Basinga 2011, CBA | Proportion of respondents having any prenatal care | 96.0% | 1.002 | 0.98, 1.03 |
| Proportion of respondents having 4 or more prenatal care visits | 11.0% | 1.07 | 0.43, 1.72 | |
| Proportion of respondents having institutional delivery | 36.0% | 1.23 | 1.04, 1.41 | |
| Proportion of children younger than 23 months preventive visit in previous 4 weeks | 0.24% | 1.50 | 1.17, 1.83 | |
| Proportion of children aged 24 to 59 months preventive visit in previous 4 weeks | 0.14% | 1.79 | 1.42, 2.16 | |
| Proportion of children aged 12 to 23 months being fully immunised | 0.63% | 0.91 | 0.71, 1.12 | |
| Synthesised effects inside the study (fixed‐effect model) | — | 1.01 | 0.99, 1.04 | |
| 2. Afghanistan Engineer 2016, randomised trial | Percentage of current use of modern family planning methods | 10.3 | 0.96 | 0.47, 1.95 |
| Percentage of at least 1 antenatal checkup from a skilled provider | 56.9 | 1.01 | 0.85, 1.20 | |
| Percentage of skilled birth attendant present at latest delivery | 22.5 | 1.19 | 0.91, 1.55 | |
| Percentage of postnatal checkup within 42 days of delivery by a skilled provider | 24.7 | 1.03 | 0.10, 10.39 | |
| Percentage of children received pentavalent 3 vaccination | 62.0 | 0.95 | 0.90, 0.99 | |
| Synthesised effects inside the study (fixed‐effect model) | — | 0.96 | 0.92, 1.00 | |
| Synthesised effect across the above 2 studies (random‐effects model) | — | 1.11 | 1.02, 1.22 | |
| 3. USA Roski 2003, randomised trial | Percentage of respondents reporting using any aids for smoking cessation | 22.3% | 0.93 | — |
| Percentage of respondents reporting using any medication for quitting | 21.6% | 0.92 | — | |
| Percentage of respondents reporting using any counselling services | 1.0% | 1.23 | — | |
| Percentage of smoker respondents with 7‐day sustained abstinence from smoking | 19.2% | 1.16 | — | |
| Percentage of respondents being current non‐smokers (7‐day point prevalence) | 19.2% | 1.17 | — | |
| Percentage of respondents reporting intention to quit within 30 days | 9.4% | 1.13 | — | |
| Synthesised effects inside the study (median) | — | 1.145 | — | |
| Synthesised effect across the above 3 studies (median) | — | 1.01 | — | |
| Health outcomes | ||||
| 4. USA Bardach 2013, randomised trial | Proportion of patients with no IVD or DM getting blood pressure control | 34.6% | 1.14 | 1.03, 1.25 |
| Proportion of patients with IVD getting blood pressure control | 47.8% | 0.82 | 0.56, 1.11 | |
| Proportion of patients with DM getting blood pressure control | 11.8% | 1.43 | 1.10, 1.84 | |
| Proportion of patients with IVD or DM getting blood pressure control | 17.0% | 1.29 | 1.06, 1.55 | |
| Proportion of general population with cholesterol control | 91.4% | 0.99 | 0.96, 1.01 | |
| Synthesised effects inside the study (fixed‐effect model) | — | 1.01 | 0.98, 1.04 | |
| Combined health and provision outcomes | ||||
| 5. USA Petersen 2013, randomised trial | Percentage of patients achieving guideline‐recommended blood pressure thresholds or receiving an appropriate response to uncontrolled blood pressure (combination of provision and patients outcome measure, not used for analysis) | 86% | 1.04 | 0.98, 1.10 |
| Synthesised effect across the above 3 studies (median) | — | 1.07 | — | |
CBA: controlled before‐after study DM: diabetes mellitus IVD: ischaemic vascular disease P4P: pay for performance
2.1. Analysis.
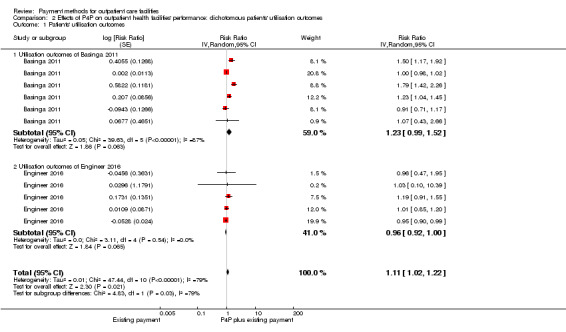
Comparison 2 Effects of P4P on outpatient health facilities' performance: dichotomous patients' utilisation outcomes, Outcome 1 Patients' utilisation outcomes.
Two randomised trials reported one continuous outcome related to utilisation of services (An 2008; Engineer 2016). An 2008 found that the overall percentage of smokers who were enrolled in a quit line service was higher in intervention clinics (3.0%) compared with control clinics (1.3%; relative change without adjusting for baseline being 131%, P = 0.005). Engineer 2016 evaluated the effects of P4P on the equity of health service utilisation by measuring concentration index (an index measuring the extent to which a health indicator is concentrated among the disadvantaged or the advantaged). The concentration index score ranges from ‐1 to 1 with 0 meaning the total equity. Given that a population is ranked by increasing socioeconomic status, the concentration index has a negative value when the health indicator is concentrated among the disadvantaged, and has a positive value when the health indicator is concentrated among the advantaged. They found that there was little or no change in the inequity level for the institutional deliveries (concentration index increased by 75.7% from a baseline level of 0.1000 (P = 0.3)) and children's utilisation of outpatient services (concentration index decreased by 46.81% from baseline level of 0.0047 (P = 0.98)).
One trial's outcomes were related to health outcomes (proportion of patients with blood pressure control and proportion of general population with cholesterol control) (Bardach 2013). In this study, the adjusted RR for improvement in patients' health outcomes was 1.01 (95% CI 0.98 to 1.04) (Analysis 3.1).
3.1. Analysis.
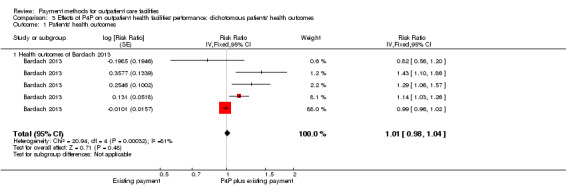
Comparison 3 Effects of P4P on outpatient health facilities' performance: dichotomous patients' health outcomes, Outcome 1 Patients' health outcomes.
One ITS study, Serumaga 2011, and two RM studies, Alshamsan 2012 and Lee 2011, reported the immediate level change after the intervention and the change in trend after intervention for patient outcomes (Table 11). Serumaga 2011 evaluated the effects of P4P incentive on quality of care and outcomes among patients in the United Kingdom with hypertension in primary care. This study included patient utilisation and patient health outcomes: the percentage of patients with blood pressure measured, the proportion of patients with controlled blood pressure, and the percentage of patients with hypertension‐related adverse outcomes (myocardial infarction, stroke, renal failure, heart failure). It found that there was little or no change in levels and change trends of these outcome measures before and after the P4P scheme. Alshamsan 2012 evaluated the same P4P scheme in the United Kingdom on diabetes patients’ systolic blood pressure level, diastolic blood pressure level, total cholesterol level, and glycated haemoglobin level. It found that the introduction of this P4P scheme was associated with an initial reduction in systolic blood pressure level, and that this improvement was sustained over the three years following the P4P scheme. The P4P was also associated with an initial reduction in cholesterol level, but this reduction was not sustained, and this P4P scheme had little or no effect on diastolic blood pressure level and glycated haemoglobin level. Lee 2011 also evaluated this P4P scheme in the United Kingdom on stroke, hypertension, and management of coronary heart disease (CHD), and found that the scheme resulted in a reduction in systolic blood pressure level and diastolic blood pressure level for hypertension patients immediately after the start of the P4P scheme, but this reduction was only sustained for the systolic blood pressure level. This study found that the P4P scheme had little or no impact on other health outcome measures, including systolic blood pressure level and diastolic blood pressure level for CHD patients, total cholesterol level for CHD patients, systolic blood pressure level and diastolic blood pressure level for stroke patients, and total cholesterol level for stroke patients. Another RM study reported insufficient data for re‐analysis to obtain the change in level and change in trend for outcome measures (Chien 2012). It found that immediately after the intervention there was little or no change in the rate of patients receiving glycated haemoglobin testing, the rate of patients receiving lipid testing, and the rate of patients receiving dilated eye examination.
Effect on healthcare provider outcomes
No relevant healthcare provider outcomes were reported.
Effect on cost
Only An 2008 reported the cost of implementing the P4P program for referral of smokers to telephone counselling. The results showed that the P4P intervention costs were greater than usual care costs without P4P incentives by USD 86,796 in total. In return for these costs, intervention clinics provided 1042 additional referrals of smokers to telephone counselling that resulted in 289 additional enrollees. The marginal cost for the intervention clinics was therefore USD 83 per additional referral to telephone counselling and USD 300 per additional enrollee to quit line services (low‐certainty evidence) (Table 1).
Unintended or adverse effects
Four studies reported some unintended or adverse effects. Petersen 2013 found that after the P4P intervention had ended, there was a significant reduction in blood pressure control and appropriate response to uncontrolled blood pressure in the intervention group compared with the control group (low‐certainty evidence) (Table 1).
Effect on secondary outcomes
No relevant secondary outcomes were reported.
Comparison 2: Capitation plus P4P versus FFS
We included one study in this comparison (Yip 2014), which found that capitation plus P4P probably slightly improved antibiotic use, which was the performance target for the P4P (moderate‐certainty evidence) (Table 2).
The intervention in this study was a payment reform aimed at improving the quality of services provided by primary health providers in rural China. The performance target was designed to control antibiotics use. This intervention was applied by the New Rural Cooperative Medical Insurance (NCMS), the major health insurance for rural residents in China. In intervention areas, NCMS changed its traditional FFS to the capitated budget based on the number of NCMS enrollees for each health facility, and at the beginning of every year the NCMS disbursed 70% of the budget to the health centres, withholding the balance until after performance assessments at the middle and end of the year. The performance indicators included antibiotic prescription rates (oral and by injection) and measures of patient satisfaction.
Effect on provision outcomes
One randomised trial evaluated this intervention (Yip 2014), finding that compared with FFS, capitation combined with P4P targeting control of antibiotic prescriptions led to a reduction of antibiotic prescriptions in village and township health facilities in China (adjusted RR 0.84, 95% CI 0.74 to 0.96) (Analysis 4.1).
4.1. Analysis.
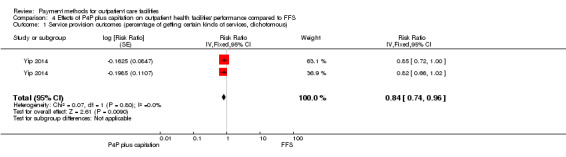
Comparison 4 Effects of P4P plus capitation on outpatient health facilities' performance compared to FFS, Outcome 1 Service provision outcomes (percentage of getting certain kinds of services, dichotomous).
Effect on patient outcomes
No relevant outcomes were reported.
Effect on healthcare provider outcomes
No relevant healthcare provider outcomes were reported.
Effect on cost
No relevant outcomes were reported.
Unintended or adverse effects
Capitation could provide incentives to under provide health care, so this study also analysed if the intervention influenced patient volume. They found that at the township and village health facility levels, the adjusted relative change for the number of patient visits per day was ‐14.3% (P > 0.01) and ‐9.3% (P > 0.01), respectively.
Effect on secondary outcomes
Yip 2014 also analysed the effects of capitation plus P4P on total expenditure per visit, drug expenditure per visit, and patient satisfaction. At the township health facility level, there was little or no difference in the total expenditure, which increased by CNY 0.02 (adjusted relative change 0.096%, P = 0.994), or the expenditure for drugs, which decreased by CNY 0.88 (adjusted relative change 4.74%, P = 0.600). At the village health facility level, the total expenditure decreased by CNY 1.04 (adjusted relative change 6.3%, P = 0.002), and there was little or no difference in expenditure for drugs, which decreased by CNY 0.24 (adjusted relative change 2.1%, P = 0.227). There was little or no difference in patients' satisfaction with the healthcare services, measured using a satisfaction score from 1 (very dissatisfied) to 5 (very satisfied) (adjusted relative change ‐0.46% (P = 0.913) and ‐0.38% (P = 0.693) at the township and village health facility level, respectively).
Comparison 3: Capitation versus FFS
Two studies evaluated the effects of capitation for community mental health centres compared with FFS in the United States (Catalano 2000; Catalano 2005). The effects of capitation compared to FFS based on these studies were uncertain (very low‐certainty evidence) (Table 3).
Effect on provision outcomes
Catalano 2000 was an ITS that analysed the effects of capitation on provision outcomes. Capitation offered incentives to provide more prevention or outpatient services for controlling cost with the fixed total payment based on number of registered patients. This study used three provision outcomes: the number of people receiving outpatient treatment, the number of very young (less than 5 years old) children in treatment, and the number of children receiving treatment for disruptive behaviour, because the author assumed that capitation incentivised providers to detect health problems in children of a younger age and with a less serious status, so that more serious episodes and more expensive treatment were reduced. This ITS did not report the results in detail, and provided insufficient data to conduct re‐analysis, so we only described the results reported by the authors. They reported increases in all three provision outcomes with capitation in only one subgroup of intervention areas (for‐profit community health centres) (Table 11).
Effect on patient outcomes
Two outcomes, the number of people requiring inpatient treatment and the number of people requiring emergency treatment, were regarded as health outcomes. Catalano 2000 found that capitation resulted in a decrease in the number of inpatients treated in all subgroups of intervention areas; for the number of people treated in emergency, only the initial level increase was observed in the for‐profit community health centres subgroup, but the increase was not sustained (Table 11).
Another ITS study also reported effects on emergency visits (Catalano 2005), finding that in not‐for‐profit health centres there was a reduction in emergency visits shortly after capitation payment, and the increase trend of emergency visits was reduced after capitation; in for‐profit health centres, there was little or no effect on emergency visits and the change trend of emergency visits (Table 11).
Effect on healthcare provider outcomes
No relevant healthcare provider outcomes were reported.
Effect on costs
Catalano 2000 reported downward shifts in the total costs for all services and the total costs for inpatient care in both the not‐for‐profit and for‐profit capitated health centres. Regarding total outpatient costs, the increase was only found in the for‐profit health centres (Table 11).
Unintended or adverse effects
No relevant outcomes were reported.
Effect on secondary outcomes
No relevant outcomes were reported.
Discussion
Summary of main results
P4P combined with an existing capitation or input‐based payment method compared to the existing payment method
In this comparison, the majority of P4P interventions (12 of 14 included P4P programs) was a marginal payment (extra payment aiming to modify targeted provider behaviours) that did not replace regular funding systems (or cover full costs of service provision). We found evidence to suggest that extra P4P incentives probably slightly improved the use of some tests and treatments by health providers, but likely lead to little or no difference in adherence to quality assurance criteria. We also found that P4P incentives may lead to little or no difference in patients' utilisation of health services or health outcomes. One study found that adding a P4P scheme to an existing payment method may lead to higher costs than the existing payment method (An 2008).
Capitation combined with P4P compared to FFS
We included only one study in this comparison. The P4P was mainly targeted at controlling antibiotic prescriptions in outpatient visits. Compared with FFS, a capitated budget combined with payment based on providers' performance on antibiotic prescriptions and patient satisfaction probably slightly reduced antibiotic prescriptions in primary health facilities.
Capitation compared to FFS
This intervention targeted mental health centres in the included studies and aimed to motivate health providers to provide more outpatient and preventive services to control overall costs. The effects of capitation compared to FFS based on this evidence were uncertain, because the certainty of this evidence was very low.
Overall completeness and applicability of evidence
The health facilities in the studies included in this review all provided primary health care or mental health care. We found no evidence on dental clinics. This review covered most payment methods for outpatient health facilities other than budget payment. However, we identified only three comparisons. For the comparison of P4P added to an existing capitation or an input‐based payment method versus the existing payment method, four of the primary outcomes were reported in one or more studies: service provision, patient outcomes, costs, and adverse effects. However, only one study reported costs, no studies reported provider outcomes, and the certainty of the evidence was low for utilisation of health services and patient outcomes. These studies were from low‐, middle‐, and high‐income countries.
Nearly all of the P4P programs included extra funding in addition to the change in the payment method. It is thus unclear to what extent the effects of these P4P programs on service provision can be attributed to the increase in resources, and it is uncertain whether P4P programs that do not include extra funding would have similar effects. In addition, information on how the incentive payments were used inside the health facilities was lacking in some of the included studies. Since P4P is intended to improve targeted behaviours through financial incentives, it is uncertain to what extent the way in which incentive payments were used influenced the effects of the P4P programs that were evaluated, and it would be difficult to replicate (or know how to improve) this component of the programs.
The countries in which the included studies were conducted had well‐developed electronic records or insurance claim data (in high‐income countries) or specially designed data systems for evaluating the effects of P4P programs (in low‐ and middle‐income countries). Unavailability of an electronic information system or resources to support the administrative cost of P4P will limit its use.
The studies comparing capitation combined with P4P to FFS, or capitation to FFS were conducted in one country (China or the United States), so the evidence base is incomplete, and the findings may have limited applicability in other settings.
Subgroup analysis
We included more than one study evaluating the effects of P4P on service provision, utilisation, and health outcomes. Four included studies evaluated utilisation outcomes, but one study did not report the design of P4P components clearly (Roski 2003), leaving only three studies for subgroup analysis of the effects of P4P on service provision (Table 13). Due to the limited number of studies and multiple differences between the P4P programs (Table 7), we were unable to conduct meaningful subgroup comparisons (Table 13).
10. Subgroup analysis.
| Bardach 2013 | Petersen 2013 | Basinga 2011 | |
| Effects size for service provision measures | RR 1.11 (1.05, 1.17) | RR 1.01 (0.92, 1.12) | RR 1.08 (0.997, 1.15) |
| Design of P4P | |||
| Performance measures | Both provision and outcome measures | Both provision and outcome measures | Both provision and outcome measures |
| Performance target | Pay for each instance of performance measure unit | Pay for each instance of performance measure unit | Pay for each instance of performance measure unit |
| Size of incentive | 5% of an average physician's annual salary | 1.6% of an average physician's annual salary | 35% increase in salary |
| Frequency of monitoring | Quarterly | 4 months | Quarterly |
| Frequency of payment | Annual | 4 months | Quarterly |
| Individual payment | Allocated to individual based on individual performance | Equally allocated to individual physician, non‐physician in team | 77% of P4P fund allocated to individual personnel, but not clear how it was allocated |
| Resourcing (if with more funds) | Yes | Yes | No (in control facilities, the input‐based payments were increased by the average amount of P4P payments received by facilities in the intervention group) |
P4P: pay for performance RR: risk ratio
Certainty of the evidence
The certainty of the evidence for the effects of adding P4P to an existing payment method on the provision of services (use of tests or treatments) was moderate because of study limitations. We assessed only one study as having low risk of bias. Common problems among the studies included: no clear description of the random allocation method or factors uncontrolled by researchers (policy change) influencing the initial random allocation, and no baseline outcomes and characteristics for small numbers of facilities that were randomly allocated. The certainty of the evidence for adherence to quality criteria was also moderate due to heterogeneity. Only one study provided four specific patient health outcomes. The certainty of this evidence on health outcomes was low because of the risk of bias and uncertainty about the applicability of the evidence outside of the setting in which the study was done (small primary health clinics in the United States) (Table 1).
The certainty of the evidence for the effects of capitation combined with P4P compared to FFS on provision of services was moderate because there was only one randomised trial with unclear of risk of bias and uncertainty about the applicability of the evidence outside of the setting in which the study was done (primary healthcare facilities in rural China) (Table 2).
The certainty of the evidence for the effects of capitation compared to FFS on the provision of services, health outcomes, and costs was very low because of the risk of bias. We included only two ITS studies in mental health centres in the United States in this comparison. The studies used different data sources before and after the intervention (Medicaid fee‐for‐service claims before and a shadow billing system after) (Table 3).
Potential biases in the review process
We carried out an extensive search to ensure that we identified all relevant studies, but it remains possible that we could have missed some unpublished studies. We contacted the authors of relevant studies to clarify some questions on the design of payment methods and research results, and for finding additional and ongoing studies, but at the time of submission of this review we had received a reply from the author of only one study.
Agreements and disagreements with other studies or reviews
Current reviews on payment are focused on payments to individual health professionals (Gosden 2000; Houle 2012; Witter 2012), and there are no reviews on payments to facilities. However, there are several reviews on the effectiveness of P4P that overlap with this review (Petersen 2006; Schatz 2008; Scott 2011; Witter 2012). There are two reasons for overlap. One is that some reviews targeted one type of payment intervention (e.g. P4P) but did not constrain the level of payment (individual or facility) (Petersen 2006; Scott 2011; Witter 2012). The other is that one review focused on payment to health professionals (Scott 2011), but also included payment to practices or physician groups. We found that some studies asserted that the payment methods they evaluated were to health professionals or physicians (Engineer 2016; Hillman 1998; Hillman 1999), but that the payment was actually based on performance of a facility or physician group. In this situation, only part of the payment is allocated to individual health professionals, or all of the payment is allocated to individuals but not allocated based on individuals' behaviours. The mechanism of how these payments affect behaviours may be different from how direct payments to individuals affect behaviours. Our review included all payment methods to facilities and excluded direct payments to individuals.
Regarding the Cochrane reviews that overlap with our review (Scott 2011; Witter 2012), we contacted the authors, compared our data extraction, and discussed any disagreements. For several controlled before‐after studies from low‐income countries included in the Witter 2012 review (Canavan 2008; Soeters 2008; Soeters 2011), we included them only for description and not for effects analysis. We only included studies with low or unclear risk of bias in our analysis, as this provides better evidence to analyse the effects. For the comparison of P4P plus an existing payment method to the existing payment method, other reviews all found that the effects of P4P varied in direction and size (Petersen 2006; Schatz 2008; Scott 2011), so that it was difficult to draw general conclusions. Different from those reviews, we categorised outcome measures into provision outcomes, utilisation outcomes, and health outcomes, based on the extent of control of health providers on these outcomes, and attempted to draw conclusions on the effects of P4P at the facility level on each category of outcomes.
Authors' conclusions
Implications for practice.
If policymakers are considering the use of pay‐for‐performance (P4P) incentives to pay outpatient health facilities, our review found that this intervention will probably lead to a slight improvement in service delivery, such as the use of tests or treatments for controlling risk factors for chronic diseases, but may lead to little or no improvement in utilisation of health services or health outcomes. We did not find a relationship between the design components of P4P and its effectiveness due to the limited number of included studies for subgroup analysis, and the costs and effects of adding P4P to an existing payment method are uncertain. The effects of using P4P without additional resources is also uncertain.
The effects of other payment methods are uncertain due to very low certainty or a lack of evidence.
Implications for research.
The majority of studies included in this review are from high‐income countries, and there is a need for well‐designed research into payment methods for outpatient health facilities in low‐ and middle‐income countries. There is also a need for more well‐designed studies to directly compare or evaluate the effects of differences in the design of P4P and other payment methods. Future research should evaluate the costs of changes in payment methods as well as the effects, since some payment interventions, like P4P, involve more resources for an increase of the payment level and entail administrative costs for performance assessment and management. Current evidence on the efficiency of P4P is scarce and inconclusive (Emmert 2011).
Acknowledgements
This review was funded by the Alliance for Health Policy and Systems Research, World Health Organization and National Natural Science Foundation of China (71403008). Technical support was provided through the Cochrane Effective Practice and Organisation of Care (EPOC) Group Norwegian satellite. Thanks to Marit Johansen for assisting in the design of the search strategy and citation search. Thanks to Jan Odgaard‐Jensen for assisting in data analysis. Particular thanks to Andy Oxman for considerable support at all stages of the review process.
The Norwegian satellite of the EPOC Group receives funding from the Norwegian Agency for Development Cooperation (Norad), via the Norwegian Institute of Public Health to support review authors in the production of their reviews.
This review is a product of the Effective Health Care Research Consortium, which provided funding to make this review open access. The Consortium is funded by UK aid from the UK Government for the benefit of developing countries (Grant: 5242). The views expressed in this review do not necessarily reflect UK government policy.
Appendices
Appendix 1. Search strategies
Cochrane Central Register of Controlled Trials (CENTRAL), Cochrane Library
1: MeSH descriptor: [Capitation Fee] explode all trees or MeSH descriptor: [Fee‐for‐Service Plans] explode all trees or MeSH descriptor: [Prospective Payment System] explode all trees or MeSH descriptor: [Single‐Payer System] explode all trees or MeSH descriptor: [Reimbursement Mechanisms] explode all trees or MeSH descriptor: [Reimbursement, Incentive] explode all trees or MeSH descriptor: [Physician Incentive Plans] explode all trees or MeSH descriptor: [Employee Incentive Plans] explode all trees or MeSH descriptor: [Remuneration] explode all trees or MeSH descriptor: [Prepaid Health Plans] explode all trees or MeSH descriptor: [Managed Care Programs] explode all trees or MeSH descriptor: [Budgets] explode all trees or MeSH descriptor: [Fees and Charges] explode all trees or MeSH descriptor: [Salaries and Fringe Benefits] explode all trees
2: (payment or payout or disbursement:ti,ab,kw and method or methods or system or systems or scheme or schemes:ti,ab,kw) or (pay or paying or payment or payments:ti,ab,kw and advance or prospective or retrospective:ti,ab,kw) or (fixed:ti,ab,kw and pay or paying or payment or payments or amount or amounts or fee or fees or fund or funds:ti,ab,kw) or ("global budget" or "global budgets" or "global payment" or "global payments" or "line item budget" or "line‐item budget" or "line item budgets" or "line‐item budgets" or "budget payment" or "budget payments" or "budgets payment" or "budgets payments":ti,ab,kw) or (capitation or capitated:ti,ab,kw) or ("fee for service" or "fee for services" or "fee‐for‐service" or "fee‐for‐services" or "pay for performance" or p4p or "target payment" or "target payments":ti,ab,kw) or (result or results or performance or output or "out put":ti,ab,kw and pay or paying or payment or payments:ti,ab,kw) or (payment or payments or monetary or economic or financial or reimbursement:ti,ab,kw and incentive or incentives:ti,ab,kw) or ("single payer":ti,ab,kw and system or systems or plan or plans:ti,ab,kw) or ("reimbursement mechanism" or "reimbursement mechanisms" or "case based reimbursement" or "case‐based reimbursement":ti,ab,kw) or (remunerate or remuneration or remunerated or remunerates or remunerating:ti,ab,kw) or ("pre pay" or "pre payment" or "pre payments" or "pre‐pay" or "pre‐payment" or "pre‐payments" or prepay or prepayment or prepaid:ti,ab,kw) or (combined or mixed or bundle or bundled:ti,ab,kw and pay or paying or payment or payments or funding:ti,ab,kw) or (salary or salaries or salaried or wage or wages or "fringe benefit" or "fringe benefits":ti,ab,kw)
3: 1 or 2
4: MeSH descriptor: [Ambulatory Care Facilities] explode all trees or MeSH descriptor: [Community Health Centers] explode all trees or MeSH descriptor: [Substance Abuse Treatment Centers] explode all trees or MeSH descriptor: [Community Mental Health Centers] explode all trees or MeSH descriptor: [Child Guidance Clinics] explode all trees or MeSH descriptor: [Maternal‐Child Health Centers] explode all trees or MeSH descriptor: [Outpatient Clinics, Hospital] explode all trees or MeSH descriptor: [Pain Clinics] explode all trees or MeSH descriptor: [Surgicenters] explode all trees or MeSH descriptor: [Ambulatory Care] explode all trees or MeSH descriptor: [Primary Health Care] explode all trees or MeSH descriptor: [General Practice] explode all trees or MeSH descriptor: [Family Practice] explode all trees or MeSH descriptor: [Community Health Services] explode all trees or MeSH descriptor: [Child Health Services] explode all trees or MeSH descriptor: [Community Mental Health Services] explode all trees or MeSH descriptor: [Community Pharmacy Services] explode all trees or MeSH descriptor: [Family Planning Services] explode all trees or MeSH descriptor: [Maternal Health Services] explode all trees or MeSH descriptor: [Occupational Health Services] explode all trees or MeSH descriptor: [Preventive Health Services] explode all trees or MeSH descriptor: [Dental Health Services] explode all trees or MeSH descriptor: [Public Health] explode all trees or MeSH descriptor: [Public Health Practice] explode all trees or MeSH descriptor: [Public Health Dentistry] explode all trees or MeSH descriptor: [Outpatients] explode all trees or MeSH descriptor: [Health Personnel] explode all trees or MeSH descriptor: [Community Health Workers] explode all trees or MeSH descriptor: [Medical Staff] explode all trees or MeSH descriptor: [Nursing Staff] explode all trees or MeSH descriptor: [Dental Staff] explode all trees or MeSH descriptor: [General Practitioners] explode all trees or MeSH descriptor: [Physicians, Family] explode all trees or MeSH descriptor: [Physicians, Primary Care] explode all trees
5: ("ambulatory care" or "ambulatory health care" or "ambulatory healthcare":ti,ab,kw) or ("primary care" or "primary health care" or "primary healthcare" or "public health":ti,ab,kw) or ("free standing":ti,ab,kw and facility or facilities or clinic or clinics or center or centers or centre or centres:ti,ab,kw) or (community or outpatient or outpatients or "general practice" or "general practices" or "family practice" or "family practices" or "general practitioner" or "general practitioners" or "family practitioner" or "family practitioners" or "family doctor" or "family doctors" or "family physician" or "family physicians":ti,ab,kw)
6: 4 or 5
7: 3 and 6
MEDLINE, OvidSP
#1: Capitation Fee/ or Fee‐for‐Service Plans/ or Prospective Payment System/ or Single‐Payer System/ or Reimbursement Mechanisms/ or Reimbursement, Incentive/ or Physician Incentive Plans/ or Employee Incentive Plans/ or Remuneration/ or Prepaid Health Plans/ or Managed Care Programs/ or Budgets/ or "Fees and Charges"/ or "Salaries and Fringe Benefits"/ or ((payment or payout or disbursement) and (method? or system? or scheme?)).ti. or ((payment or payout or disbursement) adj3 (method? or system? or scheme?)).ab. or (pay* and (advance or prospect* or retrospect*)).ti. or (pay* adj3 (advance or prospect* or retrospect*)).ab. or (fixed and (pay* or amount? or fee or fees or fund*)).ti. or (fixed adj3 (pay* or amount? or fee or fees or fund*)).ab. or (global budget* or global payment? or line item budget* or budget* payment?).ti,ab. or (capitation or capitated).ti,ab. or (fee for service? or pay for performance or p4p or target pay*).ti,ab. or ((result* or performance or output or out put) and pay*).ti. or ((result* or performance or output or out put) adj3 pay*).ab. or ((payment? or monetary or economic or financial or reimbursement) and incentive?).ti. or ((payment? or monetary or economic or financial or reimbursement) adj3 incentive?).ab. or (single payer and (system? or plan?)).ti. or (single payer adj3 (system? or plan?)).ab. or (reimbursement mechanism? or case based reimbursement).ti,ab. or remunerat*.ti,ab. or (pre pay* or prepay* or prepaid).ti,ab. or ((combined or mixed or bundle*) and (pay* or funding?)).ti. or ((combined or mixed or bundle*) adj3 (pay* or funding?)).ab. or (salary or salaries or salaried or wage or wages or fringe benefit?).ti,ab. #2: ambulatory care facilities/ or community health centers/ or substance abuse treatment centers/ or community mental health centers/ or child guidance clinics/ or maternal‐child health centers/ or outpatient clinics, hospital/ or pain clinics/ or surgicenters/ or Ambulatory Care/ or Primary Health Care/ or General Practice/ or Family Practice/ or ommunity health services/ or child health services/ or community mental health services/ or community pharmacy services/ or family planning services/ or exp maternal health services/ or occupational health services/ or preventive health services/ or Dental Health Services/ or Public Health/ or Public Health Practice/ or Public Health Nursing/ or Public Health Dentistry/ or Outpatients/ or Health Personnel/ or Community Health Workers/ or Medical Staff/ or Nursing Staff/ or Dental Staff/ or General Practitioners/ or Physicians, Family/ or Physicians, Primary Care/ or (ambulatory care or ambulatory health care or ambulatory healthcare).ti,ab. or (primary care or primary health care or primary healthcare).ti,ab. or public health*.ti,ab. or (free standing adj (facility or facilities or clinic? or center? or centre?)).ti,ab. or community.ti,ab. or outpatient?.ti,ab. or (general practice? or family practice?).ti,ab. or (general practitioner? or family practitioner? or family doctor? or family physician?).ti,ab. #3: randomized controlled trial.pt. or controlled clinical trial.pt. or multicenter study.pt. or (randomis* or randomiz* or randomly).ti,ab. or groups.ab. or (trial or multicenter or multi center or multicentre or multi centre).ti. or (controlled or control group? or (before adj5 after) or (pre adj5 post) or ((pretest or pre test) and (posttest or post test)) or quasiexperiment* or quasi experiment* or evaluat* or time series or time point? or repeated measur*).ti,ab. or (intervention? or effect? or impact?).ti. #4: (exp Animals/ not (exp Animals/ and Humans/)) or (review or meta analysis or news or comment or editorial).pt. or cochrane database of systematic reviews.jn. or comment on.cm. or (systematic review or literature review).ti. #5: #1 and #2
#6: #3 not #4
#7: #5 and #6
PubMed, NCBI
#1 Search (((((((((((((((((Salaries and Fringe Benefits[MH])) OR (wage[TIAB] OR wages[TIAB] OR salary[TIAB] OR Salaries[TIAB] OR Salaried[TIAB] OR "fringe benefit"[TIAB] OR "fringe benefits"[TIAB])) OR Budgets[MH]) OR ("global budget"[TIAB] OR "global budgets"[TIAB] OR "line item budgets"[TIAB] OR "line‐item budgets"[TIAB])) OR Capitation fee[MH]) OR capitation[TIAB]) OR ("fee for service"[TIAB] OR "fee for services"[TIAB] OR fee‐for‐service[TIAB])) OR "case‐based reimbursement"[TIAB]) OR (Prospective Payment System[MH] OR "Prospective Payment System"[TIAB] OR "Retrospective Payment Systems"[TIAB])) OR (Single‐Payer System[MH] OR "single payer"[TIAB])) OR (Reimbursement Mechanisms[MH] OR "Reimbursement Mechanisms"[TIAB])) OR Reimbursement, Incentive[MH]) OR ("pay for performance"[TIAB] OR p4p[TIAB])) OR (Physician Incentive Plans[MH] OR "Physician Incentive Plans"[TIAB] OR "Physician Incentive Plan"[TIAB])) OR (Employee Incentive Plans[MH] OR "Employee Incentive Plans"[TIAB]OR "Employee Incentive Plan"[TIAB])) OR (Remuneration[MH] OR Remuneration[TIAB] OR Remunerations[TIAB])) OR "Mixed payment systems"[TIAB]
#2 Search (((((((((((((((("Outpatient clinics" [TIAB] OR "outpatient clinic" [TIAB])) OR ("Urgent care centers" [TIAB] OR "urgent care center" [TIAB] OR "urgent care clinics" [TIAB] OR "urgent care clinic"[TIAB])) OR ("Family planning centers" [TIAB] OR "family planning center"[TIAB])) OR ("Ambulatory health centers"[TIAB] OR "ambulatory health center"[TIAB])) OR ("Abortion centers"[TIAB OR "abortion center"[TIAB])) OR ("Abortion clinics"[TIAB] OR "abortion clinic"[TIAB])) OR ("Hospital outpatient clinics" [TIAB] OR "hospital outpatient clinic" [TIAB])) OR ("Community health centers"[MH] OR "community health center"[TIAB] OR "community health centers"[TIAB])) OR ("Dental clinics"[MH] OR "dental clinic"[TIAB] OR "dental clinics"[TIAB])) OR (Substance abuse treatment centers[MH] OR "Substance abuse treatment centers" [TIAB] OR "Substance abuse treatment center" [TIAB])) OR (Community mental health centers[MH] OR Community mental health centers[TIAB] OR Community mental health center[TIAB])) OR (Community mental health centers[MH] OR "Community mental health centers" [TIAB] OR "Community mental health center"[TIAB])) OR (Child guidance clinics[MH] OR "Child guidance clinics"[TIAB] OR "Child guidance clinic"[TIAB])) OR (Maternal‐child health centers[MH] OR "Maternal‐child health centers"[TIAB] OR "Maternal‐child health center"[TIAB])) OR (Pain clinics[MH] OR "Pain clinics"[TIAB] OR "Pain clinic"[TIAB])) OR (Surgicenters[MH] OR Surgicenters[TIAB] OR Surgicenter[TIAB])
#3 Search (((((((((((((((((Health personnel[MH]) OR ("Health professionals" [TIAB] OR "health professional" [TIAB])) OR ("Health care providers" [TIAB] OR "health care provider" [TIAB] OR "Healthcare providers" [TIAB] OR "healthcare provider" [TIAB])) OR Paramedical personnel[TIAB]) OR "Paramedical personnel" [TIAB]) OR "Allied Health Personnel"[MH]) OR Physicians[MH]) OR ("Health workers"[TIAB] OR "health worker"[TIAB])) OR (General practitioners[MH] OR "general practitioner"[TIAB] OR "general practitioners"[TIAB])) OR Nurses[MH] OR ("Emergency medical technicians"[MH] OR "Emergency medical technicians"[TIAB] OR "Emergency medical technician"[TIAB])) OR ("Operating room technicians"[MH] OR "Operating room technicians"[TIAB] OR "Operating room technician"[TIAB])) OR (Pharmacists aides[MH] OR "Pharmacists aides"[TIAB])) OR ("Physical therapist assistants"[MH] OR "Physical therapist assistant"[TIAB] OR "Physical therapist assistants"[TIAB])) OR ("Dental Staff"[Mesh] OR dentist[TIAB] OR dentists[TIAB])) OR ("Pharmacists"[Mesh] OR Pharmacists[TIAB] OR Pharmacist[TIAB])) OR ("Medical Staff"[Mesh] OR "Medical Staff"[TIAB] OR "Medical Staffs"[TIAB])) OR ("Caregivers"[Mesh] OR Caregivers[TIAB] OR Caregiver[TIAB])
#4 #2 OR #3
#5 #1 AND #4
#6 Search letter[PT] OR news[PT] OR comment[PT] OR editorial[PT] OR bibliography[PT] OR resource guides[PT]
#7 #5 NOT #6
#8 Search randomized controlled trial[PT] OR random*[TIAB] OR intervention*[TIAB] OR control[TIAB] OR controll[TIAB] OR controls[TIAB] OR controlls[TIAB] OR controles[TIAB] OR controlles[TIAB] OR controled[TIAB] OR controlled[TIAB] OR controld[TIAB] OR controlld[TIAB] OR evaluat*[TIAB]
#9 Search “Animals”[MH] NOT (“Animals”[MH] AND “Humans”[MH])
#10 #8 NOT #9
#11 #7 AND #10
Embase, OvidSP
#1: exp capitation fee/ or exp prospective payment/ or exp reimbursement/ or exp remuneration/ or exp budget/ or exp physician income/ or exp salary/ or ((payment or payout or disbursement) and (method? or system? or scheme?)).ti. or ((payment or payout or disbursement) adj3 (method? or system? or scheme?)).ab. or (pay* and (advance or prospect* or retrospect*)).ti. or (pay* adj3 (advance or prospect* or retrospect*)).ab. or (fixed and (pay* or amount? or fee or fees or fund*)).ti. or (fixed adj3 (pay* or amount? or fee or fees or fund*)).ab. or (global budget* or global payment? or line item budget* or budget* payment?).ti,ab. Or (capitation or capitated).ti,ab. or (fee for service? or pay for performance or p4p or target pay*).ti,ab. or ((result* or performance or output or out put) and pay*).ti. or ((result* or performance or output or out put) adj3 pay*).ab. or ((payment? or monetary or economic or financial or reimbursement) and incentive?).ti. or ((payment? or monetary or economic or financial or reimbursement) adj3 incentive?).ab. or (single payer and (system? or plan?)).ti. or (single payer adj3 (system? or plan?)).ab. or (reimbursement mechanism? or case based reimbursement).ti,ab. or remunerat*.ti,ab. or (pre pay* or prepay* or prepaid).ti,ab. or ((combined or mixed or bundle*) and (pay* or funding?)).ti. or ((combined or mixed or bundle*) adj3 (pay* or funding?)).ab. or (salary or salaries or salaried or wage or wages or fringe benefit?).ti,ab.
#2: exp outpatient department/ or exp health center/ or exp community mental health center/ or exp ambulatory care/ or exp primary health care/ or exp general practice/ or exp community care/ or exp child health care/ or exp mental health service/ or exp preventive health service/ or exp public health/ or exp public health service/ or exp outpatient/ or exp dentist/ or exp general practitioner/ or *health care personnel/ or (ambulatory care or ambulatory health care or ambulatory healthcare).ti,ab. or (primary care or primary health care or primary healthcare).ti,ab. or public health*.ti,ab. or (free standing adj (facility or facilities or clinic? or center? or centre?)).ti,ab. or community.ti,ab. or outpatient?.ti,ab. or (general practice? or family practice?).ti,ab. or (general practitioner? or family practitioner? or family doctor? or family physician?).ti,ab.
#3: exp randomized controlled trial/ or exp controlled clinical trial/ or exp multicenter study/ or (randomis* or randomiz* or randomly).ti,ab. or groups.ab. or (trial or multicenter or multi center or multicentre or multi centre).ti. or (controlled or control group? or (before adj5 after) or (pre adj5 post) or ((pretest or pre test) and (posttest or post test)) or quasiexperiment* or quasi experiment* or evaluat* or time series or time point? or repeated measur*).ti,ab. or (intervention? or effect? or impact?).ti.
#4: exp "review"/ or exp meta analysis/ or (systematic review or literature review).ti. or (news or comment or editorial).pt. or cochrane database of systematic reviews.jn.
#5: #1 and #2
#6: #3 not #4
#7: #5 and #6
Dissertations and Theses Database, ProQuest
#1 Search ti(wage OR wages OR salary OR salaries OR salaried OR "fringe benefit" OR "fringe benefits" OR "global budget" OR "global budgets" OR "line item budgets" OR "line‐item budgets" OR capitation OR "fee for service" OR "fee for services" OR fee‐for‐service OR "case‐based reimbursement" OR "prospective payment system" OR "retrospective payment system" OR "single payer" OR "reimbursement mechanisms" OR "reimbursement mechanism" OR "incentive reimbursements" OR "incentive reimbursement" OR "pay for performance" OR p4p OR "physician incentive plans" OR "physician incentive plan" OR "employee incentive plans" OR "employee incentive plan" OR remuneration OR remunerations OR " mixed payment systems") OR ab(wage OR wages OR salary OR salaries OR salaried OR "fringe benefit" OR "fringe benefits" OR "global budget" OR "global budgets" OR "line item budgets" OR "line‐item budgets" OR capitation OR "fee for service" OR "fee for services" OR fee‐for‐service OR "case‐based reimbursement" OR "prospective payment system" OR "retrospective payment system" OR "single payer" OR "reimbursement mechanisms" OR "reimbursement mechanism" OR "incentive reimbursements" OR "incentive reimbursement" OR "pay for performance" OR p4p OR "physician incentive plans" OR "physician incentive plan" OR "employee incentive plans" OR "employee incentive plan" OR remuneration OR remunerations OR " mixed payment systems")
#2 ti("outpatient clinics" OR "outpatient clinic" "urgent care centers" OR "urgent care center" OR "urgent care clinics" OR "urgent care clinic" OR "family planning centers" OR "family planning center" OR "ambulatory health centers" OR "ambulatory health center" OR "abortion centers" OR "abortion center" OR "abortion clinics" OR "abortion clinic" OR" hospital outpatient clinics" OR "hospital outpatient clinic" OR" community health center" OR "community health centers" OR "dental clinic" OR "dental clinics" OR "substance abuse treatment centers" OR "substance abuse treatment center" OR "community mental health centers" OR "community mental health center" OR "child guidance clinics" OR "child guidance clinic" OR "maternal‐child health centers" OR "maternal‐child health center" OR "pain clinics" OR "pain clinic" OR surgicenters OR surgicenter) OR ab("outpatient clinics" OR "outpatient clinic" "urgent care centers" OR "urgent care center" OR "urgent care clinics" OR "urgent care clinic" OR "family planning centers" OR "family planning center" OR "ambulatory health centers" OR "ambulatory health center" OR "abortion centers" OR "abortion center" OR "abortion clinics" OR "abortion clinic" OR" hospital outpatient clinics" OR "hospital outpatient clinic" OR" community health center" OR "community health centers" OR "dental clinic" OR "dental clinics" OR "substance abuse treatment centers" OR "substance abuse treatment center" OR "community mental health centers" OR "community mental health center" OR "child guidance clinics" OR "child guidance clinic" OR "maternal‐child health centers" OR "maternal‐child health center" OR "pain clinics" OR "pain clinic" OR surgicenters OR surgicenter)
#3 ti("health professionals" OR "health professional" OR" health care providers" OR "health care provider" OR "healthcare providers" OR "healthcare provider" OR" paramedical personnel" OR "allied health personnel" OR physicians OR "health workers" OR "health worker" OR "general practitioner" OR "general practitioners" OR nurse OR nurses OR "emergency medical technicians" OR "emergency medical technician" OR "operating room technicians" OR "operating room technician" OR "pharmacists aides" OR "physical therapist assistant" OR "physical therapist assistants" OR dentist OR dentists OR pharmacists OR pharmacist OR "medical staff" OR "medical staffs" OR caregivers OR caregiver) OR ab("health professionals" OR "health professional" OR" health care providers" OR "health care provider" OR "healthcare providers" OR "healthcare provider" OR" paramedical personnel" OR "allied health personnel" OR physicians OR "health workers" OR "health worker" OR "general practitioner" OR "general practitioners" OR nurse OR nurses OR "emergency medical technicians" OR "emergency medical technician" OR "operating room technicians" OR "operating room technician" OR "pharmacists aides" OR "physical therapist assistant" OR "physical therapist assistants" OR dentist OR dentists OR pharmacists OR pharmacist OR "medical staff" OR "medical staffs" OR caregivers OR caregiver)
#4 #2 OR #3
#5 #1 AND #4
Conference Proceedings Citation Index, ISI Web of Science
| Step | Search items | Results |
| #1 | TS= (wage OR wages OR salary OR salaries OR salaried OR "fringe benefit" OR "fringe benefits" OR "global budget" OR "global budgets" OR "line item budgets" OR "line‐item budgets" OR capitation OR "fee for service" OR "fee for services" OR fee‐for‐service OR "case‐based reimbursement" OR "prospective payment system" OR "retrospective payment system" OR "single payer" OR "reimbursement mechanisms" OR "reimbursement mechanism" OR "incentive reimbursements" OR "incentive reimbursement" OR "pay for performance" OR p4p OR "physician incentive plans" OR "physician incentive plan" OR "employee incentive plans" OR "employee incentive plan" OR remuneration OR remunerations OR "mixed payment systems") | 81850 |
| #2 | TS= ("outpatient clinics" OR "outpatient clinic" OR "urgent care centers" OR "urgent care center" OR "urgent care clinics" OR "urgent care clinic" OR "family planning centers" OR "family planning center" OR "ambulatory health centers" OR "ambulatory health center” OR "Abortion centers" OR "abortion center" OR "Abortion clinics" OR "abortion clinic" OR "Hospital outpatient clinics" OR "hospital outpatient clinic" OR "community health center" OR "community health centers" OR "dental clinic" OR "dental clinics" OR "substance abuse treatment centers" OR "Substance abuse treatment center" OR "community mental health centers" OR "community mental health center" OR "child guidance clinics" OR "child guidance clinic" OR "maternal‐child health centers" OR "maternal‐child health center" OR "pain clinics" OR "pain clinic" OR surgicenters OR surgicenter) | 79526 |
| #3 | TS= ("health professionals" OR "health professional" OR "health care providers" OR "health care provider" OR "healthcare providers" OR "healthcare provider" OR "paramedical personnel" OR "allied Health personnel" OR physicians OR "health workers" OR "health worker" OR "general practitioner" OR "general practitioners" OR nurse OR nurses OR "emergency medical technicians" OR "emergency medical technician" OR "operating room technicians" OR "operating room technician" OR Pharmacists aides OR "physical therapist assistants" OR "physical therapist assistant" OR "physical therapist assistants" OR "dental staff" OR dentist OR dentists OR pharmacists OR pharmacist OR "medical staff" OR "medical staffs" OR caregivers OR caregiver) | 1632788 |
| #4 | #2 OR #3 | 1695022 |
| #5 | #1 AND #4 | 24970 |
| #6 | #5 NOT (letter[PT] OR news[PT] OR editorial[PT] OR bibliography[PT] ) | 19509 |
IDEAS (Research Papers in Economics)
("payment method" | "payment methods" |"payment system" | "payment mechanism" |"global budget" | "line‐item budget" | capitation | "fee for service" | "fee for services" | "fee‐for‐service" | "fee‐for‐services" | "pay for performance" | p4p | "pay‐for‐performance" | "performance‐related pay" | "performance‐related payment" | "payment for performance" | "performance based payment" | "performance‐based payment" | salary) + (ambulatory | primary | public | child | maternal | mental | preventive | "community health" | dental | clinics | outpatient | outpatients | physician | physicians | doctor | doctors | nurse | nurses | dentists | dentist)
EconLit
((ti(payment OR payout OR disbursement) AND ti(method* OR system* OR scheme*)) OR (AB(payment OR payout OR disbursement) NEAR/4 AB(method* OR system* OR scheme*)) OR (ti(pay*) AND ti(advance OR prospect* OR retrospect*)) OR (AB(pay*) NEAR/4 AB(advance OR prospect* OR retrospect*)) OR (ti(fixed) AND ti(pay* OR amount* OR fee OR fees OR fund*)) OR (AB(fixed) NEAR/4 AB(pay* OR amount* OR fee OR fees OR fund*)) OR (ti("global budget" OR "global budgets" OR "global payment" OR "global payments" OR "line‐item budget" OR "line‐item budgets" OR "budget payment" OR "budget payments") OR ab("global budget" OR "global budgets" OR "global payment" OR "global payments" OR "line‐item budget" OR "line‐item budgets" OR "budget payment" OR "budget payments")) OR (ti(capitation OR capitated) OR ab(capitation OR capitated)) OR (ti("fee for service" OR "fee for services" OR "pay for performance" OR p4p OR "target pay" OR "target payment" OR "target payments") OR ab("fee for service" OR "fee for services" OR "pay for performance" OR p4p OR "target pay" OR "target payment" OR "target payments")) OR (ti(result* OR performance OR output OR out‐put) AND ti(pay* OR financing)) OR (AB(result* OR performance OR output OR out‐put) NEAR/4 AB(pay* OR financing)) OR (ti(payment* OR monetary OR economic OR financial OR reimbursement) AND ti(incentive*)) OR (AB(payment* OR monetary OR economic OR financial OR reimbursement) NEAR/4 AB(incentive*)) OR (ti("single payer") AND ti(system* OR plan*)) OR (AB("single payer") NEAR/4 AB(system* OR plan*)) OR (ti(reimbursement OR "case based" OR case‐based) AND ti(mechanism* OR pay*)) OR (AB(reimbursement OR "case based" OR case‐based) NEAR/4 AB(mechanism* OR pay*)) OR (ti(remuneration OR remunerate OR remunerates OR remunerating OR prepay* OR "pre‐payment" OR prepaid) OR ab(remuneration OR remunerate OR remunerates OR remunerating OR prepay* OR "pre‐payment" OR prepaid)) OR (ti(combined OR mixed OR bundle*) AND ti(pay* OR funding*)) OR (AB(combined OR mixed OR bundle*) NEAR/4 AB(pay* OR funding*)) OR (ti(salary OR salaries OR salaried OR wage OR wages OR "fringe benefit" OR "fringe benefits") OR ab(salary OR salaries OR salaried OR wage OR wages OR "fringe benefit" OR "fringe benefits"))) AND ((ti("ambulatory care" OR "ambulatory health care" OR "ambulatory healthcare") OR ab("ambulatory care" OR "ambulatory health care" OR "ambulatory healthcare")) OR (ti("primary care" OR "primary health care" OR "primary healthcare") OR ab("primary care" OR "primary health care" OR "primary healthcare")) OR (ti("public health" OR "public healthcare") OR ab("public health" OR "public healthcare")) OR (ti("child health" OR "maternal health" OR "mental health" OR "family planning" OR abortion OR preventive OR dental OR "free standing") AND ti(service* OR facility OR facilities OR clinic* OR center* OR centre*)) OR (ab("child health" OR "maternal health" OR "mental health" OR "family planning" OR abortion OR preventive OR dental OR "free standing") NEAR ab(service* OR facility OR facilities OR clinic* OR center* OR centre*)) OR (ti(community) AND ti(health OR "health care" OR healthcare)) OR (ab(community) NEAR ab(health OR "health care" OR healthcare)) OR (ti(outpatient or outpatients) OR ab(outpatient or outpatients)) OR (ti("general practice" OR "general practices" OR "family practice" OR "family practices") OR ab("general practice" OR "general practices" OR "family practice" OR "family practices")) OR (ti("general practitioner" OR "general practitioners" OR "family practitioner" OR "family practitioners") OR ab("general practitioner" OR "general practitioners" OR "family practitioner" OR "family practitioners")) OR (ti("family planning" OR preventive OR dental) AND ti(service* OR facility OR facilities OR clinic* OR center* OR centre*)) OR (ab("family planning" OR preventive OR dental) NEAR ab(service* OR facility OR facilities OR clinic* OR center* OR centre*)) OR (ti("medical staff" OR physician OR physicians OR "family planning personnel" OR "family planning worker" OR "family planning workers" OR "doctor" OR "doctors" OR nurse OR nurses OR "nursing staff" OR "dental staff" OR dentist*) OR ab("medical staff" OR physician OR physicians OR "family planning personnel" OR "family planning worker" OR "family planning workers" OR "doctor" OR "doctors" OR nurse OR nurses OR "nursing staff" OR "dental staff" OR dentist*)) OR (ti(health OR healthcare OR "health care") AND ti(provider* OR worker* OR professional*)) OR (ab(health OR healthcare OR "health care") NEAR ab(provider* OR worker* OR professional*)))
Popline (Population Information Online)
(wage OR wages OR salary OR salaries OR salaried OR "fringe benefit" OR "fringe benefits" OR "global budget" OR "global budgets" OR "line item budgets" OR "line‐item budgets" OR capitation OR "fee for service" OR "fee for services" OR fee‐for‐service OR "case‐based reimbursement" OR "prospective payment system" OR "retrospective payment system" OR "single payer" OR "reimbursement mechanisms" OR "reimbursement mechanism" OR "incentive reimbursements" OR "incentive reimbursement" OR "pay for performance" OR p4p OR "physician incentive plans" OR "physician incentive plan" OR "employee incentive plans" OR "employee incentive plan" OR remuneration OR remunerations OR " mixed payment systems") AND (("outpatient clinics" OR "outpatient clinic" "urgent care centers" OR "urgent care center" "urgent care clinics" OR "urgent care clinic" OR "family planning centers" OR "family planning center" OR "ambulatory health centers" OR "ambulatory health center" OR "abortion centers" OR "abortion center" OR "abortion clinics" OR "abortion clinic" OR" hospital outpatient clinics" OR "hospital outpatient clinic" OR" community health center" OR "community health centers" OR "dental clinic" OR "dental clinics" OR "substance abuse treatment centers" OR "substance abuse treatment center" OR "community mental health centers" OR "community mental health center" OR "child guidance clinics" OR "child guidance clinic" OR "maternal‐child health centers" OR "maternal‐child health center" OR "pain clinics" OR "pain clinic" OR surgicenters OR surgicenter)OR ("health professionals" OR "health professional" OR" health care providers" OR "health care provider" OR "healthcare providers" OR "healthcare provider" OR" paramedical personnel" OR "allied health personnel" OR physicians OR "health workers" OR "health worker" OR "general practitioner" OR "general practitioners" OR nurse OR nurses OR "emergency medical technicians" OR "emergency medical technician" OR "operating room technicians" OR "operating room technician" OR "pharmacists aides" OR "physical therapist assistant" OR "physical therapist assistants" OR dentist OR dentists OR pharmacists OR pharmacist OR "medical staff" OR "medical staffs" OR caregivers OR caregiver))
Chinese Medicine Premier (Wanfang Data)
(主题=支付方式+支付制度+支付体系+支付方法+预付+后付+总额预算+总额预付+条目预算+按人头+按项目支付+绩效支付+病种支付+病历支付+酬劳+补偿+绩效工资+工资制) AND (主题=门诊+公共卫生+妇幼+儿童+孕妇+产妇+孕产妇+计划生育+口腔+牙科+精神卫生+基层+初级卫生保健+初级卫生服务+社区+全科+家庭医生+家庭医师+家庭医疗+预防+医生+医师+护士+牙医+卫生工作人员+卫生工作者+医疗工作人员+医疗工作者)
China National Knowledge Infrastructure (CHKD‐CNKI)(1915 to 05/04/2015, 2179 retrieved, 0 relevant being kept; 619 retrieved at 08/03/2016 but 0 relevant being kept)
1: (主题=支付方式+支付制度+支付体系+支付方法+预付+后付+总额预算+总额预付+条目预算+按人头+按项目支付+绩效支付+病种支付+病历支付+酬劳+补偿+绩效工资+工资制) AND (主题=门诊+公共卫生+妇幼+儿童+孕妇+产妇+孕产妇+计划生育+口腔+牙科+精神卫生+基层+初级卫生保健+初级卫生服务+社区+全科+家庭医生+家庭医师+家庭医疗+预防+医生+医师+护士+牙医+卫生工作人员+卫生工作者+医疗工作人员+医疗工作者) AND (主题=评价+干预) 1732
2: (主题=支付方式+支付制度+支付体系+支付方法+预付+后付+总额预算+总额预付+条目预算+按人头+按项目支付+绩效支付+病种支付+病历支付+酬劳+补偿+绩效工资+工资制) AND (主题=门诊+公共卫生+妇幼+儿童+孕妇+产妇+孕产妇+计划生育+口腔+牙科+精神卫生+基层+初级卫生保健+初级卫生服务+社区+全科+家庭医生+家庭医师+家庭医疗+预防+医生+医师+护士+牙医+卫生工作人员+卫生工作者+医疗工作人员+医疗工作者) AND (主题=试验+准试验) 211
3: (主题=支付方式+支付制度+支付体系+支付方法+预付+后付+总额预算+总额预付+条目预算+按人头+按项目支付+绩效支付+病种支付+病历支付+酬劳+补偿+绩效工资+工资制) AND (主题=门诊+公共卫生+妇幼+儿童+孕妇+产妇+孕产妇+计划生育+口腔+牙科+精神卫生+基层+初级卫生保健+初级卫生服务+社区+全科+家庭医生+家庭医师+家庭医疗+预防+医生+医师+护士+牙医+卫生工作人员+卫生工作者+医疗工作人员+医疗工作者) AND (主题=对照+时间序列) 236
4: 1 OR 2 OR 3
OpenGrey
("payment method" OR "payment methods" OR"payment system" OR "payment mechanism" OR"global budget" OR "line‐item budget" OR capitation OR "fee for service" OR "fee for services" OR "fee‐for‐service" OR "fee‐for‐services" OR "pay for performance" OR p4p OR "pay‐for‐performance" OR "performance‐related pay" OR "performance‐related payment" OR "payment for performance" OR "performance based payment" OR "performance‐based payment" OR salary) AND (ambulatory OR primary OR public OR child OR maternal OR mental OR preventive OR "community health" OR dental OR clinics OR outpatient OR outpatients OR physician OR physicians OR doctor OR doctors OR nurse OR nurses OR dentists OR dentist)
International Clinical Trials Registry Platform (ICTRP), WHO
payment
ClinicalTrials.gov
| No | Search Strategy |
| #1 | (salary OR wage OR salaried OR "fringe benefits" OR budgets OR "line item budgets" OR capitation) AND ("outpatient clinic" OR "urgent care center" OR "urgent care clinic" OR "family planning center") |
| #2 | (salary OR wage OR salaried OR "fringe benefits" OR budgets OR "line item budgets" OR capitation) AND ("ambulatory health center" OR "abortion center" OR "hospital outpatient clinic" OR "community health center" OR "dental clinic") |
| #3 | (salary OR wage OR salaried OR "fringe benefits" OR budgets OR "line item budgets" OR capitation) AND ("substance abuse treatment center" OR "community mental health center" OR "child guidance clinic" OR "pain clinic" OR surgicenter) |
| #4 | (salary OR wage OR salaried OR "fringe benefits" OR budgets OR "line item budgets" OR capitation) AND ("health personnel" OR "health professional" OR "health care provider" OR "healthcare provider") |
| #5 | (salary OR wage OR salaried OR "fringe benefits" OR budgets OR "line item budgets" OR capitation) AND ("paramedical personnel" OR "allied health personnel" OR "physicians" OR "health worker" OR "general practitioner" OR "nurses") |
| #6 | (salary OR wage OR salaried OR "fringe benefits" OR budgets OR "line item budgets" OR capitation) AND ("emergency medical technician" OR "physical therapist assistant" OR "dental staff" OR dentist OR pharmacist OR "medical staff" OR "caregiver") |
| #7 | ("fee‐for‐services plan" OR "fee for service" OR "fee‐for‐service" OR "prospective payment system" OR reimbursement mechanism) AND ("outpatient clinic" OR "urgent care center" OR "urgent care clinic" OR "family planning center") |
| #8 | ("fee‐for‐services plan" OR "fee for service" OR "prospective payment system" OR reimbursement mechanism) AND ("ambulatory health center" OR "abortion center" OR "hospital outpatient clinic" OR "community health center" OR "dental clinic") |
| #9 | ("fee‐for‐services plan" OR "fee for service" OR "prospective payment system" OR reimbursement mechanism) AND ("substance abuse treatment center" OR "community mental health center" OR "child guidance clinic" OR "pain clinic" OR surgicenter) |
| #10 | ("fee‐for‐services plan" OR "fee for service" OR "prospective payment system" OR reimbursement mechanism) AND ("health personnel" OR "health professional" OR "health care provider" OR "healthcare provider") |
| #11 | ("fee‐for‐services plan" OR "fee for service" OR "prospective payment system" OR reimbursement mechanism) AND ("paramedical personnel" OR "allied health personnel" OR "physicians" OR "health worker" OR "general practitioner" OR "nurses") |
| #12 | ("fee‐for‐services plan" OR "fee for service" OR "prospective payment system" OR reimbursement mechanism) AND ("emergency medical technician" OR "physical therapist assistant" OR "dental staff" OR dentist) |
| #13 | ("fee‐for‐services plan" OR "fee for service" OR "prospective payment system" OR reimbursement mechanism) AND (pharmacist OR "medical staff" OR "caregiver") |
| #14 | ("reimbursement, incentive" OR incentive reimbursement OR incentive reimbursements OR "pay for performance" ) AND ("outpatient clinic" OR "urgent care center" OR "urgent care clinic" OR "family planning center") |
| #15 | ("reimbursement, incentive" OR incentive reimbursement OR incentive reimbursements OR "pay for performance") AND ("ambulatory health center" OR "abortion center" OR "hospital outpatient clinic" OR "community health center" OR "dental clinic") |
| #16 | ("reimbursement, incentive" OR incentive reimbursement OR incentive reimbursements OR "pay for performance") AND ("substance abuse treatment center" OR "community mental health center" OR "child guidance clinic" OR "pain clinic" OR surgicenter) |
| #17 | ("reimbursement, incentive" OR incentive reimbursement OR incentive reimbursements OR "pay for performance") AND ("health personnel" OR "health professional" OR "health care provider" OR "healthcare provider") |
| #18 | ("reimbursement, incentive" OR incentive reimbursement OR incentive reimbursements OR "pay for performance") AND ("paramedical personnel" OR "allied health personnel" OR "physicians" OR "health worker" OR "general practitioner" OR "nurses") |
| #19 | ("reimbursement, incentive" OR incentive reimbursement OR incentive reimbursements OR "pay for performance") AND ("emergency medical technician" OR "physical therapist assistant" OR "dental staff" OR dentist) |
| #20 | ("reimbursement, incentive" OR incentive reimbursement OR incentive reimbursements OR "pay for performance") AND (pharmacist OR "medical staff" OR "caregiver") |
| #21 | (p4p OR "physician incentive plans" OR physician incentive plan OR employee incentive plans OR remuneration OR mixed payment systems) AND ("outpatient clinic" OR "urgent care center" OR "urgent care clinic" OR "family planning center") |
| #22 | (p4p OR "physician incentive plans" OR physician incentive plan OR employee incentive plans OR remuneration OR mixed payment systems) AND ("ambulatory health center" OR "abortion center" OR "hospital outpatient clinic" OR "community health center" OR "dental clinic") |
| #23 | (p4p OR "physician incentive plans" OR physician incentive plan OR employee incentive plans OR remuneration OR mixed payment systems) AND ("substance abuse treatment center" OR "community mental health center" OR "child guidance clinic" OR "pain clinic" OR surgicenter) |
| #24 | (p4p OR "physician incentive plans" OR physician incentive plan OR employee incentive plans OR remuneration OR mixed payment systems) AND ("health personnel" OR "health professional" OR "health care provider" OR "healthcare provider") |
| #25 | (p4p OR "physician incentive plans" OR physician incentive plan OR employee incentive plans OR remuneration OR mixed payment systems) AND ("paramedical personnel" OR "allied health personnel" OR "physicians" OR "health worker" OR "general practitioner" OR "nurses") |
| #26 | (p4p OR "physician incentive plans" OR physician incentive plan OR employee incentive plans OR remuneration OR mixed payment systems) AND ("emergency medical technician" OR "physical therapist assistant" OR "dental staff" OR dentist OR pharmacist OR "medical staff" OR "caregiver") |
WHO website
支付方式 OR 支付制度 OR 支付体系 OR 支付方法 OR 预付 OR 后付 OR 总额预算 OR 总额预付 OR 条目预算 OR 按人头 OR 按项目支付 OR 绩效支付 OR 病种支付 OR 病历支付 OR 酬劳 OR 补偿 OR 绩效工资 OR 工资制
World Bank website
payment method, primary care
Data and analyses
Comparison 1. Effects of P4P on outpatient health facilities' performance: dichotomous provision outcomes.
| Outcome or subgroup title | No. of studies | No. of participants | Statistical method | Effect size |
|---|---|---|---|---|
| 1 Service provision outcomes | 3 | Risk Ratio (Random, 95% CI) | 1.08 [1.03, 1.14] | |
| 1.1 Process outcomes of Bardach 2013 | 1 | Risk Ratio (Random, 95% CI) | 1.13 [1.03, 1.23] | |
| 1.2 Process outcomes of Petersen 2013 | 1 | Risk Ratio (Random, 95% CI) | 1.01 [0.92, 1.11] | |
| 1.3 Process outcomes of Basinga 2011 | 1 | Risk Ratio (Random, 95% CI) | 1.08 [1.00, 1.17] |
Comparison 2. Effects of P4P on outpatient health facilities' performance: dichotomous patients' utilisation outcomes.
| Outcome or subgroup title | No. of studies | No. of participants | Statistical method | Effect size |
|---|---|---|---|---|
| 1 Patients' utilisation outcomes | 2 | Risk Ratio (Random, 95% CI) | 1.11 [1.02, 1.22] | |
| 1.1 Utilisation outcomes of Basinga 2011 | 1 | Risk Ratio (Random, 95% CI) | 1.23 [0.99, 1.52] | |
| 1.2 Utilisation outcomes of Engineer 2016 | 1 | Risk Ratio (Random, 95% CI) | 0.96 [0.92, 1.00] |
Comparison 3. Effects of P4P on outpatient health facilities' performance: dichotomous patients' health outcomes.
| Outcome or subgroup title | No. of studies | No. of participants | Statistical method | Effect size |
|---|---|---|---|---|
| 1 Patients' health outcomes | 1 | Risk Ratio (Fixed, 95% CI) | 1.01 [0.98, 1.04] | |
| 1.1 Health outcomes of Bardach 2013 | 1 | Risk Ratio (Fixed, 95% CI) | 1.01 [0.98, 1.04] |
Comparison 4. Effects of P4P plus capitation on outpatient health facilities' performance compared to FFS.
| Outcome or subgroup title | No. of studies | No. of participants | Statistical method | Effect size |
|---|---|---|---|---|
| 1 Service provision outcomes (percentage of getting certain kinds of services, dichotomous) | 1 | Risk Ratio (Fixed, 95% CI) | 0.84 [0.74, 0.96] | |
| 2 Patient outcomes (patient satisfaction, continuous) | 1 | Mean Difference (Fixed, 95% CI) | ‐0.02 [‐0.43, 0.39] |
4.2. Analysis.
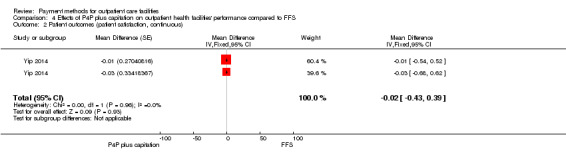
Comparison 4 Effects of P4P plus capitation on outpatient health facilities' performance compared to FFS, Outcome 2 Patient outcomes (patient satisfaction, continuous).
Characteristics of studies
Characteristics of included studies [ordered by study ID]
Alshamsan 2012.
| Methods | Repeated measures study (years 2000 to 2007, intervention started in April 2004) | |
| Participants | General practitioner practice Country: United Kingdom |
|
| Interventions | Quality and Outcome Framework (QOF): a pay‐for‐performance program that is unique in its scope and cost. It rewards family practitioners in the United Kingdom for the achievement of predetermined targets and represents approximately up to 25% of a practice income. The scheme is divided into domains that cover clinical, patient experience, and organisational aspects of care through which practices can earn up to 1000 points, with each point generating on average a payment of USD 200 (GBP 124). Diabetes accounts for approximately 15% of the QOF clinical domain points (650 points are available in the clinical domain). | |
| Outcomes | Blood pressure level, total cholesterol level, and glycated haemoglobin level in total population and in 3 (white, black, and South Asian) ethnic groups, and the disparity in these risk factor controls | |
| Notes | Re‐analysis: directly used the authors' results | |
| Risk of bias | ||
| Bias | Authors' judgement | Support for judgement |
| Intervention independent of other changes (ITS) | Low risk | No information showing there were other changes that may have influenced the outcomes |
| Shape of the intervention effect pre‐specified (ITS) | Low risk | The point of analysis is clear, intervention start time was April 2004. |
| Intervention unlikely to affect data collection (ITS) | Unclear risk | The data used for analysis in this paper were from patient electronic records, which were not influenced by payment reform. However, it is not clear if the GP's recording was changed with the start of new payment policy. |
| Knowledge of the allocated interventions adequately prevented (ITS) | Low risk | It is unknown if the people recording patients' data were aware of the payment reform, however this may not have influenced the outcomes they measured because they are all objective outcomes. |
| Incomplete outcome data adequately addressed (ITS) | Unclear risk | No information on the proportion of missing data (if all of the outcome measures for each patient were recorded every year) |
| Study free from selective outcome reporting (ITS) | Low risk | All outcomes mentioned in methods section were reported. |
An 2008.
| Methods | Randomised trial | |
| Participants | Fairview Physicians Associates (FPA) (a physicians network) clinics, including family medicine, internal medicine, obstetrics and gynaecology, multispecialty Country: Minnesota, United States |
|
| Interventions | Pay for performance plus capitation: Clinics that referred 50 smokers would receive a USD 5000 performance bonus. Clinics would also receive USD 25 for each referral beyond the initial 50. All referred patients counted towards the clinic total regardless of health plan coverage (i.e. not only Blue Cross and Blue Shield of Minnesota members). Control: Capitation with usual care condition |
|
| Outcomes | Percentage of the clinic's smokers referred to telephone counselling; percentage of the clinic's smokers referred and enrolled to quit‐line services; cost of pay‐for‐performance project 10 months after intervention |
|
| Notes | Re‐analysis: calculated absolute and relative change | |
| Risk of bias | ||
| Bias | Authors' judgement | Support for judgement |
| Random sequence generation (selection bias) | Unclear risk | No specific randomised method was mentioned. |
| Allocation concealment (selection bias) | Low risk | The allocation unit is clinics. |
| Baseline outcome measurements similar | Unclear risk | No baseline outcome measures. 49 clinics were randomly allocated, and it is not clear if this is large enough to ensure comparable groups. |
| Baseline characteristics similar | Low risk | The comparison analysis showed no significant difference in key characteristics. |
| Incomplete outcome data (attrition bias) All outcomes | Low risk | No report about the number of clinics refusing participation, and all clinics allocated at the start provided the performance data. |
| Knowledge of the allocated interventions adequately prevented | Low risk | All outcomes were objective. |
| Study adequately protected against contamination | Low risk | It is possible for controls to get intervention incentives. |
| Selective reporting (reporting bias) | Low risk | All outcomes mentioned in methods section were reported. |
Bardach 2013.
| Methods | Cluster‐randomised trial | |
| Participants | Small (< 10 clinicians) primary care clinics Country: New York, United States |
|
| Interventions | Capitation plus pay for performance: Incentivised clinics were paid for each patient whose care met the performance criteria, but they received higher payments for patients with comorbidities, who had Medicaid insurance, or who were uninsured (maximum payments: USD 200/patient; USD 100,000/clinic). Quality reports were given quarterly to the intervention groups. The intervention group also received benchmarked quarterly reports of their performance. Control: Capitation, and only receipt of quarterly reports |
|
| Outcomes | Aspirin or antithrombotic prescription, blood pressure control, cholesterol control, and smoking cessation interventions 12 months after intervention |
|
| Notes | Re‐analysis: change adjusted OR to RR | |
| Risk of bias | ||
| Bias | Authors' judgement | Support for judgement |
| Random sequence generation (selection bias) | Unclear risk | No clear information on randomisation method |
| Allocation concealment (selection bias) | Low risk | The unit of allocation was clinics. |
| Baseline outcome measurements similar | Low risk | Baseline rates differed between control and intervention clinics (P < 0.05) for blood pressure control, no comorbidities, blood pressure control in patients with IVD, and blood pressure control for IVD or DM. No difference in aspirin therapy, with IVD or DM, cholesterol control, smoking cessation intervention. However, this study's analysis was adjusted by baseline outcomes. |
| Baseline characteristics similar | Low risk | Baseline clinic characteristics were similar between intervention and control groups. |
| Incomplete outcome data (attrition bias) All outcomes | Low risk | In intervention group (42 clinics in total) 1 clinic was missed, and in control group (42 clinics in total) 7 were missed. However, in the second sensitivity analysis, the authors referred to the randomisation strata from the original study design and assumed that each clinic with missing data would have performed exactly the same as the paired clinic in its randomisation stratum. This put a conservative bound on the effects of the intervention because data from 7 intervention clinics were used to represent the data from the 7 missing control clinics, and data from 1 control clinic represented data from 1 missing intervention clinic. Also, results showed that the 3 measures that remained statistically significant found that the intervention had an effect. |
| Knowledge of the allocated interventions adequately prevented | Low risk | As the effect of payment is contingent on clinicians knowing about the incentive, clinics and clinicians were not blinded to their group assignment. The quality improvement coaches were blinded to clinic group assignment. |
| Study adequately protected against contamination | Low risk | The payment was implemented by clinics, and it was impossible for 1 clinic to be influenced by payment in other clinics. |
| Selective reporting (reporting bias) | Low risk | All outcomes listed in the methods section were reported. |
| Overall assessment for primary outcomes | Low risk | |
Basinga 2011.
| Methods | Controlled before‐after study | |
| Participants | Primary healthcare facilities Country: Rwanda |
|
| Interventions | Pay for performance plus input‐based payment: A national P4P scheme to supplement primary health centres' input‐based budgets. In this P4P scheme, payments are made directly to facilities and are used at each facility's discretion. The 14 key maternal and child healthcare output indicators were the basis of P4P payments. Control: Increased input‐based payment: traditional input‐based budgets allocated to the facilities in the control group were increased by the average amount of P4P payments that facilities in the intervention group received. |
|
| Outcomes | Prenatal care visits and institutional deliveries, quality of prenatal care, and child preventive care visits and immunisation 23 months after interventions |
|
| Notes | Re‐analysis: changed from RD to RR | |
| Risk of bias | ||
| Bias | Authors' judgement | Support for judgement |
| Random sequence generation (selection bias) | Low risk | The randomisation was done by coin toss. |
| Allocation concealment (selection bias) | Low risk | Allocation unit is district. The allocation happened simultaneously with sequence generation at the start of study. |
| Baseline outcome measurements similar | Low risk | Baseline of some maternal and children healthcare indicators were similar between intervention and control groups. |
| Baseline characteristics similar | Low risk | Baseline characteristics for health facilities, maternal sample, and children sample were all similar between intervention and control groups. |
| Incomplete outcome data (attrition bias) All outcomes | Low risk | All clusters kept in trial. For households in all clusters, the rate of attrition in the number of households available for a second interview was not statistically different between the treatment group (11.8%) and control group (12.1%; P < 0.0001). |
| Knowledge of the allocated interventions adequately prevented | Low risk | All surveys were done by trained enumerators hired by external firms specialising in data collection who were masked to whether they were interviewing in an intervention or control area. |
| Study adequately protected against contamination | Low risk | The payment was implemented by district, and it was impossible for 1 district to be influenced by payment in another district. |
| Selective reporting (reporting bias) | Low risk | All outcomes mentioned in the methods section are reported. |
| Other bias | Unclear risk | After randomised allocation, just before implementation of the baseline survey, the administrative district boundaries were redefined by the government in a decentralisation process. As a result, some of the districts selected for our assessment were combined with districts that already had the existing P4P schemes. The government enrolled all facilities in newly formed districts that had existing P4P schemes into the first phase of the rollout. As a result of this district reorganisation, we had to switch the assignment (intervention or control) for 8 districts from 4 blocks (originally 8 blocks were enrolled in this trial), and add 1 block to the sample. |
| Overall assessment for primary outcomes | Low risk | |
Bonfrer 2014a.
| Methods | Controlled before‐after study | |
| Participants | Primary care facilities Country: Burundi |
|
| Interventions | Performance‐based financing (3 provinces): Facilities receive payments based on the quantity and quality of health services provided. Quantity is measured through 23 output indicators. Quality is assessed quarterly by local regulatory authorities on a randomly chosen day using a checklist containing 220 items grouped into the following topics: general infrastructure and communication, business plan, income and costs, hygiene and sterilisation, outpatient consultations, family planning, laboratory services, inpatient care, management of essential drugs, availability of essential drugs, maternal care, surgery, tuberculosis screening, vaccination, and antenatal care. The total payment to a facility is calculated as a weighted sum of the number of provided services in the previous 3 months times their unit payment multiplied by the quality bonus, which ranges between 1 and 1.25 depending on the score obtained from evaluation of facilities based on results of the checklist assessment. Control (2 provinces): input‐based funding |
|
| Outcomes |
|
|
| Notes | We only included the comparison between 2006 and 2008, but did not use it for effect analysis due to the high risk of bias for CBA. For the comparison between 2008 and 2010, the control group started the intervention in 2008 and was therefore inadequate for evaluating effects of the performance‐based financing intervention. |
|
| Risk of bias | ||
| Bias | Authors' judgement | Support for judgement |
| Random sequence generation (selection bias) | High risk | CBA, no randomised allocation method |
| Allocation concealment (selection bias) | Unclear risk | The allocation unit was province, but the allocation process was not clearly described. |
| Baseline outcome measurements similar | Unclear risk | No baseline outcomes comparisons were done for the 3 intervention provinces and 2 control provinces we included in this review. |
| Baseline characteristics similar | Unclear risk | No baseline characteristics comparison between intervention and control sites |
| Incomplete outcome data (attrition bias) All outcomes | Unclear risk | No information on the dropout rates for household survey |
| Knowledge of the allocated interventions adequately prevented | Unclear risk | No blinding of outcome assessment, but outcome measures were all objective. |
| Study adequately protected against contamination | Unclear risk | Not adequately described |
| Selective reporting (reporting bias) | Low risk | In this paper all outcomes mentioned in methods section were reported. |
| Other bias | Unclear risk | How and who decided which provinces received the intervention in different stages are not described. |
| Overall assessment for primary outcomes | High risk | |
Canavan 2008.
| Methods | Controlled before‐after study | |
| Participants | Intervention: mission‐based health centres and dispensaries Control: government health centres and dispensaries Country: Tanzania |
|
| Interventions | Pay for performance: The annual allocation to health facilities is set at 50% as guaranteed financing (base fund) with 50% earmarked as bonus allocation. The bonus or performance incentive is tied to preset targets that are reported on a 6 monthly basis and verified by an independent consultant. The total incentive per facility is thereby the percentage of total performance times the maximum incentive per health facility with the certain selected performance targets. Control: Government revenue in place to support service delivery |
|
| Outcomes | Health centre outpatient department rates, health centre total number of deliveries, antenatal care attendance, health coverage for DPT3 in children < 1 year, health centre consultation activity, dispensary utilisation rates, dispensary consultation activity | |
| Notes | Included, but not used for effect analysis because of high risk of bias | |
| Risk of bias | ||
| Bias | Authors' judgement | Support for judgement |
| Random sequence generation (selection bias) | High risk | CBA, no random allocation process |
| Allocation concealment (selection bias) | Low risk | The allocation unit is district allocation, but allocation is not randomised, so selection bias might exist. |
| Baseline outcome measurements similar | High risk | Based on results, the baseline outcomes between the 2 groups were very different. |
| Baseline characteristics similar | Unclear risk | No relevant comparisons |
| Incomplete outcome data (attrition bias) All outcomes | Unclear risk | Many indicators are reported; it is not easy to assess their completeness and how denominators have changed over the study period. |
| Knowledge of the allocated interventions adequately prevented | Unclear risk | Unclear if assessors were aware of allocation |
| Study adequately protected against contamination | Low risk | It is not likely that the control group received or was influenced by the payment intervention. |
| Selective reporting (reporting bias) | Unclear risk | Due to the large number of outcome measures, we cannot exclude the possibility of selective reporting. |
| Overall assessment for primary outcomes | High risk | |
Catalano 2000.
| Methods | Interrupted time series study with comparison group (48 weeks before intervention, 98 weeks after intervention) | |
| Participants | Mental health assessment and service agencies, reorganised from original community mental health centres Country: Colorado, United States |
|
| Interventions | Capitation: Mental health assessment and service agencies were initially paid a capitated rate based on historical patterns of utilisation in the regions they served. The payment was made prospectively each month, with subsequent adjustment to correct for actual enrolment. Mental health assessment and service agencies are at full financial risk. However, they do not pay for psychotropic medication or for mental health care provided in residential childcare facilities. Control: Fee‐for‐service |
|
| Outcomes | The total cost of treating people younger than 18 years; the total cost of inpatient treatment; the total cost of outpatient treatment; the number of people younger than 18 years in inpatient treatment; the number of people younger than 18 years in outpatient treatment; the number of people younger than 5 years in treatment; the number of disruptive children in treatment; the number of people younger than 18 years treated in emergency rooms | |
| Notes | Re‐analysis: not enough data for re‐analysis | |
| Risk of bias | ||
| Bias | Authors' judgement | Support for judgement |
| Intervention independent of other changes (ITS) | Low risk | No information showing there were other policy changes occurring at the same time |
| Shape of the intervention effect pre‐specified (ITS) | Low risk | The intervention time point is clear, on the 46th week. |
| Intervention unlikely to affect data collection (ITS) | Unclear risk | The data source before and after the intervention in capitated areas is not the same (before the intervention: Medicaid fee‐for‐service claims; after intervention: shadow billing system). The author mentioned that the shadow billing system was accurate. However, it is still not clear if the intervention influenced how data were collected for the shadow billing system. |
| Knowledge of the allocated interventions adequately prevented (ITS) | Low risk | All the outcomes measured are objective outcomes. |
| Incomplete outcome data adequately addressed (ITS) | Low risk | Medicaid fee‐for‐service claims and shadow billing system data for all covered populations should be complete. |
| Study free from selective outcome reporting (ITS) | Low risk | All outcomes in hypothesis were reported. |
| Other risk of bias (ITS) | Low risk | |
Catalano 2005.
| Methods | Interrupted time series study with comparison group (52 weeks before intervention, 53 weeks after intervention) | |
| Participants | Mental health assessment and service agencies, reorganised from original community mental health centres Country: Colorado, United States |
|
| Interventions | Capitation: Mental health assessment and service agencies were initially paid a capitated rate based on historical patterns of utilisation in the regions they served. The payment was made prospectively each month, with subsequent adjustment to correct for actual enrolment. Mental health assessment and service agencies are at full financial risk. However, they do not pay for psychotropic medication or for mental health care provided in residential childcare facilities. Control: Fee‐for‐service |
|
| Outcomes | Emergency visit | |
| Notes | Re‐analysis results: Non‐for‐profit health centres: change in trend ‐0.332, P < 0.001; change in level ‐7.422, P = 0.008 For‐profit health centres: change in trend ‐0.164, P < 0.001; change in level ‐5.305, P = 0.172 |
|
| Risk of bias | ||
| Bias | Authors' judgement | Support for judgement |
| Intervention independent of other changes (ITS) | Low risk | No information showing there were other policy changes occurring at the same time |
| Shape of the intervention effect pre‐specified (ITS) | Low risk | The intervention time point is clear, on the 53th week. |
| Intervention unlikely to affect data collection (ITS) | Unclear risk | After the intervention, a new dataset from shadow billing system was used. It is not clear if the intervention influenced how the data were collected for the shadow billing system. |
| Knowledge of the allocated interventions adequately prevented (ITS) | Low risk | All the outcomes measured are objective outcomes. |
| Incomplete outcome data adequately addressed (ITS) | Low risk | The data appear to be complete for emergency visit because "these agencies reimburse hospitals for these services. The hospitals have a financial incentive to report visits to the agencies that had capitated reimbursement, and these agencies, in turn, have an incentive to track emergency department visits so that they can determine their expenditures for these services." |
| Study free from selective outcome reporting (ITS) | Low risk | All outcomes in the methods section were reported. |
Chien 2012.
| Methods | Repeated measures study (24 months before intervention, 12 months after intervention) | |
| Participants | 118 primary care practices (620 physicians) contracted with Hudson Health Plan (Hudson). Of the eligible practices, about 65% were solo or small practices and 35% were medium‐ (4 to 9 full‐time physicians) to large‐sized (10 or more full‐time physicians) practices. Country: New York, United States |
|
| Interventions | Pay for performance plus other payment methods: Late in 2003, starting pilot providers were offered USD 100 for each diabetes patient completing all of the missing care processes; formally launched in August 2004; in the beginning of 2005, the program was revised a second time such that incentive amounts in 2005 P4P incentive were 3 times those offered in 2003 and more than twice the 2004 bonus. Performance included both quantity measures (whether annual glycated haemoglobin and LDL tests were delivered) and diabetes quality measures (whether glycated haemoglobin and LDL levels were lowered or at goal levels). Comparison: Other payment methods (mainly capitation, but also varied based on the insurance type of patients) |
|
| Outcomes | Glycated haemoglobin testing, lipid testing, dilated eye exam | |
| Notes | Re‐analysis: changed OR to RR | |
| Risk of bias | ||
| Bias | Authors' judgement | Support for judgement |
| Intervention independent of other changes (ITS) | Low risk | No information showing there were other policy changes |
| Shape of the intervention effect pre‐specified (ITS) | Low risk | The intervention effect time point is clear. "We looked for our primary effect (specified as a linear shift or a break in trend) in 2005 and later. This specification is consistent with the notion that practice quality improvement efforts take time to be implemented and once implemented to change performance. We tested the sensitivity of our results to this assumption in two ways. First, we excluded the practices that were actively supported in the 2003 pilot from the analysis and compare our results with the full sample. Second, we tested whether using 2004 as the post‐intervention period leads to a different finding. In neither case did these changes produce qualitatively different findings from the base model so we do not report them here." |
| Intervention unlikely to affect data collection (ITS) | Low risk | Data sources are the same: enrolment and claims data of Medicaid. No information showing the collection methods were changed because of intervention |
| Knowledge of the allocated interventions adequately prevented (ITS) | Low risk | All outcomes are objective. |
| Incomplete outcome data adequately addressed (ITS) | Low risk | Medicaid claims data should be complete. |
| Study free from selective outcome reporting (ITS) | Low risk | All outcomes mentioned in methods section were reported. |
| Overall assessment for primary outcomes | Low risk | |
Engineer 2016.
| Methods | Randomised trial | |
| Participants | Primary care facilities Country: Afghanistan |
|
| Interventions | Intervention: Regular budget plus P4P bonus. P4P bonuses were based on the volume of 9 health services (1st antenatal care visit, 2nd antenatal care visit, 3rd antenatal care visit, 4th antenatal care visit, skilled birth attendance cases, 1st postnatal care visit, 2nd postnatal care visit, pentavalent 3 vaccination, tuberculosis care detection) provided by health facilities reported through Health Management Information System. Additional annual payments made based on 2 measures of equity of service provision, a balanced scorecard that addresses quality of services, and contraceptive prevalence rates in health facility catchment areas. P4P bonuses were applied at the health facility (HF) level and paid quarterly. Funds to the health workers were channeled through the NGOs managing those facilities, and paid on top of their regular budgets. Health facilities submitted monthly reports on the volume of services provided, which were verified quarterly by independent monitors, record‐matching, and random home visits of patients reported as service users. Health facility managers distributed the performance incentives in their own way, which included giving individual bonuses proportional to the health worker's salary, giving them in equal amounts to all staff, or giving them based on their determination of an individual's contribution to the performance indicators. Control: Regular budget to health facilities and health workers |
|
| Outcomes | Primary population‐level outcome measures were: contraceptive prevalence; proportion of deliveries with at least 1 antenatal care visit; proportion of deliveries with a skilled birth attendant; proportion of births with at least 1 postnatal care visit in the first 6 weeks; and proportion of children aged 12 to 23 years with pentavalent vaccination. 2 measures of equity of service utilisation were: concentration index of institutional delivery and concentration index of outpatient visits of children under 5. Other outcome measurements were made at the HF level: indicators from the Balanced Scorecard Basic Package of Health Services, which is comprised of the following 20 indicators covering 5 domains of quality of care. 1 Overall Client Satisfaction and Perceived Quality of Care Index 2 Community Involvement and Decision Making Index 3 Health Worker Satisfaction Index 4 Health Worker Motivation Index 5 Salary Payment Current 6 Minimum Staffing Index 7 Provider Knowledge Score 8 Staff Received Training (in past year) 9 Equipment Functionality Index 10 Pharmaceuticals and Vaccines Availability Index 11a Laboratory Functionality Index (Community Health Centres only, 18 pairs) 12 Clinical Guidelines Index 13 Functional Infrastructure Index 14 Client Background and Physical Assessment Index 15 Client Counselling Index 16 Universal Precautions 17 Time Spent with Client 18 HMIS Use Index 19 Financial Systems 20 HF Management Functionality Index | |
| Notes | ||
| Risk of bias | ||
| Bias | Authors' judgement | Support for judgement |
| Random sequence generation (selection bias) | Unclear risk | Only reported random assignment to control and intervention group after stratification |
| Allocation concealment (selection bias) | Low risk | The allocation unit is facility, and allocation was performed on all units at the start of the study. |
| Baseline outcome measurements similar | Low risk | The baseline surveys provided information to the MOPH about health conditions in the study area, and demonstrated that the P4P and comparison areas were similar with respect to study outcomes and demographic characteristics at the beginning of the trial. |
| Baseline characteristics similar | Low risk | The baseline surveys provided information to the MOPH about health conditions in the study area, and demonstrated that the P4P and comparison areas were similar with respect to study outcomes and demographic characteristics at the beginning of the trial. |
| Incomplete outcome data (attrition bias) All outcomes | Low risk | Based on reported information, only 1 facility (72 in total) was lost in the postintervention household survey. All facilities were followed for survey investigation. |
| Knowledge of the allocated interventions adequately prevented | Low risk | Trained interviewers who were masked to type of site completed both surveys, which were pre‐tested, translated, and back‐translated for consistency. |
| Study adequately protected against contamination | Low risk | Non‐governmental organisations managing facilities were contracted by the MOPH to provide services throughout a province, thereby managing both intervention and comparison sites, potentially preventing "contamination" of P4P to comparison sites. |
| Selective reporting (reporting bias) | Low risk | All outcomes listed in methods section were reported. |
| Other bias | Low risk | |
Hillman 1998.
| Methods | Randomised trial | |
| Participants | Primary health sites Country: Philadelphia, United States |
|
| Interventions | Intervention: P4P plus capitation and chart audits: The intervention included semi‐annual feedback to primary care providers regarding compliance with cancer screening guidelines and financial bonuses for "good" performers. The assessor calculated the percentage of charts in compliance with each indicator for each 6‐month period for each site. The aggregate compliance scores were the number of indicators in compliance divided by the number of applicable charts. Eligibility for bonuses was based on aggregate compliance scores and improvement in scores over time. The 3 intervention sites with the highest compliance scores received a "full" bonus (20% of capitation for all female Healthcare Management Alternatives members 50 years of age and older); the 3 with the next highest scores and the 3 improving the most from the previous audit both received "partial" bonuses (10% of capitation). Bonuses ranged from USD 570 to USD 1260 per site, with an average of USD 775 per audit. 17 (of 26) sites received at least 1 bonus throughout the course of the study. Control: Capitation |
|
| Outcomes | Compliance score for Pap test, colorectal screening, mammography, breast exam, and the total compliance score 6 months, 12 months, and 18 months after intervention |
|
| Notes | Re‐analysis: calculated absolute change and relative change adjusted baseline | |
| Risk of bias | ||
| Bias | Authors' judgement | Support for judgement |
| Random sequence generation (selection bias) | Unclear risk | No information on how random sequence was generated, and only mention of stratified randomisation |
| Allocation concealment (selection bias) | Low risk | Allocation unit is primary care site. |
| Baseline outcome measurements similar | Unclear risk | No comparison analysis was conducted on this. Based on the descriptive data on baseline outcomes in 2 groups, it appears there were differences between groups. |
| Baseline characteristics similar | Low risk | The characteristics of study groups were compared and there were no significant differences. |
| Incomplete outcome data (attrition bias) All outcomes | Low risk | 2 sites had a missing value for 1 audit. The authors used mean values from the respective study group to impute values for these sites. The results did not change when the 2 sites with missing data were excluded. |
| Knowledge of the allocated interventions adequately prevented | Unclear risk | No relevant information |
| Study adequately protected against contamination | Low risk | It was impossible for the control group to receive or to be influenced by the bonus. |
| Selective reporting (reporting bias) | Low risk | All outcomes mentioned in methods section were reported. |
Hillman 1999.
| Methods | Randomised trial | |
| Participants | Primary physician practices serving paediatric members of a managed care plan Country: Philadelphia, United States |
|
| Interventions | Pay for performance plus capitation: Sites received semi‐annual feedback, plus a cover letter with the feedback report notifying them if they had qualified for a bonus based on their performance. Eligibility for bonuses was based on the total compliance score. Bonus eligibility required a minimum compliance score of 20% for each indicator. The 3 sites with the highest total compliance scores received a full bonus (20% of the site's total 6‐month capitation for paediatric members up to the 7th birthday); the 3 next best scoring sites received a partial bonus (10% of capitation); and the 3 sites showing the most improvement from the last audit also received this partial bonus, provided that their total compliance score increased by at least 10%. Capitation: Sites received a feedback report after each audit showing their performance (compliance scores on each indicator and total compliance score) in comparison with the performance of all audited sites. |
|
| Outcomes | Compliance scores for immunisation: Compliance for immunisations was defined as receipt of vaccines on or before the maximum recommended age, with a 2‐month grace period. A total compliance score was also calculated as the total number of indicators met across all charts, divided by the total number of applicable indicators across those same charts. Compliance scores for other indicators: Calculated for each of the other preventive care indicators. Overall compliance scores: Calculated for each of the indicators developed by Healthcare Management Alternatives (including immunisation and other preventive care) as the number of reviewed charts for which the indicator was met, divided by the number of charts for which the indicator was applicable. 6 months, 12 months, 18 months after intervention |
|
| Notes | Re‐analysis: calculated absolute change and relative change adjusted baseline | |
| Risk of bias | ||
| Bias | Authors' judgement | Support for judgement |
| Random sequence generation (selection bias) | Unclear risk | No information on how random sequence was generated, and only mention of stratified randomisation |
| Allocation concealment (selection bias) | Low risk | Allocation unit is primary care site. |
| Baseline outcome measurements similar | Unclear risk | No comparison analysis on this was conducted. Based on the descriptive data on baseline outcomes in 2 groups, it appears there were no significant differences between groups. |
| Baseline characteristics similar | Low risk | The characteristics of study groups were compared and no significant differences found. |
| Incomplete outcome data (attrition bias) All outcomes | Low risk | 8 sites had a missing value for 1 audit. We used mean values from the respective study group to impute values for these sites. Other estimation techniques, such as regression imputation, did not produce significantly different results. Imputation did not affect our conclusions, but did improve the power of the study. |
| Knowledge of the allocated interventions adequately prevented | Low risk | The nurse‐reviewers were blinded to which sites were in each of the 3 study groups. |
| Study adequately protected against contamination | Low risk | It is impossible for the control group to receive or to be influenced by the bonus. |
| Selective reporting (reporting bias) | Low risk | All outcomes mentioned in methods section were reported. |
| Other bias | Low risk | |
Lee 2011.
| Methods | Repeated measures (3 years before intervention, 3 years after intervention) | |
| Participants | General practitioner practices | |
| Interventions | The Quality and Outcomes Framework: Introduced in 2004, links up to 25% of UK family practitioner income to performance on 76 clinical quality indicators and 70 indicators relating to organisation of care and patient experience. Of the clinical indicators, 10 relate to maintaining disease registers, 56 to processes of care (such as measuring disease parameters and giving treatments), and 10 to intermediate outcomes (such as controlling blood pressure). Control: Capitation payments |
|
| Outcomes | Systolic and diastolic blood pressure for CHD, stroke, and hypertension patients, total cholesterol level for CHD and stroke patients; and inequalities between different ethnicities | |
| Notes | Re‐analysis: directly used the authors' results | |
| Risk of bias | ||
| Bias | Authors' judgement | Support for judgement |
| Intervention independent of other changes (ITS) | Low risk | No information showing that other policy changes occurred at the same time |
| Shape of the intervention effect pre‐specified (ITS) | Low risk | The intervention time point is prespecified, in year 2004. |
| Intervention unlikely to affect data collection (ITS) | Unclear risk | The data used in this study were extracted from a longitudinal primary care record, which was not influenced by intervention. However, it is unclear if the GP's recording was changed with the start of the new payment policy. |
| Knowledge of the allocated interventions adequately prevented (ITS) | Low risk | The outcomes are objective. |
| Incomplete outcome data adequately addressed (ITS) | Unclear risk | The longitudinal primary care record data appear to be complete. |
| Study free from selective outcome reporting (ITS) | Low risk | All outcomes mentioned in methods section were reported. |
McLintock 2014.
| Methods | Interrupted time series study (123 months before and after interventions) | |
| Participants | General practitioner practices Country: United Kingdom |
|
| Interventions | Financial incentives for case finding for depression in patients with diabetes and CHD under the Quality and Outcomes Framework (QOF): Introduced in 2004, links up to 25% of UK family practitioner income to performance on 76 clinical quality indicators and 70 indicators relating to organisation of care and patient experience. QOF started to reward case finding for depression in all patients with a diagnosis of CHD or diabetes during 2006 to 2013. This performance indicator in QOF was known as "QOF DEP1" and was defined as "the percentage of patients on the diabetes register and/or the CHD register for whom case finding for depression has been undertaken on one occasion during the previous 15 months using two standard screening questions." Control: QOF without special incentives for case finding for depression in patients with diabetes and CHD |
|
| Outcomes | Rates of coded case finding for depression in patients with targeted conditions
Rates of new depression‐related coded diagnoses in patients with targeted conditions Rates of new antidepressant prescribing in patients with targeted conditions Adverse effects: prescription of some unnecessary treatment |
|
| Notes | ||
| Risk of bias | ||
| Bias | Authors' judgement | Support for judgement |
| Intervention independent of other changes (ITS) | Low risk | No information showing that there were other policy changes |
| Shape of the intervention effect pre‐specified (ITS) | Low risk | The intervention time point is prespecified, in April 2006. |
| Intervention unlikely to affect data collection (ITS) | High risk | It was mentioned that the inclusion of this incentive indicator resulted in GPs beginning to realise they had triggered alerts to coding in patients with existing diagnoses of diabetes and CHD. |
| Knowledge of the allocated interventions adequately prevented (ITS) | Low risk | The outcomes are objective. |
| Incomplete outcome data adequately addressed (ITS) | Unclear risk | No information showing the following up of all 65 practices |
| Study free from selective outcome reporting (ITS) | Low risk | All outcomes mentioned in methods section were reported. |
| Overall assessment for primary outcomes | High risk | |
Petersen 2013.
| Methods | Randomised trial | |
| Participants | 12 hospital‐based primary care clinics in 5 Veterans Affairs networks Country: United States, many states |
|
| Interventions | Intervention: Pay for performance plus existing salary payment: The intervention phase included a 4‐month performance baseline period (August to November 2007) and 4 consecutive 4‐month periods starting in April 2008. At the end of each period, medical record abstractors collected data from electronic medical records for 40 patients with hypertension randomly selected from each physician's panel. Participants earned incentives for achieving Seventh Report of the Joint National Committee on Prevention, Detection, Evaluation, and Treatment of High Blood Pressure (JNC 7) guideline–recommended blood pressure thresholds or appropriately responding to uncontrolled blood pressure (e.g. lifestyle recommendation for stage 1 hypertension or guideline‐recommended medication adjustment), prescribing guideline‐recommended antihypertensive medications, or both. The reward was USD 9.10 for each successful measure. For the practice‐level payments, the aggregated earnings of the physician participants were equally distributed between the physician and non‐physician participants in the practice team. Physicians in the combined incentive group received their individual‐level performance payment plus their practice‐level share. Education: Participants attended webinars beginning in February 2008 that reviewed the guidelines from the JNC 7. Audit and feedback: Customised audit and feedback reports detailing performance for each period and the next period’s performance goals were posted to the study’s secure website. Control: Only salary payments to physicians in practices |
|
| Outcomes | 24 months after interventions Number of patients achieving guideline‐recommended blood pressure thresholds or receiving an appropriate response to uncontrolled blood pressure Number of patients prescribed guideline‐recommended medications Number of patients who developed hypotension Unintented outcomes: reduction in performance in the combined measure of blood pressure control or appropriate response to uncontrolled blood pressure in each intervention group compared with controls |
|
| Notes | Re‐analysis: changed RD to RR | |
| Risk of bias | ||
| Bias | Authors' judgement | Support for judgement |
| Random sequence generation (selection bias) | Low risk | A data analyst assigned a uniform random number to each of the possible allocations using SAS version 9.1.3 (SAS Institute) and selected the one with the highest random number. |
| Allocation concealment (selection bias) | Low risk | Cluster‐randomised by hospitals, and the sequence and allocation occurred at the same time. |
| Baseline outcome measurements similar | Unclear risk | No comparison analysis on baseline outcomes, and based on descriptive data they appear to be different. Additionally, the sample of hospitals (12) for randomised allocation was limited. The results were based on analysis adjusted by baseline level. |
| Baseline characteristics similar | Unclear risk | There were no significant differences in the distributions of physician sex, race, years practicing since completing residency, or patient characteristics. There were significant differences across groups in characteristics of the hospitals where the participants worked, including whether they were teaching hospitals (P < 0.001), whether they were Antihypertensive and Lipid‐Lowering Treatment to Prevent Heart Attack Trial (ALLHAT) sites (P < 0.001), and whether they were in the southern or northern United States (P = 0.04). |
| Incomplete outcome data (attrition bias) All outcomes | Low risk | The dropout rates of participants were not high (1/19, 4/24, 2/44, 1/20 excluded during study process). |
| Knowledge of the allocated interventions adequately prevented | Low risk | All outcomes were objective. |
| Study adequately protected against contamination | Low risk | This study cluster‐randomised by hospital to avoid contamination of the intervention; all participants at a hospital belonged to the same intervention group. |
| Selective reporting (reporting bias) | Low risk | All outcomes mentioned in methods section were reported. |
Roski 2003.
| Methods | Cluster‐randomised trial | |
| Participants | Clinics providing primary care service (family practice, internal medicine, obstetrics/gynaecology) of a large Midwestern multispecialty group practice Country: Upper Midwest of United States |
|
| Interventions | Pay for performance plus capitation and printed versions of smoking cessation guidelines: Performance targets were set at approximately 15 percentage points above the average performance for these clinic practices as assessed by the medical group 2 years prior to the effort described in study. Incentive amounts were based on the number of providers per clinic. Specifically, clinics with 1 to 7 providers could receive a USD 5000 award, and clinics with 8 or more providers were eligible for a USD 10,000 bonus. Clinics who reached or exceeded only 1 of the 2 performance goals were eligible for half the amount. Control: Capitation with the distribution of printed versions of smoking cessation guidelines |
|
| Outcomes | Smoking cessation clinical practice patterns (tobacco user identification, providing advice to quit to current smokers, providing assistance to quit to current smokers), 12 months after interventions; and patient outcomes (7‐day sustained abstinence from smoking, use of 1 or more types of smoking cessation assistance, use of any medication for quitting, use of any counselling services, current smokers 7‐day point prevalence, intention to quit within 30 days), 18 months after interventions | |
| Notes | Re‐analysis: change and relative change | |
| Risk of bias | ||
| Bias | Authors' judgement | Support for judgement |
| Random sequence generation (selection bias) | Unclear risk | No information on randomisation method |
| Allocation concealment (selection bias) | Low risk | Allocation unit is clinics, and the sequence and allocation occurred at the same time. |
| Baseline outcome measurements similar | Unclear risk | For clinical practice outcomes: "At baseline no differences were found between the experimental conditions with respect to identification of tobacco use, provision of advice to quit, and assistance in quitting at the most recent clinic visit." For patient outcomes: no baseline outcome measures |
| Baseline characteristics similar | Unclear risk | The potential influence of several clinic‐level covariates, including the proportion of low‐income patients, patients' gender distribution, and clinic size (number of providers, average number of patient visits), was controlled by forming groups of similar clinics and their subsequent block randomisation into the 3 conditions. Ob/gyn clinics were evenly distributed among study conditions. No information on whether the patients they treated were similar. |
| Incomplete outcome data (attrition bias) All outcomes | Low risk | For provider practices: 3 (in 40) were excluded during the study process. For patients surveyed for patient outcomes: the response rates did not differ by experimental condition. |
| Knowledge of the allocated interventions adequately prevented | Unclear risk | No information on whether the assessor who did the survey was aware of the allocation |
| Study adequately protected against contamination | Low risk | It appears unlikely that effective change mechanisms could have been instituted at clinic sites in the control condition by simply listening to accounts of, or observation of, newly implemented change activities in clinic sites randomised to the incentive or registry experimental conditions. |
| Selective reporting (reporting bias) | Low risk | All outcomes mentioned in the methods section were reported. |
Rudasingwa 2015.
| Methods | Controlled before‐after study | |
| Participants | Primary care facilities Country: Burundi |
|
| Interventions | Performance‐based financing (PBF) (3 provinces): Facilities receive payments based on the quantity and quality of health services provided. Quantity is measured through 23 output indicators. Quality is assessed quarterly by local regulatory authorities on a randomly chosen day using a checklist containing 220 items grouped into the following topics: general infrastructure and communication, business plan, income and costs, hygiene and sterilisation, outpatient consultations, family planning, laboratory services, inpatient care, management of essential drugs, availability of essential drugs, maternal care, surgery, tuberculosis screening, vaccination, and antenatal care. The total payment to a facility is calculated as a weighted sum of the number of provided services in the previous 3 months times their unit payment multiplied by the quality bonus, which ranges from 1 to 1.25 depending on the score obtained from evaluation of facilities based on results of the checklist assessment. After the PBF fund holders had paid the PBF incentives to health facilities, the bonuses were distributed to health facility staff using a systematically approach called "indices" instrument, which helped health facility managers to determine the bonus of each health worker in a clear and transparent manner. The indices instrument allowed health facility managers to distribute the bonuses based on the profile and performance criteria of each work staff, such as qualification, experience, years of employment, responsibilities, and worked hours (overtime and not‐worked hours). Control (2 provinces): Input‐based funding |
|
| Outcomes | Quality score for:
|
|
| Notes | Study included, but not used for effect analysis. | |
| Risk of bias | ||
| Bias | Authors' judgement | Support for judgement |
| Random sequence generation (selection bias) | High risk | CBA, no randomised allocation method |
| Allocation concealment (selection bias) | Unclear risk | The allocation unit was province, but the allocation process was not clearly described. |
| Baseline outcome measurements similar | Low risk | It is reported that "baseline values of performance scores in health facilities with financial incentives were lower than those of the health facilities without financial incentives". |
| Baseline characteristics similar | Unclear risk | No baseline characteristics comparison between intervention and control sites. |
| Incomplete outcome data (attrition bias) All outcomes | Low risk | No explicit information on the dropout rates for facility survey, but judging from the description of the results, all facilities investigated at baseline were followed. |
| Knowledge of the allocated interventions adequately prevented | Unclear risk | No blinding of outcome assessment, but outcome measures were all objective. |
| Study adequately protected against contamination | Unclear risk | Not adequately described |
| Selective reporting (reporting bias) | Low risk | In this paper all outcomes mentioned in methods section were reported. |
| Other bias | Unclear risk | How and who decided which province received intervention are not described. |
| Overall assessment for primary outcomes | High risk | |
Serumaga 2011.
| Methods | Interrupted time series study (9 quarters before interventions, and 12 quarters after interventions) | |
| Participants | General practitioner practices Country: United Kingdom |
|
| Interventions | Pay for performance plus capitation: The UK pay‐for‐performance incentive (the Quality and Outcomes Framework), which was implemented in April 2004 and includes specific targets for general practitioners to show high‐quality care for patients with hypertension (and other diseases). Control: Capitation |
|
| Outcomes | The proportion of patients with controlled blood pressure The percentage of patients with blood pressure measured each month Non‐incentivised services All‐cause mortality and adverse hypertension‐related outcomes during the entire study period |
|
| Notes | Re‐analysis: directly used authors' results | |
| Risk of bias | ||
| Bias | Authors' judgement | Support for judgement |
| Intervention independent of other changes (ITS) | Low risk | No information showing there were other policy changes at the same time |
| Shape of the intervention effect pre‐specified (ITS) | Low risk | "To limit co‐intervention confounding of the time series we therefore defined April to June 2004 as the intervention phase‐in period." |
| Intervention unlikely to affect data collection (ITS) | Unclear risk | Data from The Health Improvement Network (THIN), a large database of primary care medical records, which was not influenced by payment reform. However, it is unclear if the GP's recording behaviour for all databases was improved with the start of new payment policy. |
| Knowledge of the allocated interventions adequately prevented (ITS) | Low risk | Outcomes were objective. |
| Incomplete outcome data adequately addressed (ITS) | Low risk | The Health Improvement Network appeared to be complete. |
| Study free from selective outcome reporting (ITS) | Low risk | All outcomes mentioned in methods section were reported. |
Soeters 2008.
| Methods | Controlled before‐after study | |
| Participants | Primary care facilities Country: Burundi |
|
| Interventions | Performance‐based financing: "Fund holder organizations" were established in the 2 intervention districts, which negotiated contracts with individual health facilities and verified and paid for the performance of the facility. Control: Input‐based funding |
|
| Outcomes | 23 output indicators established covering preventive care, management of conditions, and patient education. | |
| Notes | Study included, but not used for effect analysis. | |
| Risk of bias | ||
| Bias | Authors' judgement | Support for judgement |
| Random sequence generation (selection bias) | High risk | CBA, no randomised allocation method |
| Allocation concealment (selection bias) | Unclear risk | The allocation unit was the site, but the allocation process was not clearly described. |
| Baseline outcome measurements similar | Unclear risk | No baseline outcomes comparisons were done. |
| Baseline characteristics similar | High risk | Considerable differences were noted between intervention and control sites. |
| Incomplete outcome data (attrition bias) All outcomes | Unclear risk | No information on the dropout rates for household survey |
| Knowledge of the allocated interventions adequately prevented | Unclear risk | No blinding of outcome assessment, but outcome measures were all objective. |
| Study adequately protected against contamination | Unclear risk | Not adequately described |
| Selective reporting (reporting bias) | High risk | With so many indicators, it is hard to rule out selective reporting. Not clear how the choice of indicators to include in the household survey was made (not all performance areas are covered). |
| Other bias | High risk | Researchers were involved in designing intervention and might therefore be biased. |
| Overall assessment for primary outcomes | High risk | |
Soeters 2011.
| Methods | Controlled before‐after study | |
| Participants | Only mentioned health centres, no detailed information Country: Democratic Republic of Congo |
|
| Interventions | Performance‐based financing: involves payment for predetermined health services. The more contractual services a healthcare provider performs, the more subsidies the provider receives. This relationship is linear. For example, for 1 birth assisted by a skilled health worker, a health facility would receive USD 7, for 2 deliveries USD 14, and so on. Participating health centres received subsidies for 16 indicators, such as outpatient department consultancies, number of bed days, fully immunising a child before 12 months of age, construction of a household pit latrine, and use by a woman of oral or injectable contraceptives. Control: Input‐based financing, no performance‐based payments, but would receive essential drugs and equipment and fixed staff performance bonuses |
|
| Outcomes | Outcomes about health centres reported by this published paper: annual revenues from user fee | |
| Notes | Re‐analysis: not used for effect analysis | |
| Risk of bias | ||
| Bias | Authors' judgement | Support for judgement |
| Random sequence generation (selection bias) | High risk | CBA, no randomised allocation method |
| Allocation concealment (selection bias) | Unclear risk | The allocation unit was the site, but the allocation process was not clearly described. |
| Baseline outcome measurements similar | High risk | Not clear for most outcomes, for some outcomes (revenue of health centre, per capita health spending, and financial access) there are baseline data for 2 groups but no comparison analysis. |
| Baseline characteristics similar | Unclear risk | "Two neighbouring districts, Kalehe and Kabare — with a combined population of 232,000 and similar characteristics to Katana and Idjwi — were targeted as the control areas", but no detailed information on how the characteristics are similar. |
| Incomplete outcome data (attrition bias) All outcomes | Unclear risk | No information on missing data |
| Knowledge of the allocated interventions adequately prevented | Unclear risk | No blinding of outcome assessment, but outcome measures were all objective. |
| Study adequately protected against contamination | Unclear risk | Not adequately described |
| Selective reporting (reporting bias) | Low risk | All outcomes are reported. |
| Other bias | High risk | Researchers were involved in designing intervention and might therefore be biased. |
| Overall assessment for primary outcomes | High risk | |
Yip 2014.
| Methods | Matched‐pair cluster‐randomised trial | |
| Participants | Township health centres and village health post Country: China |
|
| Interventions | Capitated budget with pay for performance: The capitated budget for each centre was based on the number of New Rural Cooperative Medical Scheme (NCMS) enrollees in the relevant town and the villages whose posts the centre supervised. At the beginning of every year, the NCMS disbursed 70% of the budget to the township health centres, withholding the balance until after performance assessments of both the centres and the village posts at the middle and end of the year (each centre in turn disbursed a share of the 70% to the village posts under its supervision). After each assessment, the county NCMS office compared the performance score for each township health centre to the average score in the county. Each centre that scored above the average received more than the 30% of the budget that had been withheld, in proportion to how much above the county average its score was. Each centre that scored below the average received less than the 30%, in proportion to how much lower than average its score was. Performance indicators included antibiotic prescription rates (oral and by injection) and measures of patient satisfaction. To prevent providers from reducing service volume under a capitation budget, the NCMS specified quantity thresholds. Providers who did not meet the threshold had to return prepaid funds to the NCMS. Control: Fee‐for‐service |
|
| Outcomes | Proportion of patient visits that included 1 or more prescriptions for antibiotics, total healthcare expenditure per visit, drug expenditure per visit, the number of patient consultations per day in a facility, and patient satisfaction 6 months to 12 months after intervention |
|
| Notes | Re‐analysis: RD to RR | |
| Risk of bias | ||
| Bias | Authors' judgement | Support for judgement |
| Random sequence generation (selection bias) | Low risk | "We flipped a coin to randomly assign one cluster from each pair to receive the policy intervention described above" |
| Allocation concealment (selection bias) | Low risk | The sequence and allocation occurred at the same time. |
| Baseline outcome measurements similar | Unclear risk | No baseline outcomes data and comparison |
| Baseline characteristics similar | Low risk | In the design process, designers paired clusters before randomly assigning them to the 2 groups, ensuring that the clusters in each pair were as similar as possible on a range of baseline characteristics. Baseline characteristics were compared, and there were no significant differences. |
| Incomplete outcome data (attrition bias) All outcomes | Unclear risk | No information on dropout rates of patients survey |
| Knowledge of the allocated interventions adequately prevented | Unclear risk | No information on whether the assessors were aware of the allocation |
| Study adequately protected against contamination | Low risk | "We also present evidence that there was little contamination — which occurs when a control group adopts incentives similar to those of the intervention group — across clusters." |
| Selective reporting (reporting bias) | Low risk | All outcomes are reported. |
| Other bias | Unclear risk | All towns agreed to their assignment after allocation. However, a small township health centre in the control group lost its manager after the intervention began. The county health bureau requested that 1 of the intervention township health centres (not in the same matched pair) assume management responsibility for the centre that had lost its manager. As a result, the centre in the control group was subjected to capitation plus pay‐for‐performance incentives. We therefore dropped the paired cluster to which this control centre belonged from our analysis. |
BCG: Bacillus Calmette–Guérin CBA: controlled before‐after study CHD: coronary heart disease DM: diabetes mellitus DPT3: diphtheria, pertussis (whooping cough), and tetanus vaccine GP: general practitioner HMIS: Health Management Information System IVD: ischaemic vascular disease LDL: low‐density lipoprotein MOPH: Ministry of Public Health NGO: non‐governmental organisation OR: odds ratio P4P: pay for performance RD: risk difference RR: risk ratio
Characteristics of excluded studies [ordered by study ID]
| Study | Reason for exclusion |
|---|---|
| Anell 2015 | This study is not a CBA study design. It just used the different times of starting the intervention to form the data before and after intervention, and then used these data to conduct difference‐in‐differences analysis. Different countries started the P4P at different years, and some countries stopped the P4P during the observation period of this study. |
| Arrowsmith 2014 | This study is not designed as an ITS study because it did not use the aggregated data for analysing the change in outcome measures. And it is not a repeated measure study neither because the analysis unit is practice, not individual. |
| Bonfrer 2013 | This study made use of the staggered rollout of a P4P program to apply a difference‐in‐difference analysis, but it was not a CBA design. |
| Bonfrer 2014b | Based on rollout of a P4P program to more areas. This study was similar to a CBA study and conducted difference‐in‐difference analysis, but was not a CBA study. |
| Campbell 2009 | Only reported 2 time points before the intervention and 2 time points after the intervention |
| Chang 2011 | Control group is not comparable, because it is also influenced by the intervention, and has very different characteristics from the intervention group. |
| Chang 2015 | Control group is not comparable, because control group has very different characteristics from the intervention group. |
| Chien 2010 | 2 kinds of study designs were applied in this study: for the CBA part, only 1 cluster in control group, and for the ITS part, no data points before interventions. |
| Coleman 2007 | This study is not strictly designed as ITS. It is more like a time series study that analysed the change trend of outcome measures from 1990 to first quarter of 2005, and attempted to find the relationship between policy and change in trend. For policy payment reform in 2004, the intervention time point is not very clear. It was mentioned that the intervention occurred in April 2004, but that the largest change in outcome occurred before the intervention, for which no explanation was provided. |
| Cornejo‐Ovalle 2015 | No control group, just a comparison of before and after intervention |
| Cuellar 2001 | The intervention was implemented in 2 areas of Colorado, but the control was implemented in only 1 area of Colorado. |
| Doran 2011 | This study was not designed as a real ITS. Firstly, it did not use real aggregated outcome measures, but the means of all practice‐level outcome measures. Secondly, it was not designed to analyse the change in trend due to interventions, but only analysed the differences between real outcome measures and the projected outcomes after intervention from trends in the pre‐intervention period. |
| Falisse 2015 | This study is not a CBA study design. It just made use of the rollout of a P4P program to more areas to form the before‐intervention and after‐intervention data, and the intervention started at different times in different areas. In addition, the P4P programs in different areas were not implemented by the same organization. |
| Feng 2015 | Created control group by matching methods to conduct difference‐in‐differences analysis, not a CBA design. |
| Gemmell 2009 | Only comparison between 2 time points (before and after intervention), no comparison group. |
| Hamilton 2014 | No data from before the intervention, only the comparison between patients eligible for intervention and the patients ineligible for intervention after intervention started. |
| He 2012 | In the analysis the intervention (OPPS) is only accounted for indirectly (using the yearly Medicare reimbursement rates and analysis of the elasticity), thus a single clearly defined point in time when the intervention occurred has not been implemented. The implementation of OPPS in 2000 was not incorporated in the analysis using a dichotomous variable, and the correlation of observations within hospitals was not taken into account. Re‐analysis required too much raw data, even re‐analysis of raw databases. |
| He 2013 | In the analysis the intervention (OPPS) is only accounted for indirectly (using the yearly Medicare reimbursement rates and analysis of the elasticity), thus a single clearly defined point in time when the intervention occurred has not been implemented. The implementation of OPPS in 2000 was not incorporated in the analysis using a dichotomous variable, and the correlation of observations within hospitals was not taken into account. Re‐analysis required too much raw data, even re‐analysis of raw databases. |
| Kirschner 2013 | Comparison before (1 time point) and after the intervention (3 time points), no comparison group |
| Kontopantelis 2012 | The characteristics of the control group were very different than those of the intervention group (patients with different kinds of diseases), therefore the two groups are not comparable. |
| Kontopantelis 2014 | Fewer than 3 time points before and after interventions for longitudinal ITS design |
| MacBride‐Stewart 2008 | This study is not strictly designed as an ITS. Firstly, the analysis was based on practice‐level data, not aggregated data. Secondly, the purpose of the analysis was not to find change in trend, but to analyse if the mean increase rate before and mean rate after payment reform were significantly different. |
| Odesjo 2015 | Controlled before‐after study design, but only 1 county in intervention group and 1 county in control group |
| Rosenthal 2005 | The intervention was implemented in only 1 state, while 2 states were used as the control group. |
| Simpson 2011 | Repeated cross‐sectional study to analyse the differences in outcome measures at 6 time points, and there was no explicitly and clearly defined intervention point. In addition, the analysis was logistic regression based on individual‐level data, but not ITS regression based on aggregate data. |
| Soeters 2005 | 2 control sites and 2 intervention sites. Firstly, 2 interventions at 2 sites were different in design and amount of payment for performance. Secondly, 2 control sites had different control interventions. Thirdly, control and intervention sites are not comparable in baseline 2001 for several conditions. |
| Unützer 2012 | A comparison between 2 time points (before and after intervention), no comparison group. |
| Vamos 2011 | Only 2 time points after the interventions |
| Vergeer 2008 | Only 1 site and 1 facility for comparison groups |
| Wei 2010 | Only 1 site (Taipei) in comparison and control group. Though there are many districts inside of Taipei, the common characteristics of Taipei still influence the effects of the payment method. Also, the target of payment is hospital. |
CBA: controlled before‐after study ITS: interrupted time series OPPS: outpatient prospective payment system P4P: pay for performance
Differences between protocol and review
For the subgroup analysis, we did not include two factors we had prespecified in the protocol because of insufficient data and information from the included studies. There are no other differences between protocol and review.
Contributions of authors
All review authors have contributed to the production of the review. Beibei Yuan, Liying Jia, and Qingyue Meng drafted and amended the protocol. Beibei Yuan, Liying Jia, and Li He applied the inclusion criteria, assessed the risk of bias, and extracted data for the included studies. Beibei Yuan and Li He prepared the report, and the other review authors commented on it.
Sources of support
Internal sources
No sources of support supplied
External sources
The Effective Health Care Research Consortium which is funded by UK aid from the UK Government for the benefit of developing countries, UK.
Declarations of interest
Beibei Yuan: None known.
Li He: None known.
Qingyue Meng: None known.
Liying Jia: None known.
New
References
References to studies included in this review
Alshamsan 2012 {published data only}
- Alshamsan R, Lee JT, Majeed A, Netuveli G, Millett C. Effect of a UK pay‐for‐performance program on ethnic disparities in diabetes outcomes: interrupted time series analysis. Annals of Family Medicine 2012 May‐Jun;10(3):228‐34. [DOI] [PMC free article] [PubMed] [Google Scholar]
An 2008 {published data only}
- An LC, Bluhm JH, Foldes SS, Alesci NL, Klatt CM, Center BA, et al. A randomized trial of a pay‐for‐performance program targeting clinician referral to a state tobacco quitline. Archives of Internal Medicine 2008;168(18):1993‐9. [DOI] [PubMed] [Google Scholar]
Bardach 2013 {published data only}
- Bardach NS, Wang JJ, Leon SF, Shih SC, Boscardin J, Goldman E, et al. Effect of pay‐for‐performance incentives on quality of care in small practices with electronic health records: a randomized trial. JAMA 2013;310(10):1051‐9. [DOI] [PMC free article] [PubMed] [Google Scholar]
Basinga 2011 {published data only}
- Basinga P, Gertler P, Binagwaho A, Soucat A, Sturdy J, Vermeersch C. Paying primary health care centers for performance in Rwanda. The World Bank, Human Development Network, Chief Economist's Office & Africa Region Health, Nutrition & Population Unit January 2010.
- Basinga P, Gertler PJ, Binagwaho A, Soucat ALB, Sturdy J, Vermeersch CML. Effect on maternal and child health services in Rwanda of payment to primary health‐care providers for performance: an impact evaluation. Lancet 2011;377:1421‐8. [DOI] [PubMed] [Google Scholar]
Bonfrer 2014a {published data only}
- Bonfrer I, Soeters R, Poel E, Basenya O, Longin G, Looij F, et al. Introduction of performance‐based financing in Burundi was associated with improvements in care and quality. Health Affairs (Millwood) 2014;33(12):2179‐87. [DOI] [PubMed] [Google Scholar]
Canavan 2008 {published data only}
- Canavan A, Swai G. Payment for performance (P4P) evaluation: Tanzania country report for Cordaid. KIT Development Policy & Practice, Amsterdam 2008.
Catalano 2000 {published data only}
- Catalano R, Libby A, Snowden L, Cuellar AE. The effect of capitated financing on mental health services for children and youth: the Colorado experience. American Journal of Public Health 2000;90:1861‐5. [DOI] [PMC free article] [PubMed] [Google Scholar]
Catalano 2005 {published data only}
- Catalano RA, Coffman JM, Bloom JR, Ma Y, Kang SH. The impact of capitated financing on psychiatric emergency services. Psychiatric Services 2005;56:685–90. [DOI] [PubMed] [Google Scholar]
Chien 2012 {published data only}
- Chien AT, Eastman D, Lib Z, Rosenthal MB. Impact of a pay for performance program to improve diabetes care in the safety net. Preventive Medicine 2012;55:S80–5. [DOI] [PMC free article] [PubMed] [Google Scholar]
Engineer 2016 {published data only}
- Engineer C, Dale E, Agarwal A, Agarwal A, Alonge A, Edward A, et al. Effectiveness of a pay‐for‐performance intervention to improve maternal and child health services in Afghanistan: a cluster‐randomized trial. International Journal of Epidemiology 2016;Feb 13:1‐9. [DOI] [PubMed] [Google Scholar]
Hillman 1998 {published data only}
- Hillman AL, Ripley K, Goldfarb N, Nuamah I, Weiner J, Lusk E. Physician financial incentives and feedback: failure to increase cancer screening in Medicaid managed care. American Journal of Public Health 1998;88(11):1699‐701. [DOI] [PMC free article] [PubMed] [Google Scholar]
Hillman 1999 {published data only}
- Hillman AL, Ripley K, Goldfarb N, Weiner J, Nuamah I, Lusk E. The use of physician financial incentives and feedback to improve pediatric preventive care in Medicaid managed care. Pediatrics 1999;104(4 Pt 1):931‐5. [DOI] [PubMed] [Google Scholar]
Lee 2011 {published data only}
- Lee JT, Netuveli G, Majeed A, Millett C. The effects of pay for performance on disparities in stroke, hypertension, and coronary heart disease management: interrupted time series study. PLoS One 2011;6(12):e27236. [DOI] [PMC free article] [PubMed] [Google Scholar]
McLintock 2014 {published data only}
- McLintock K, Russell AM, Alderson SL, West R, House A, Westerman K, et al. The effects of financial incentives for case finding for depression in patients with diabetes and coronary heart disease: interrupted time series analysis. BMJ Open 2014;4(8):e005178. [DOI] [PMC free article] [PubMed] [Google Scholar]
Petersen 2013 {published data only}
- Petersen LA, Simpson K, Pietz K, Urech TH, Hysong SJ, Profit J, et al. Effects of individual physician‐level and practice‐level financial incentives on hypertension care: a randomized trial. The Journal of the American Medical Association (JAMA) 2013;310(10):1042‐50. [DOI] [PMC free article] [PubMed] [Google Scholar]
Roski 2003 {published data only}
- Roski J, Jeddeloh R, An L, Lando H, Hannan P, Hall C, et al. The impact of financial incentives and a patient registry on preventive care quality: increasing provider adherence to evidence‐based smoking cessation practice guidelines. Preventive Medicine 2003;36:291‐9. [DOI] [PubMed] [Google Scholar]
Rudasingwa 2015 {published data only}
- Rudasingwa M, Soeters R, Bossuyt M. The effect of performance‐based financial incentives on improving health care provision in Burundi: a controlled cohort study. Global Journal of Health Science 2015;7(3):15‐29. [DOI] [PMC free article] [PubMed] [Google Scholar]
Serumaga 2011 {published data only}
- Serumaga B, Ross‐Degnan D, Avery AJ, Elliott RA, Majumdar SR, Zhang F, et al. Effect of pay for performance on the management and outcomes of hypertension in the United Kingdom: interrupted time series study. BMJ 2011;342:d108. [DOI] [PMC free article] [PubMed] [Google Scholar]
Soeters 2008 {unpublished data only}
- Soeters R, Kimakuka C. Results of the household survey, quality survey, and nursing survey [Résultats de l’enquête ménage, l’enquête qualité, et l’enquête infirmiers titulaires]. Pour le Programme Achat de Performance dans les Zones de Santé du District Sanitaire Nord du Sud Kivu (Performance Purchase Program in the Health Zones of the District North of South Kivu) February 2008.
Soeters 2011 {published data only}
- Soeters KR, Peerenboom PB, Mushagalusa P, Kimanuka C. Performance‐based financing experiment improved health care in the Democratic Republic Of Congo. Health Affairs 2011;30(8):1518‐27. [DOI] [PubMed] [Google Scholar]
Yip 2014 {published data only}
- Yip W, Powell‐Jackson T, Chen W, Hu M, Fe E, Hu M, et al. Capitation combined with pay‐for‐performance improves antibiotic prescribing practices In rural China. Health Affairs 2014;33(3):502‐10. [DOI] [PubMed] [Google Scholar]
References to studies excluded from this review
Anell 2015 {unpublished data only}
- Anell A, Dietrichson J, Ellegard L. Can pay‐for‐performance to primary care providers stimulate appropriate use of antibiotics?. Working paper, Department of Economics, School of Economics and Management, Lund University 2015. [DOI] [PMC free article] [PubMed]
Arrowsmith 2014 {published data only}
- Arrowsmith ME, Majeed A, Lee JT, Saxena S. Impact of pay for performance on prescribing of long‐acting reversible contraception in primary care: an interrupted time series study. PLoS One 2014;9(4):e92205. [DOI] [PMC free article] [PubMed] [Google Scholar]
Bonfrer 2013 {unpublished data only}
- Bonfrer I, Soeters R, Poel E, Basenya O, Longin G, Looij F, et al. The effects of performance‐based financing on the use and quality of health care in Burundi: an impact evaluation. Lancet 2013;381:S19. [Google Scholar]
Bonfrer 2014b {published data only}
- Bonfrer I, Poel E, Doorslaer E. The effects of performance incentives on the utilization and quality of maternal and child care in Burundi. Social Science & Medicine 2014;123:96‐104. [DOI] [PubMed] [Google Scholar]
Campbell 2009 {published data only}
- Campbell SM, Reeves D, Kontopantelis E, Sibbald B, Roland M. Effects of pay for performance on the quality of primary care in England. The New England Journal of Medicine 2009;361:368‐78. [DOI] [PubMed] [Google Scholar]
Chang 2011 {published data only}
- Chang RE, Hsieh CJ, Myrtle RC. The effect of outpatient dialysis global budget cap on healthcare utilization by end‐stage renal disease patients. Social Science & Medicine 2011;73:153‐9. [DOI] [PubMed] [Google Scholar]
Chang 2015 {published data only}
- Chang RE, Tsai YH, Myrtle RC. Assessing the impact of budget controls on the prescribing behaviours of physicians treating dialysis‐dependent patients. Health Policy and Planning 2015;30(9):1142‐51. [DOI] [PubMed] [Google Scholar]
Chien 2010 {published data only}
- Chien AT, Li Z, Rosenthal MB. Improving timely childhood immunizations through pay for performance in Medicaid‐managed care. Health Services Research 2010;45(6 Pt 2):1934‐47. [DOI] [PMC free article] [PubMed] [Google Scholar]
Coleman 2007 {published data only}
- Coleman T, Lewis S, Hubbard R, Smith C. Impact of contractual financial incentives on the ascertainment and management of smoking in primary care. Addiction 2007;102(5):803‐8. [DOI] [PubMed] [Google Scholar]
Cornejo‐Ovalle 2015 {published data only}
- Cornejo‐Ovalle M, Brignardello‐Petersen R, Pérez G. Pay‐for‐performance and efficiency in primary oral health care practices in Chile. Rev Clin Periodoncia Implantol Rehabil Oral 2015;8(1):60‐6. [Google Scholar]
Cuellar 2001 {published data only}
- Cuellar AE, Libby AM, Snowden LR. How capitated mental health care affects utilization by youth in the juvenile justice and child welfare systems. Mental Health Services Research 2001;3(2):61‐72. [DOI] [PubMed] [Google Scholar]
Doran 2011 {published data only}
- Doran T, Kontopantelis E, Valderas JM, Campbell S, Roland M, Salisbury C, et al. Effect of financial incentives on incentivised and non‐incentivised clinical activities: longitudinal analysis of data from the UK Quality and Outcomes Framework. BMJ 2011;342:d3590. [DOI] [PMC free article] [PubMed] [Google Scholar]
Falisse 2015 {published data only}
- Falisse J, Ndayishimiye J, Kamenyero V, Bossuyt M. Performance‐based financing in the context of selective free health‐care: an evaluation of its effects on the use of primary health‐care services in Burundi using routine data. Health Policy and Planning 2015;30:1251‐60. [DOI] [PubMed] [Google Scholar]
Feng 2015 {published data only}
- Feng Y, Ma A, Farrar S, Sutton M. The tougher the better: an economic analysis of increased payment thresholds on the performance of general practices. Health Economics 2015;24(3):353‐71. [DOI] [PubMed] [Google Scholar]
Gemmell 2009 {published data only}
- Gemmell I, Campbell S, Hann M, Sibbald B. Assessing workload in general practice in England before and after the introduction of the pay‐for‐performance contract. Journal of Advanced Nursing 2009;65(3):509‐15. [DOI] [PubMed] [Google Scholar]
Hamilton 2014 {published data only}
- Hamilton FL, Laverty AA, Gluvajic D, Huckvale K, Car J, Majeed A, et al. Effect of financial incentives on delivery of alcohol screening and brief intervention (ASBI) in primary care: longitudinal study. Journal of Public Health (Oxford) 2014;36(3):450‐9. [DOI] [PubMed] [Google Scholar]
He 2012 {published data only}
- He DF, Mellorb JM. Hospital volume responses to Medicare's outpatient prospective payment system: evidence from Florida. Journal of Health Economics 2012;31:730‐43. [DOI] [PubMed] [Google Scholar]
He 2013 {published data only}
- He DF, Mellorb JM. Do Changes in Hospital Outpatient Payments Affect the Setting of Care?. Health Services Research 2013;48(5):1593‐616. [DOI] [PMC free article] [PubMed] [Google Scholar]
Kirschner 2013 {published data only}
- Kirschner K, Braspenning J, Akkermans RP, Jacobs JEA, Grol R. Assessment of a pay‐for‐performance program in primary care designed by target users. Family Practice 2013;30:161‐71. [DOI] [PubMed] [Google Scholar]
Kontopantelis 2012 {published data only}
- Kontopantelis E, Doran T, Gravelle H, Goudie R, Siciliani L, Sutton M. Family doctor responses to changes in incentives for influenza immunization under the UK Quality and Outcomes Framework pay‐for‐performance scheme. Health Services Research 2012;47(3 Pt 1):1117‐36. [DOI] [PMC free article] [PubMed] [Google Scholar]
Kontopantelis 2014 {published data only}
- Kontopantelis E, Springate D, Reeves D, Ashcroft DM, Valderas JM, Doran T. Withdrawing performance indicators: retrospective analysis of general practice performance under UK Quality and Outcomes Framework. BMJ 2014;348:g330. [DOI] [PMC free article] [PubMed] [Google Scholar]
MacBride‐Stewart 2008 {published data only}
- MacBride‐Stewart SP, Elton R, Walley T. Do quality incentives change prescribing patterns in primary care? An observational study in Scotland. Family Practice 2008;25(1):27‐32. [DOI] [PubMed] [Google Scholar]
Odesjo 2015 {published data only}
- Odesjo H, Anell A, Gudbjornsdottir S, Thorn J, Bjorck S. Short‐term effects of a pay‐for‐performance programme for diabetes in a primary care setting: an observational study. Scandinavian Journal of Primary Health Care 2015;33(4):291‐7. [DOI] [PMC free article] [PubMed] [Google Scholar]
Rosenthal 2005 {published data only}
- Rosenthal MB, Frank RG, Li Z, Epstein AM. Early experience with pay‐for‐performance from concept to practice. The Journal of the American Medical Association (JAMA) 2005;294:1788‐93. [DOI] [PubMed] [Google Scholar]
Simpson 2011 {published data only}
- Simpson CR, Hannaford PC, Ritchie LD, Sheikh A, Williams D. Impact of the pay‐for‐performance contract and the management of hypertension in Scottish primary care: a 6‐year population‐based repeated cross‐sectional study. British Journal of General Practice 2011;61(588):e443‐51. [DOI] [PMC free article] [PubMed] [Google Scholar]
Soeters 2005 {published data only}
- Soeters R, Musango L, Meessen B. Comparison of two output based schemes in Butare and Cyangugu provinces with two control provinces in Rwanda. GBPOA, World Bank, Ministry of Health Rwanda 2005.
Unützer 2012 {published data only}
- Unützer J, Chan YF, Hafer E, Knaster J, Shields A, Powers D, et al. Quality improvement with pay‐for‐performance incentives in integrated behavioral health care. American Public Health Association 2012;102:e41‐5. [DOI] [PMC free article] [PubMed] [Google Scholar]
Vamos 2011 {published data only}
- Vamos EP, Pape UJ, Bottle A, Hamilton FL, Curcin V, Ng A, et al. Association of practice size and pay‐for‐performance incentives with the quality of diabetes management in primary care. Canadian Medical Association Journal (CMAJ) 2011;183(12):e809‐16. [DOI] [PMC free article] [PubMed] [Google Scholar]
Vergeer 2008 {published data only}
- Vergeer P, Chansa C. Payment for performance (P4P) evaluation: Zambia country report for Cordaid. KIT, Amsterdam 2008.
Wei 2010 {published data only}
- Wei CW, Wang SM, Yeh MK. Doctor pharmaceutical utilization behaviour changed by the global budget programme strategies on hypertensive outpatient prescription. Journal of Evaluation in Clinical Practice 2012;18:262‐8. [DOI] [PubMed] [Google Scholar]
Additional references
Barnum 1995
- Barnum H, Kutzin J, Saxenian H. Incentives and provider payment methods. International Journal of Health Planning and Management 1995;10:23‐45. [DOI] [PubMed] [Google Scholar]
Berman 2000
- Berman P. Organization of ambulatory care provision: a critical determinant of health system performance in developing countries. Bulletin of the World Health Organization 2000;78(6):791‐802. [PMC free article] [PubMed] [Google Scholar]
Conrad 2009
- Conrad DA, Perry L. Quality‐based financial incentives in health care: can we improve quality by paying for it?. Annual Review of Public Health 2009;30:357‐71. [DOI] [PubMed] [Google Scholar]
Deeble 1992
- Deeble JS. Health insurance and the structure of health services. World Bank. Background paper for the Hungary Health Care and Social Insurance Project 12 May 1992.
Emmert 2011
- Emmert M, Eijkenaar F, Kemter H, Esslinger AS, Schöffski O. Economic evaluation of pay‐for‐performance in health care: a systematic review. The European Journal of Health Economics 2012;13(6):755‐67. [DOI] [PubMed] [Google Scholar]
EPOC 2013a
- Effective Practice, Organisation of Care (EPOC). Good practice data extraction form. EPOC Resources for review authors. epocoslo.cochrane.org/epoc‐specific‐resources‐review‐authors (accessed 27 April 2015) 2013.
EPOC 2013b
- Effective Practice, Organisation of Care (EPOC). Interrupted time series (ITS) analyses. EPOC Resources for review authors. epocoslo.cochrane.org/epoc‐specific‐resources‐review‐authors (accessed 27 April 2015) 2013.
EPOC 2013c
- Effective Practice, Organisation of Care (EPOC). Suggested risk of bias criteria for EPOC reviews. Good practice data extraction form, EPOC Resources for review authors. epocoslo.cochrane.org/epoc‐specific‐resources‐review‐authors (accessed 27 April 2015) 2013.
EPOC 2013d
- Effective Practice, Organisation of Care (EPOC). Synthesising results when it does not make sense to do a meta‐analysis. Good practice data extraction form. EPOC Resources for review authors. epocoslo.cochrane.org/epoc‐specific‐resources‐review‐authors (accessed 27 April 2015) 2013.
Flodgren 2011
- Flodgren G, Eccles MP, Shepperd S, Scott A, Parmelli E, Beyer FR. An overview of reviews evaluating the effectiveness of financial incentives in changing healthcare professional behaviours and patient outcomes. Cochrane Database of Systematic Reviews 2011, Issue 7. [DOI: 10.1002/14651858.CD009255] [DOI] [PMC free article] [PubMed] [Google Scholar]
Gosden 2000
- Gosden T, Forland F, Kristiansen IS, Sutton M, Leese B, Giuffrida A, et al. Capitation, salary, fee‐for‐service and mixed systems of payment: effects on the behaviour of primary care physicians. Cochrane Database of Systematic Reviews 2000, Issue 3. [DOI: 10.1002/14651858.CD002215] [DOI] [PMC free article] [PubMed] [Google Scholar]
Guyatt 2008
- Guyatt GH, Oxman AD, Kunz R, Vist GE, Falck‐Ytter Y, Schunemann HJ. What is 'quality of evidence' and why is it important to clinicians?. BMJ 2008;336:995‐8. [DOI] [PMC free article] [PubMed] [Google Scholar]
Hirdes 1996
- Hirdes JP, Botz CA, Kozak J, Lepp V. Identifying an appropriate case mix measure for chronic care: evidence from an Ontario pilot study. Healthcare Management Forum 1996;9(1):40‐6. [DOI] [PubMed] [Google Scholar]
Houle 2012
- Houle SKD, McAlister FA, Jackevicius CA, Chuck AW, Tsuyuki RT. Does performance‐based remuneration for individual health care practitioners affect patient care? a systematic review. Annals of Internal Medicine 2012;157:889‐99. [DOI] [PubMed] [Google Scholar]
ILO/UNDP 1993
- International Labour Office (ILO) and United Nations Development Programme (UNDP). Thailand: report to the government on social security implementation and development. Part I: main policy issues and technical problems. Document THA/90/014(I) 1993.
Jia 2015
- Jia L, Yuan B, Meng Q, Scott A. Payment methods for ambulatory care health professionals. Cochrane Database of Systematic Reviews 2015, Issue 9. [DOI: 10.1002/14651858.CD011865] [DOI] [Google Scholar]
Langenbrunner 2009
- Langenbrunner JC, Cashin C, O' Dougherty S. Designing and implementing health care provider payment systems; how‐to manuals. The International Bank for Reconstruction and Development/The World Bank 2009.
Lee 2006
- Lee YC, Yang MC, Huang YT, Liu CH, Chen SB. Impacts of cost containment strategies on pharmaceutical expenditures of the National Health Insurance in Taiwan, 1996‐2003. Pharmacoeconomics 2006;24(9):891‐902. [DOI] [PubMed] [Google Scholar]
Mathes 2014
- Mathes T, Pieper D, Mosch CG, Jaschinski T, Eikermann M. Payment methods for hospitals. Cochrane Database of Systematic Reviews 2014, Issue 6. [DOI: 10.1002/14651858.CD011156] [DOI] [Google Scholar]
Oxman 2009
- Oxman AD, Fretheim A. Can paying for results help to achieve the Millennium Development Goals? Overview of the effectiveness of results‐based financing. Journal of Evidence‐Based Medicine 2009;2(2):70‐83. [DOI] [PubMed] [Google Scholar]
Pati 2005
- Pati S, Shea S, Rabinowitz D, Carrasquillo O. Health expenditures for privately insured adults enrolled in managed care gatekeeping vs indemnity plans. American Journal of Public Health 2005;95(2):286‐91. [DOI] [PMC free article] [PubMed] [Google Scholar]
Petersen 2006
- Petersen LA, Woodard LD, Urech T, Daw C, Sookanan S. Does pay‐for‐performance improve the quality of health care?. Annals of Internal Medicine 2006;145:265‐72. [DOI] [PubMed] [Google Scholar]
Schatz 2008
- Schatz M. Does pay‐for‐performance influence the quality of care?. Current Opinion in Allergy and Clinical Immunology 2008;8:213‐21. [DOI] [PubMed] [Google Scholar]
Scott 2011
- Scott A, Sivey P, Ait Ouakrim D, Willenberg L, Naccarella L, Furler J, et al. The effect of financial incentives on the quality of health care provided by primary care physicians. Cochrane Database of Systematic Reviews 2011, Issue 9. [DOI: 10.1002/14651858.CD008451.pub2] [DOI] [PubMed] [Google Scholar]
WHO 2000
- World Health Organization. Health systems: improving performance. World Health Report 2000.
Witter 2012
- Witter S, Fretheim A, Kessy FL, Lindahl AK. Paying for performance to improve the delivery of health interventions in low‐ and middle‐income countries. Cochrane Database of Systematic Reviews 2012, Issue 3. [DOI: 10.1002/14651858.CD007899.pub2] [DOI] [PubMed] [Google Scholar]
Wolfe 1993
- Wolfe PR, Moran DW. Global budgeting in the OECD countries. Health Care Financing Review 1993;14(3):5576. [PMC free article] [PubMed] [Google Scholar]