Abstract
We conducted a phase I dose-escalation study with 89Zr-desferrioxamine-IAB2M (89Zr-IAB2M), an anti–prostate-specific membrane antigen minibody, in patients with metastatic prostate cancer. Methods: Patients received 185 MBq (5 mCi) of 89Zr-IAB2M and Df-IAB2M at total mass doses of 10 (n = 6), 20 (n = 6), and 50 mg (n = 6). Whole-body and serum clearance, normal-organ and lesion uptake, and radiation absorbed dose were estimated, and the effect of mass escalation was analyzed. Results: Eighteen patients were injected and scanned without side effects. Whole-body clearance was monoexponential, with a median biologic half-life of 215 h, whereas serum clearance showed biexponential kinetics, with a median biologic half-life of 3.7 (12.3%/L) and 33.8 h (17.9%/L). The radiation absorbed dose estimates were 1.67, 1.36, and 0.32 mGy/MBq to liver, kidney, and marrow, respectively, with an effective dose of 0.41 mSv/MBq (1.5 rem/mCi). Both skeletal and nodal lesions were detected with 89Zr-IAB2M, most visualized by 48-h imaging. Conclusion: 89Zr-IAB2M is safe and demonstrates favorable biodistribution and kinetics for targeting metastatic prostate cancer. Imaging with 10 mg of minibody mass provides optimal biodistribution, and imaging at 48 h after injection provides good lesion visualization. Assessment of lesion targeting is being studied in detail in an expansion cohort.
Keywords: 89Zr- IAB2M, minibody, PSMA, prostate cancer imaging, dosimetry
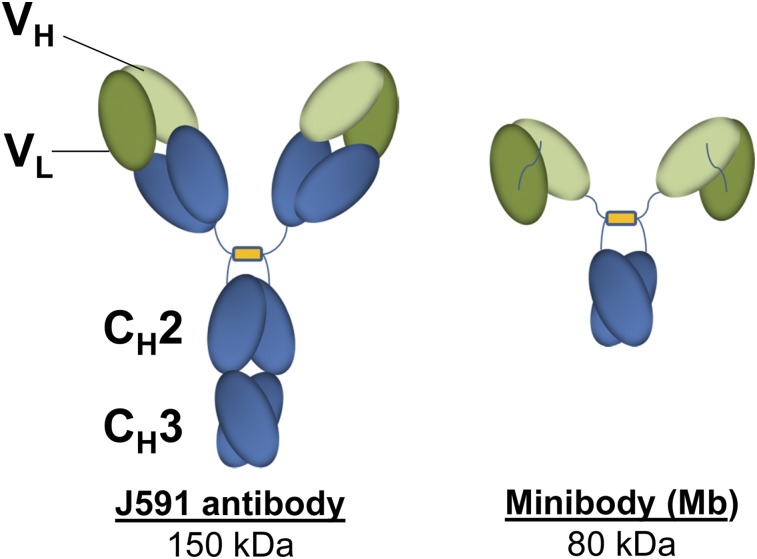
Currently, conventional imaging for metastatic prostate cancer (mPC) cannot reliably assess viable disease. We have previously shown the feasibility of using radiolabeled anti–prostate-specific membrane antigen (PSMA) antibodies to target prostate cancer (1–3). However, the optimal lesion detection is seen 6–8 d after injection because of slower blood clearance of the full antibody. Smaller molecules and antibody fragments such as minibodies and diabodies have faster clearance and reach higher tumor-to-background ratios earlier (4,5). Fragments below 60 kDa are filtered through the glomerular system, leading to significant kidney excretion (6–10)—less ideal for prostate cancer imaging. IAB2M is an 80-kDa minibody genetically engineered from the parent antibody J591 that targets the extracellular domain of PSMA (Fig. 1). The lack of Fc receptor interaction domains on the minibody makes it pharmacologically inert to Fc-mediated effector functions (7–9).
FIGURE 1.
Structure of intact antibody and IAB2M.
Preclinical studies demonstrated faster clearance and rapid biodistribution with efficient target penetration, allowing for high-contrast images within a few hours after injection (11–13). In mice, 89Zr-IAB2M (14) showed properties similar to 89Zr-huJ591 antibody but with significantly faster blood clearance and high uptake at 24 h after injection in PSMA-positive tissue (15).
In view of the preclinical data, 89Zr-IAB2M may facilitate earlier lesion detection in patients than its full parent antibody. As an initial component of analytic validation for biomarkers for advanced prostate cancer (16), we performed this first-in-human evaluation of 89Zr-IAB2M imaging in patients with mPC.
MATERIALS AND METHODS
This is a prospective phase I/IIa, open-label, nonrandomized, single-dose imaging study with 89Zr-IAB2M performed under an Investigational New Drug application (IND #118810). The protocol was Institutional Review Board–approved, and all patients provided written informed consent (trial registration ID: NCT01923727).
Patients
Patient eligibility required histologically confirmed prostate cancer and progressive disease by imaging, defined as new lesions on 99mTc-methylene diphosphonate (99mTc-MDP) bone scanning or increase in size or new sites of soft-tissue disease on CT or MRI or by biochemical criteria.
The aims of the study were to evaluate the safety and feasibility of 89Zr-IAB2M in mPC; assess pharmacokinetics, biodistribution, and radiation dosimetry; and determine optimal mass dose and imaging time for lesion detection.
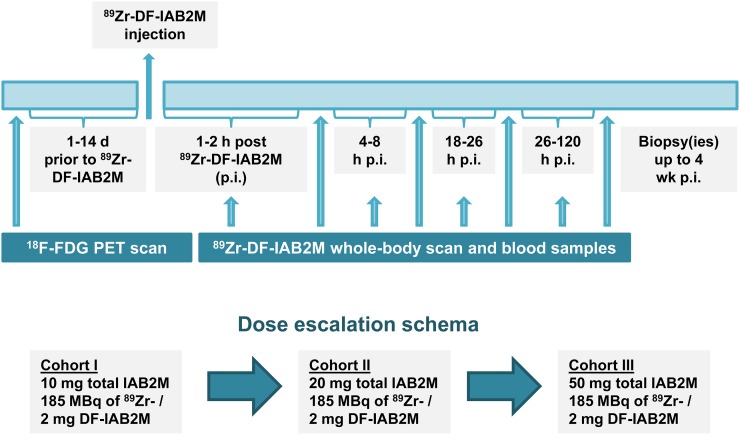
All patients underwent baseline imaging including 99mTc-MDP, CT, or MRI and 18F-FDG PET scans obtained as standard of care within 4 wk of 89Zr-IAB2M administration. The total IAB2M mass dose was escalated from 10 to 20 to 50 mg in 3 cohorts of 6 patients each. All patients underwent multiple serial imaging, whole-body (WB) count measurements, and blood sampling (Fig. 2).
FIGURE 2.
Study schema. p.i. = after injection.
89Zr-IAB2M Minibody Formulation and Injection
IAB2MT was supplied by Catalent Pharma Solutions. Desferrioxamine was obtained from Macrocyclics and conjugated to IAB2M under good manufacturing practice guidelines at Isotherapeutics Group and supplied in vials to Memorial Sloan Kettering for radiolabeling (17). 89Zr radionuclide production and radiolabeling of Df-IAB2M was performed using previously described methods (14,18). 89Zr was labeled to 2–3 mg of Df-IAB2M. The radiolabeling efficiency was greater than 80%; radiochemical purity was greater than 95%, as determined by instant thin-layer chromatography; and immunoreactivity was greater than 90%, as determined by Lindmo cell binding assay (19).
89Zr-IAB2M Administration
The radiolabeled minibody was administered intravenously over 5–10 min in combination with cold Df-IAB2M to make up the designated total mass balance for the specific cohort. No premedications were administered. Patients were monitored for at least 1 h after injection for any reactions or adverse events; side effects and reactions were graded per Common Terminology Criteria for Adverse Events 4.0 criteria.
Blood samples were evaluated at baseline and approximately 1 mo after injection for human antihuman antibody (HAHA), performed at Intertek using a good laboratory practice–validated electrochemiluminescent assay.
PET Imaging
Each patient underwent 4 WB PET/CT scans including vertex to mid thigh; lower extremities were included in those with known lesions by conventional imaging. Emission scans were acquired on a GE Discovery STE scanner in 3-dimensional mode for 3 min per field of view on the day of injection, 24 h after injection, 48–72 h after injection (5 min/field of view), and 96–120 h (7 min/field of view). PET/CT scans were obtained with a low-dose CT for attenuation correction (single scan with 80-mA current and 3 with 10-mA current). Images were reconstructed using ordered-subset expectation maximization parameters (2 iterations; 16 subsets) and attenuation correction.
WB counts were also obtained using a probe with NaI (Tl) scintillation detector at a fixed geometry (3 m from probe to patient). Measurements were taken after 89Zr-IAB2M infusion, first before voiding after injection, immediately after first voiding, and at each later imaging time point (5 total). Background-corrected geometric mean values were used for clearance curve fitting.
Serum Clearance Measurements
Multiple blood samples were measured for activity concentration to obtain percentage injected activity/L. Samples included a baseline sample before 89Zr-Df-IAB2M infusion; followed by 5, 15, 30, 60, and 120–240 min after injection; and subsequently at the time of each PET scan, totaling 7–8 samples.
Derivation of WB and Serum Kinetic Parameters
WB activity data and serum activity data were fitted using the SAAM II software application (20). Values of cumulated activity per unit administered activity (residence time) for WB (in h) and serum (in h/L), τ, were calculated according to the formula , where Ã, the cumulated activity, was estimated by integrating the time–activity curve and administered activity (A0). Effective and biologic clearance rates and corresponding half-times were derived from the fitted curves.
Uptake in Normal Organs and Lesions
Regions of interest were drawn on images within normal organs and target lesions using dedicated software (Hermes Medical Solutions). A subset of index lesions (maximum of 5 per patient) was analyzed for uptake trends using mean SUV adjusted to lean body mass (SUVLBM) for organs and SUVmax for lesions (21). Activity concentration–time area under the curve (AUC) correlates were estimated by trapezoidal integration. Whole-organ AUCs were estimated by multiplying the activity concentration AUC by organ mass.
Baseline values of organ mass representing standard mean were taken from the OLINDA/EXM software application (22); rescaling was performed if the actual patient mass differed by more than 15% from the standard value (73.7 kg), per prior method (23). Residence times were derived by dividing the whole-organ AUC by the administered activity. Corresponding values for heart contents and red marrow were derived from serum (24). Residence times for the remainder of body were derived by subtracting all individually estimated residence times from the WB residence time. Absorbed radiation doses to the WB and various organs were calculated using the OLINDA/EXM software application (22).
RESULTS
Eighteen patients with mPC were studied (Supplemental Table 1; supplemental materials are available at http://jnm.snmjournals.org). Injection was tolerated well, with no reactions seen in any patients. The mean injected activity was 188.7 ± 2.96 MBq (5.1 ± 0.8 mCi), and mean mass of radiolabeled minibody was 1.86 ± 0.35 mg.
HAHA analysis showed immunoreactivity to Df-IAB2M in 3 of 16 evaluable samples. The titers ranged from 25 to 625 and did not correlate with total protein dose, nor were they associated with any side effects that differentiated them from patients who did not generate HAHA. A repeated serum IgG analysis in these patients showed no significant increase in IgG subclasses 1–4.
WB and Serum Kinetics
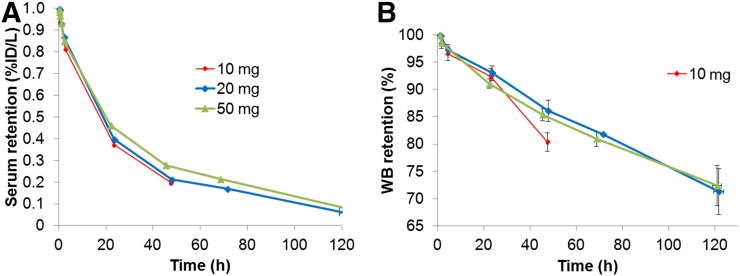
The WB clearance conformed to monoexponential function (Fig. 3). The median WB biologic half-lives for 10, 20, and 50 mg were 142.9 h (range, 118.7–256.7 h), 222.0 h (range, 165.0–364.8 h), and 235.8 h (range, 210.7–450.1 h), respectively (Table 1). WB clearance was slower at the higher mass (50 mg) than the lower masses (10 and 20 mg). Effective half-lives for WB clearance (P = 0.04) for 10 versus 20 mg and 10 versus 50 mg (P = 0.01) were significantly different, whereas no significant difference was seen between 20 versus 50 mg (P = 0.54).
FIGURE 3.
Serum (A) and WB clearance (B) of 89Zr-IAB2M shown in aggregate mean values of biologic (i.e., decay-corrected) activity retention. %ID = percentage injected dose.
TABLE 1.
WB and Serum Kinetic Parameters
| Parameter | 10 mg | 20 mg | 50 mg | Overall mean ± SD |
| WB biologic half-life (h) | 143 (119–257) | 222 (165–365) | 236 (211–450) | 225 ± 82 |
| WB effective half-life (h) | 51 (47–60) | 58 (53–65) | 59 (57–67) | 57 ± 5 |
| Serum A1 (%/L) | 8 (5–14) | 12 (6–23) | 13 (9–16) | 12 ± 5 |
| Serum α effective half-life (h) | 3.1 (1.2–5.7) | 5.0 (1.9–8.0) | 6.3 (2.2–8.9) | 5 ± 3 |
| Serum A2 (%/L) | 18 (15–27) | 18 (14–29) | 18 (13–27) | 19 ± 5 |
| Serum β effective half-life (h) | 19 (17–27) | 22 (19–27) | 28 (25–32) | 24 ± 5 |
Data are median, with range in parentheses.
Serum clearance was biexponential, characterized by an initial rapid phase followed by a slow phase. The average effective half-times were 4.8 ± 2.5 h (range, 1.2–8.9 h) for the fast component and 23.8 ± 4.6 h (range, 17.4–32.3 h) for the slow component (Fig. 3A; Table 1). The mean AUC was 1,038 ± 290 percentage injected dose h/L, maximum concentration in serum was 31.2 ± 6.3 percentage injected dose/L, and volume of distribution was 3.3 ± 0.7 L.
A tendency toward slower serum clearance was apparent at higher minibody mass; significant differences were noted for both 20- and 50-mg minibody doses compared with the lowest mass dose (10 mg) (Fig. 3; Table 1). The intergroup differences also reflect the modification of the data collection scheme partway through cohort II (20 mg) to include a later time point. Although no significant difference between early- or late-phase effective or biologic clearance was observed between 10- versus 20-mg doses, significant differences were seen for the late-phase effective as well as biologic clearance for both 10- and 20- versus 50-mg minibody level (P = 0.01).
Biodistribution
Prominent activity was seen in the blood pool, which decreased with time (Fig. 4A). Increased liver and gastrointestinal tract activity was seen over time, and renal activity increased with plateau beyond 48 h. No significant activity was seen in the bladder, and no significant urinary clearance was noted; the WB counts before and after first void showed an average postvoid value of 98.6% ± 3.1% of the prevoid activity. Gallbladder activity was seen in some patients and was more prominent in earlier images up to 24 h, thereafter decreasing with time. Activity seen in the gastrointestinal tract was more prominent in later images, suggesting possible hepatobiliary clearance (range, 1%–10%; median value, 5%). Mild diffuse uptake was seen in the spleen, decreasing over time. Minimal activity was seen in bone in delayed imaging, with no significant uptake in the lung. The distribution appeared similar for all IAB2M mass doses on PET/CT imaging (Fig. 4).
FIGURE 4.
Biodistribution of 89Zr-IAB2M in a patient: 10 mg of IAB2M mass (A), 20 mg of IAB2M mass (B), and 50 mg of IAB2M mass (C).
Normal-Organ Uptake
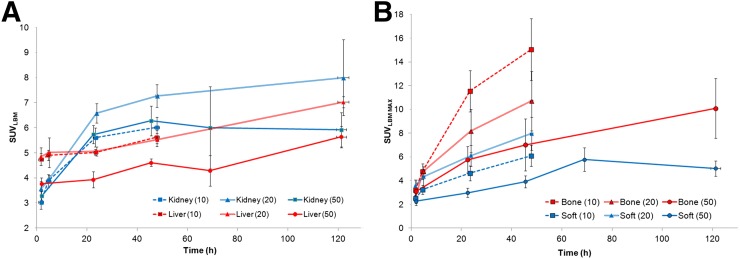
Liver uptake was characterized by a gradual increase over time but did not plateau (Fig. 5A). SUVmaxLBM at 48 h after injection ranged between 4.5 and 5.5 (mean, 5.3 ± 0.7) rising to 5.5–7.0 (mean, 6.1 ± 1.0) at 120 h after injection in patients for whom later imaging was performed. Renal uptake also increased with time and plateaued at 48 h after injection (SUVmaxLBM range, 6–8; mean, 6.5 ± 1.3).
FIGURE 5.
(A) Normal-organ uptake. (B) Lesion uptake.
A reduction in liver uptake was noted at the highest mass dose, whereas no definite relationship between mass dose and renal uptake was apparent. Uptake in the spleen was highest in initial imaging (∼2 h after injection) and diminished thereafter, likely relating to blood-pool activity. Typical SUVLBM for the spleen was approximately 3 at 48 h after injection and later. Uptake in normal bone was low, with SUVLBM values in the range of 0.3–1.5.
Radiation Doses to Normal Organs
The average absorbed radiation dose estimates are summarized in Table 2. A mass-based rescaling was used in 10 of 18 patients, and the maximum effective mass was invoked in 3 of 10 cases. No significant differences were noted in normal organ radiation absorbed doses among the 3 89Zr-IAB2M mass dose groups. The highest organ dose was observed for the liver (1.67 ± 0.30 mGy/MBq), followed by kidney (1.36 ± 0.26 mGy/MBq).
TABLE 2.
Absorbed Radiation Dose Estimates (mGy/MBq) of 89Zr-IAb2M to Organs
| All patients |
|||||
| Target organ | Mean | Minimum to maximum | Cohort I mean | Cohort II mean | Cohort III mean |
| Adrenals | 0.53 (0.06) | 0.43–0.67 | 0.51 (0.05) | 0.57 (0.08) | 0.52 (0.05) |
| Brain | 0.17 (0.04) | 0.11–0.24 | 0.15 (0.03) | 0.17 (0.04) | 0.19 (0.03) |
| Breasts | 0.22 (0.03) | 0.17–0.28 | 0.21 (0.03) | 0.23 (0.04) | 0.24 (0.03) |
| Gallbladder wall | 0.73 (0.11) | 0.52–0.94 | 0.71 (0.11) | 0.81 (0.11) | 0.68 (0.09) |
| Lower large intestine wall | 0.49 (0.13) | 0.29–0.74 | 0.51 (0.15) | 0.49 (0.13) | 0.48 (0.14) |
| Small intestine | 0.36 (0.06) | 0.26–0.46 | 0.34 (0.06) | 0.37 (0.07) | 0.36 (0.05) |
| Stomach wall | 0.35 (0.05) | 0.27–0.43 | 0.33 (0.04) | 0.36 (0.06) | 0.36 (0.04) |
| Upper large intestine wall | 0.45 (0.08) | 0.31–0.58 | 0.45 (0.09) | 0.46 (0.09) | 0.44 (0.09) |
| Heart wall | 0.69 (0.09) | 0.52–0.85 | 0.63 (0.06) | 0.70 (0.12) | 0.74 (0.04) |
| Kidneys | 1.36 (0.26) | 1.02–1.87 | 1.30 (0.23) | 1.53 (0.29) | 1.26 (0.18) |
| Liver | 1.67 (0.3) | 0.99–2.34 | 1.71 (0.24) | 1.83 (0.32) | 1.46 (0.24) |
| Lungs | 0.52 (0.08) | 0.39–0.71 | 0.53 (0.05) | 0.52 (0.11) | 0.50 (0.08) |
| Muscle | 0.25 (0.04) | 0.19–0.33 | 0.23 (0.03) | 0.26 (0.05) | 0.27 (0.03) |
| Pancreas | 0.5 (0.06) | 0.4–0.63 | 0.47 (0.05) | 0.52 (0.08) | 0.50 (0.04) |
| Red marrow | 0.32 (0.05) | 0.23–0.41 | 0.29 (0.04) | 0.33 (0.07) | 0.34 (0.04) |
| Osteogenic cells | 0.34 (0.07) | 0.23–0.46 | 0.30 (0.05) | 0.35 (0.09) | 0.36 (0.06) |
| Skin | 0.17 (0.03) | 0.12–0.23 | 0.16 (0.03) | 0.18 (0.04) | 0.18 (0.03) |
| Spleen | 0.76 (0.16) | 0.49–1.14 | 0.71 (0.10) | 0.76 (0.25) | 0.80 (0.08) |
| Testes | 0.19 (0.04) | 0.13–0.27 | 0.17 (0.04) | 0.19 (0.05) | 0.21 (0.04) |
| Thymus | 0.31 (0.05) | 0.22–0.39 | 0.28 (0.03) | 0.31 (0.06) | 0.33 (0.04) |
| Thyroid | 0.21 (0.04) | 0.15–0.3 | 0.19 (0.04) | 0.22 (0.05) | 0.24 (0.04) |
| Urinary bladder wall | 0.25 (0.05) | 0.18–0.36 | 0.23 (0.04) | 0.26 (0.06) | 0.28 (0.04) |
| Total body | 0.3 (0.04) | 0.23–0.37 | 0.28 (0.04) | 0.31 (0.05) | 0.31 (0.04) |
| Effective dose equivalent (mSv/MBq) | 0.54 (0.07) | 0.43–0.68 | 0.52 (0.05) | 0.57 (0.09) | 0.53 (0.04) |
| Effective dose (mSv/MBq) | 0.41 (0.06) | 0.3–0.51 | 0.40 (0.05) | 0.43 (0.08) | 0.41 (0.04) |
Lesion Targeting in Patients
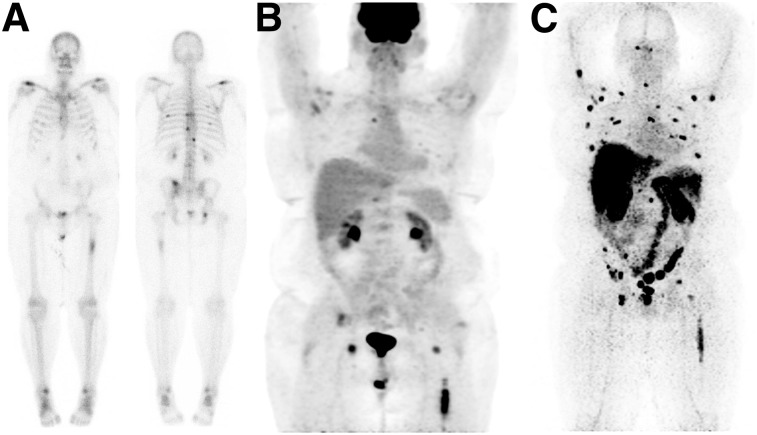
89Zr-IAB2M antibody scans were positive in a total of 17 of 18 patients (Figs. 4 and 6), with bone lesions targeted in 9 of 18 patients and soft-tissue disease seen in 14 of 18 patients. In comparison, bone scanning (99mTc-MDP) and 18F-FDG results were positive in 9 of 18 and 6 of 18 patients for bone lesions, respectively, whereas for nodal/soft-tissue disease, CT and 18F-FDG scan results were positive in 14 of 18 and 10 of 18 patients, respectively. In 2 patients, a single site of disease per patient was identified only by the 89Zr-IAB2M scan. 89Zr-IAB2M imaging detected a total of 147 bone and 82 soft-tissue or nodal lesions. Pathology correlation in 12 lesions showed concordance of scan and pathology findings in 11 patients.
FIGURE 6.
Lesion targeting with 89Zr-IAB2M in mPC patient. (A) 99mTc-MDP bone scan shows lesions in vertebrae and ribs. (B) 18F-FDG PET scan shows uptake in left femur and faint uptake in vertebral lesions. (C) 89Zr-IAB2M imaging shows more images than bone scanning or 18F-FDG (arrows).
Uptake of 89Zr-IAB2M in Lesions
SUV trend was examined in 25 bone and 39 soft-tissue lesions. Lesions were seen as early as 24 h after injection with increased lesion number and SUV seen at 48 h (Fig. 4) and 72–120 h; generally, the highest uptake was seen at the last imaging time point (Figs. 4B and 5B). Higher uptake was seen in bone lesions (SUVmax, 13.8 ± 8.6; range, 2.5–42) than in soft tissue (SUVmax, 7.0 ± 3.5; range, 2.7–14.7). The SUVmax for bone lesions at 48 h was 29.6, 19.5, and 8.7 for 10, 20, and 50 mg, respectively, whereas for soft-tissue or nodal lesions it was 14.7, 14.8, and 7.7, respectively. The SUVmax tumor-to-normal background ratios ranged from 1.9 to 45.8 at 48 h and 1.4 to 97.6 at 72–120 h for bone lesions, and 1.0 to 30.2 at 48 h and 1.3 to 35.6 at 72–120 h for soft tissue (Supplemental Fig. 1).
The highest uptake was seen in the 10-mg cohort, mostly related to high bone uptake, compared with the 20- and 50-mg cohorts; however, it was significant for 10 versus 50 mg only (P = 0.04). In soft-tissue lesions, uptake was slightly higher at 20 than 10 mg; however, this is limited by the smaller number of lesions (n = 8). Generally, uptake was lower in both bone and soft-tissue lesions at 50 mg than 10 or 20 mg (P = 0.04 and 0.02, respectively). The tumor-to-normal background ratio for lesions in different antibody mass cohorts at 48 h ranged from 3.8 to 26.2 in cohort I, 1.9 to 45.9 for cohort II, and 4.6 for 6.0 for cohort III for bone lesions (all intercohort comparisons were significant), whereas for soft tissue the tumor-to-normal background ratio ranged between 2.4 and 12.6, 5.2 and 28.7, and 1.0 and 11.2, respectively, for cohorts I, II, and III. These were nonsignificant for 10 versus 20 mg (P = 0.09) but significant for 10 versus 50 mg and 20 versus 50 mg (P = 0.03 and 0.02, respectively).
Although lesions were detectable as early as 24 h after injection with 89Zr-IAB2M imaging, more lesions were detectable at later time points at 48 h in all cohorts. Delayed imaging at 72–120 h after injection was performed in 9 patients (3 patients at 20 mg and 6 patients at 50 mg of minibody mass) that showed an additional 7 lesions in 3 patients (1 bone lesion in the 20-mg cohort and 6 nodes in the 50-mg cohort) at 120-h imaging. Of these, a single additional bone lesion was seen in a rib that was negative on other concurrent imaging. Other additional detected lesions included 5 nodes in the cervical or axillary region with an SUV range of 1.9–5.6 that were subcentimeter in size (0.3–0.5 cm) and negative by CT and 18F-FDG, with no disease noted on follow-up studies. An additional subcentimeter (0.7 cm) inguinal node (SUV, 4.8) seen in another patient remained stable in follow-up studies; other inguinal nodes were also noted in this patient, and the most prominent one was biopsied and found to be negative on pathology.
Pathology correlation obtained for 5 bone and 7 soft-tissue lesions showed 4 of 4 true-positive bone lesions and 1 true-negative bone lesion for 89Zr-IAB2M; correlation for soft-tissue lesions showed 6 of 7 true-positive lesions for 89Zr-IAB2M. Ten of 10 pathology-positive lesions for metastatic disease were positive on 89Zr-IAB2M.
DISCUSSION
Despite the availability of multiple imaging modalities and advances in imaging techniques, accurate assessment of metastatic disease in prostate cancer remains limited with standard imaging, emphasizing the need for novel and improved molecular imaging methods that allow direct visualization of tumors. Radiolabeled choline PET imaging has been shown to target disease (25); however, this is not routinely available in the United States. Recently, small-molecule targeting agents directed against PSMA have been evaluated, allowing earlier imaging (2,3,26,27). As an ongoing programmatic effort to develop biomarkers for prostate cancer (3), we continue to explore novel imaging and therefore undertook this phase I imaging study with the small antibody fragment IAB2M.
89Zr-IAB2M is easy to administer and well tolerated with no observed infusion-related side effects. A higher titer for HAHA was detected in 3 patients. Assuming that an increase in IgG2 would indicate a possible HAHA interference with the assay for serum IgG detection, thereby suggesting functionality and clinical significance, no significant increase in IgG subclasses was noted in any patients (28).
The biodistribution of 89Zr-IAB2M was broadly similar to that of the parent full-size antibody 89Zr-huJ591 (3). The mechanism of liver accumulation is likely multifactorial, including reactivity with PSMA, minibody metabolism, and retention of metabolized radiometal. Tracer accumulation in kidneys was again primarily in the renal cortex, probably due to known PSMA expression in the tubules, with no activity in the pelvicalyceal system or urine as expected based on size—an advantage over smaller molecules, making it more desirable for prostate cancer imaging by eliminating interference from urinary activity in the ureters and bladder. No significant salivary gland or lacrimal gland uptake was seen, unlike small-molecule PSMA ligands (29).
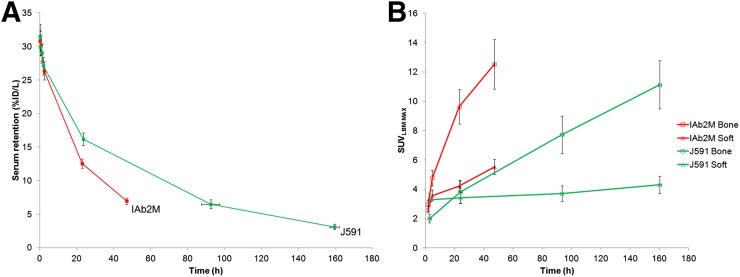
As expected, serum clearance was faster for 89Zr-IAB2M minibody than 89Zr-huJ591 (Fig. 7A), allowing for earlier lesion detection within 24–48 h versus 6–8 d with 89Zr-huJ591 (Fig. 7B). Organ radiation doses were broadly similar between 89Zr-IAB2M and 89Zr-huJ591 (Supplemental Fig. 2); the liver received the highest radiation dose with minibody, similar to the full antibody, but uptake was overall slightly less with the minibody (1.67 mGy/MBq for 89Zr-IAB2M vs. 2.08 for 89Zr-huJ591).
FIGURE 7.
89Zr-IAB2M vs. 89Zr-J591: serum clearance (A) and lesion uptake (B).
The findings suggest that 10-mg mass of 89Zr-IAB2M allows for optimal biodistribution for imaging. The minibody mass escalation resulted in slower WB and serum clearance with higher masses—an observation consistent with previous antibody studies (1,2,30). No significant difference in biodistribution between 10- and 20-mg minibody dose was noted. Although a suggestion of decreased liver uptake at the 50-mg minibody dose was observed, the difference was small and nonsignificant (P = 0.10 for 10 vs. 50 mg). No consistent pattern was seen between renal uptake and IAB2M mass, suggesting that the mild uptake seen was probably related to receptor-based uptake in renal tubules, with no significant effect of minibody mass on the uptake.
Lesion targeting was seen at all IAB2M mass doses. Lesion uptake (SUV) between 10- and 20-mg minibody dose was not significantly different. Although higher uptake values were seen in lesions at the 10- to 20-mg levels than the 50-mg minibody dose (Supplemental Fig. 1), this finding is limited by variations in the disease extent and bone versus soft-tissue extent of metastatic disease in patients within each cohort, and is hence not conclusive. The initial 10- and 20-mg patient cohorts had a greater preponderance of bone lesions whereas most patients in the 50-mg cohort had predominantly soft-tissue lesions, which may contribute to the apparent differences in lesion uptake and the observed mass effects, thereby limiting the comparison among the cohorts. Further assessment is ongoing in an expansion cohort to assess any possible differences between 10 versus 20 mg for lesion uptake and detection. However, the initial analysis suggests that 10-mg minibody is adequate for imaging.
These data support the ability of 89Zr-IAB2M minibody imaging to detect lesions earlier than full antibodies (3). On the basis of the initial results of visual assessment of lesion detection and lesion uptake patterns (Supplemental Fig. 1), imaging at 48 h after injection provides good visualization of both bone and soft-tissue lesions. In this preliminary analysis, no significant incremental lesion detection was noted for osseous sites beyond 48 h after injection. A single additional bone site noted on the delayed imaging was not confirmed by other imaging. Although more nodal sites were detected at 120 h after injection, these were likely not related to true disease, based on stability or resolution noted on follow-up clinical and imaging data. Although this finding must be confirmed in a larger group of patients, it is possible that nonspecific uptake in benign/inflammatory sites may occur that may be more prominently seen in delayed imaging.
In our study, we injected patients with approximately 185 MBq (5 mCi) of 89Zr-Df-IAB2M minibody for imaging. Imaging patients with lower activity of 89Zr is possible, as has been previously reported (31). Additionally, because of high contrast and relatively earlier imaging of lesions by 48 h after injection, we anticipate that adequate lesion detection may be achieved with lower levels of 89Zr than used in this study. A detailed analysis of lesion targeting in a larger patient cohort and assessment of imaging with lower injected activity dosing is under way.
CONCLUSION
PET imaging with 89Zr-Df-IAB2M is feasible and well tolerated, shows favorable biodistribution in patients with advanced prostate cancer, and targets both bone and soft-tissue lesions. Imaging with a 10-mg minibody mass provides optimal biodistribution, and imaging at 48 h after injection provides good visualization of lesions. Further analysis of lesion detection is ongoing in an expanded study.
DISCLOSURE
The costs of publication of this article were defrayed in part by the payment of page charges. Therefore, and solely to indicate this fact, this article is hereby marked “advertisement” in accordance with 18 USC section 1734. Research support was provided by ImaginAb, Inc., DOD Clinical Consortium (#PC071610), and MSK’s Radiochemistry & Molecular Imaging Probe Core and Biostatistics Core (CCSG P30 CA008748). No other potential conflict of interest relevant to this article was reported.
Supplementary Material
REFERENCES
- 1.Pandit-Taskar N, O’Donoghue JA, Morris MJ, et al. Antibody mass escalation study in patients with castration-resistant prostate cancer using 111In-J591: lesion detectability and dosimetric projections for 90Y radioimmunotherapy. J Nucl Med. 2008;49:1066–1074. [DOI] [PMC free article] [PubMed] [Google Scholar]
- 2.Morris MJ, Divgi CR, Pandit-Taskar N, et al. Pilot trial of unlabeled and indium-111-labeled anti-prostate-specific membrane antigen antibody J591 for castrate metastatic prostate cancer. Clin Cancer Res. 2005;11:7454–7461. [DOI] [PubMed] [Google Scholar]
- 3.Pandit-Taskar N, O’Donoghue JA, Beylergil V, et al. 89Zr-huJ591 immuno-PET imaging in patients with advanced metastatic prostate cancer. Eur J Nucl Med Mol Imaging. 2014;41:2093–2105. [DOI] [PMC free article] [PubMed] [Google Scholar]
- 4.Knowles SM, Wu AM. Advances in immuno-positron emission tomography: antibodies for molecular imaging in oncology. J Clin Oncol. 2012;30:3884–3892. [DOI] [PMC free article] [PubMed] [Google Scholar]
- 5.Olafsen T, Sirk SJ, Olma S, Shen CK, Wu AM. ImmunoPET using engineered antibody fragments: fluorine-18 labeled diabodies for same-day imaging. Tumour Biol. 2012;33:669–677. [DOI] [PubMed] [Google Scholar]
- 6.Wong JY, Chu DZ, Williams LE, et al. Pilot trial evaluating an 123I-labeled 80-kilodalton engineered anticarcinoembryonic antigen antibody fragment (cT84.66 minibody) in patients with colorectal cancer. Clin Cancer Res. 2004;10:5014–5021. [DOI] [PubMed] [Google Scholar]
- 7.Wu AM, Olafsen T. Antibodies for molecular imaging of cancer. Cancer J. 2008;14:191–197. [DOI] [PubMed] [Google Scholar]
- 8.Wu AM. Engineered antibodies for molecular imaging of cancer. Methods. 2014;65:139–147. [DOI] [PMC free article] [PubMed] [Google Scholar]
- 9.Wu AM. Antibodies and antimatter: the resurgence of immuno-PET. J Nucl Med. 2009;50:2–5. [DOI] [PubMed] [Google Scholar]
- 10.Freise AC, Wu AM. In vivo imaging with antibodies and engineered fragments. Mol Immunol. 2015;67:142–152. [DOI] [PMC free article] [PubMed] [Google Scholar]
- 11.Wu AM, Senter PD. Arming antibodies: prospects and challenges for immunoconjugates. Nat Biotechnol. 2005;23:1137–1146. [DOI] [PubMed] [Google Scholar]
- 12.Leyton JV, Olafsen T, Lepin EJ, et al. Humanized radioiodinated minibody for imaging of prostate stem cell antigen-expressing tumors. Clin Cancer Res. 2008;14:7488–7496. [DOI] [PMC free article] [PubMed] [Google Scholar]
- 13.Olafsen T, Betting D, Kenanova VE, et al. Recombinant anti-CD20 antibody fragments for small-animal PET imaging of B-cell lymphomas. J Nucl Med. 2009;50:1500–1508. [DOI] [PMC free article] [PubMed] [Google Scholar]
- 14.Holland JP, Divilov V, Bander NH, Smith-Jones PM, Larson SM, Lewis JS. Zr-89-DFO-J591 for immunoPET of prostate-specific membrane antigen expression in vivo. J Nucl Med. 2010;51:1293–1300. [DOI] [PMC free article] [PubMed] [Google Scholar]
- 15.Viola-Villegas NT, Sevak KK, Carlin SD, et al. Noninvasive imaging of PSMA in prostate tumors with 89Zr-labeled huJ591 engineered antibody fragments: the faster alternatives. Mol Pharm. 2014;11:3965–3973. [DOI] [PMC free article] [PubMed] [Google Scholar]
- 16.U.S. Department of Health and Human Services, Food and Drug Administration, Center for Drug Evaluation and Research (CDER). Guidance for industry and FDA staff qualification process for drug development tools. FDA website. http://www.fda.gov/downloads/drugs/guidancecomplianceregulatoryinformation/gui, dances/ucm230597.pdf. January 2014. Accessed on August 22, 2016.
- 17.Vosjan MJ, Perk LR, Visser GW, et al. Conjugation and radiolabeling of monoclonal antibodies with zirconium-89 for PET imaging using the bifunctional chelate p-isothiocyanatobenzyl-desferrioxamine. Nat Protoc. 2010;5:739–743. [DOI] [PubMed] [Google Scholar]
- 18.Holland JP, Sheh Y, Lewis JS. Standardized methods for the production of high specific-activity zirconium-89. Nucl Med Biol. 2009;36:729–739. [DOI] [PMC free article] [PubMed] [Google Scholar]
- 19.Lindmo T, Boven E, Cuttitta F, Fedorko J, Bunn PA., Jr Determination of the immunoreactive fraction of radiolabeled monoclonal antibodies by linear extrapolation to binding at infinite antigen excess. J Immunol Methods. 1984;72:77–89. [DOI] [PubMed] [Google Scholar]
- 20.Barrett PH, Bell BM, Cobelli C, et al. SAAM II: simulation, analysis, and modeling software for tracer and pharmacokinetic studies. Metabolism. 1998;47:484–492. [DOI] [PubMed] [Google Scholar]
- 21.Morgan DJ, Bray KM. Lean body mass as a predictor of drug dosage: implications for drug therapy. Clin Pharmacokinet. 1994;26:292–307. [DOI] [PubMed] [Google Scholar]
- 22.Stabin MG, Sparks RB, Crowe E. OLINDA/EXM: the second-generation personal computer software for internal dose assessment in nuclear medicine. J Nucl Med. 2005;46:1023–1027. [PubMed] [Google Scholar]
- 23.Wahl RL, Kroll S, Zasadny KR. Patient-specific whole-body dosimetry: principles and a simplified method for clinical implementation. J Nucl Med. 1998;39:14S–20S. [PubMed] [Google Scholar]
- 24.Sgouros G, Stabin M, Erdi Y, et al. Red marrow dosimetry for radiolabeled antibodies that bind to marrow, bone, or blood components. Med Phys. 2000;27:2150–2164. [DOI] [PubMed] [Google Scholar]
- 25.Bauman G, Belhocine T, Kovacs M, Ward A, Beheshti M, Rachinsky I. 18F-fluorocholine for prostate cancer imaging: a systematic review of the literature. Prostate Cancer Prostatic Dis. 2012;15:45–55. [DOI] [PubMed] [Google Scholar]
- 26.Bander NH, Nanus DM, Milowsky MI, Kostakoglu L, Vallabahajosula S, Goldsmith SJ. Targeted systemic therapy of prostate cancer with a monoclonal antibody to prostate-specific membrane antigen. Semin Oncol. 2003;30:667–676. [DOI] [PubMed] [Google Scholar]
- 27.Bander NH, Milowsky MI, Nanus DM, Kostakoglu L, Vallabhajosula S, Goldsmith SJ. Phase I trial of 177lutetium-labeled J591, a monoclonal antibody to prostate-specific membrane antigen, in patients with androgen-independent prostate cancer. J Clin Oncol. 2005;23:4591–4601. [DOI] [PubMed] [Google Scholar]
- 28.Schauer U, Stemberg F, Rieger CH, et al. IgG subclass concentrations in certified reference material 470 and reference values for children and adults determined with the binding site reagents. Clin Chem. 2003;49:1924–1929. [DOI] [PubMed] [Google Scholar]
- 29.Afshar-Oromieh A, Malcher A, Eder M, et al. PET imaging with a [68Ga]gallium-labelled PSMA ligand for the diagnosis of prostate cancer: biodistribution in humans and first evaluation of tumour lesions. Eur J Nucl Med Mol Imaging. 2013;40:486–495. [DOI] [PubMed] [Google Scholar]
- 30.Morris MJ, Divgi C, Kelly WK, et al. Phase I trial to evaluate J591 as a vascular targeting agent in patients with advanced solid tumors. P Am Assoc Canc Res Ann Meeting. 2003;44:803–803. [Google Scholar]
- 31.Börjesson PKE, Jauw YWS, de Bree R, et al. Radiation dosimetry of Zr-89-labeled chimeric monoclonal antibody U36 as used for immuno-PET in head and neck cancer patients. J Nucl Med. 2009;50:1828–1836. [DOI] [PubMed] [Google Scholar]
Associated Data
This section collects any data citations, data availability statements, or supplementary materials included in this article.


