Abstract
Precise definition of the mitral valve plane (VP) during segmentation of the left ventricle for SPECT myocardial perfusion imaging (MPI) quantification often requires manual adjustment, which affects the quantification of perfusion. We developed a machine learning approach using support vector machines (SVM) for automatic VP placement. Methods: A total of 392 consecutive patients undergoing 99mTc-tetrofosmin stress (5 min; mean ± SD, 350 ± 54 MBq) and rest (5 min; 1,024 ± 153 MBq) fast SPECT MPI attenuation corrected (AC) by CT and same-day coronary CT angiography were studied; included in the 392 patients were 48 patients who underwent invasive coronary angiography and had no known coronary artery disease. The left ventricle was segmented with standard clinical software (quantitative perfusion SPECT) by 2 experts, adjusting the VP if needed. Two-class SVM models were computed from the expert placements with 10-fold cross validation to separate the patients used for training and those used for validation. SVM probability estimates were used to compute the best VP position. Automatic VP localizations on AC and non-AC images were compared with expert placement on coronary CT angiography. Stress and rest total perfusion deficits and detection of per-vessel obstructive stenosis by invasive coronary angiography were also compared. Results: Bland–Altman 95% confidence intervals (CIs) for VP localization by SVM and experts for AC stress images (bias, 1; 95% CI, −5 to 7 mm) and AC rest images (bias, 1; 95% CI, −7 to 10 mm) were narrower than interexpert 95% CIs for AC stress images (bias, 0; 95% CI, −8 to 8 mm) and AC rest images (bias, 0; 95% CI, −10 to 10 mm) (P < 0.01). Bland–Altman 95% CIs for VP localization by SVM and experts for non-AC stress images (bias, 1; 95% CI, −4 to 6 mm) and non-AC rest images (bias, 2; 95% CI, −7 to 10 mm) were similar to interexpert 95% CIs for non-AC stress images (bias, 0; 95% CI, −6 to 5 mm) and non-AC rest images (bias, −1; 95% CI, −9 to 7 mm) (P was not significant [NS]). For regional detection of obstructive stenosis, ischemic total perfusion deficit areas under the receiver operating characteristic curve for the 2 experts (AUC, 0.79 [95% CI, 0.7–0.87]; AUC, 0.81 [95% CI, 0.73–0.89]) and the SVM (0.82 [0.74–0.9]) for AC data were the same (P = NS) and were higher than those for the unadjusted VP (0.63 [0.53–0.73]) (P < 0.01). Similarly, for non-AC data, areas under the receiver operating characteristic curve for the experts (AUC, 0.77 [95% CI, 0.69–0.89]; AUC, 0.8 [95% CI, 0.72–0.88]) and the SVM (0.79 [0.71–0.87]) were the same (P = NS) and were higher than those for the unadjusted VP (0.65 [0.56–0.75]) (P < 0.01). Conclusion: Machine learning with SVM allows automatic and accurate VP localization, decreasing user dependence in SPECT MPI quantification.
Keywords: myocardial perfusion imaging, SPECT quantification, machine learning, support vector classification, coronary CT angiography
SPECT myocardial perfusion imaging (MPI) is widely used for the detection and quantification of cardiac ischemia (1). Relative perfusion deficit quantification at stress and rest on the basis of total perfusion deficits (TPD) (2) allows the quantitative estimation of ischemia. Recently, specialized cardiac SPECT scanners dramatically improved count sensitivity and image resolution, enabling lower patient radiation doses and faster acquisitions (3). However, the imaging geometry and reconstruction techniques are often different from those used with the conventional Anger camera, resulting in a somewhat different appearance of images (4) and new image artifacts (5). In this context, MPI software analysis packages may need to be updated for accurate quantification with the new camera systems.
Successful software-based analysis of MPI requires accurate segmentation of the left ventricular (LV) myocardium to correctly estimate myocardial perfusion deficits by comparison with normal limits. This step sometimes requires reader interaction to localize the left ventricle and the mitral valve plane (VP). From these steps, manual adjustments of the VP lead to the greatest operator intervention (6). We aimed to develop a novel machine learning approach for fully automated VP localization and to validate it with stress and rest MPI obtained with a new-generation SPECT system.
MATERIALS AND METHODS
Study Population
A total of 392 consecutive patients undergoing hybrid coronary CT angiography (CCTA) as well as stress and rest MPI scans on a cadmium–zinc–telluride SPECT camera for the assessment of suspected coronary artery disease between February 2010 and February 2013 were considered. Of the 392 patients, 350 underwent both stress and rest MPI, and the remaining 42 underwent stress-only MPI. Invasive coronary angiography (ICA) was performed in 48 of the 392 patients; these 48 patients had no myocardial infarction and no history of bypass surgery. The ICA cohort was used in the diagnostic validation. The study was approved by the institutional review board, and the requirement to obtain informed consent was waived.
SPECT
The protocol consisted of 1-d stress and rest MPI with standard adenosine (0.14 mg/kg/min over 6 min) or dobutamine (incrementally administered, starting at 5 μg/kg/min and increasing at 1-min intervals to a maximal dose of 60 μg/kg/min, until 85% of the age-predicted heart rate had been achieved) infusion, or bicycle stress. Approximately 60 min after the injection of 350 ± 54 MBq of 99mTc-tetrofosmin, stress MPI was performed for 5 min on a Discovery NM530c scanner (GE Healthcare) equipped with a multipinhole collimator and 19 cadmium–zinc–telluride detectors (7). Next, rest MPI was performed several minutes after the administration of 1,024 ± 153 MBq of 99mTc-tetrofosmin (5,8). Attenuation correction was performed on stress and rest images with a low-dose 64-slice CT scan acquired with prospective electrocardiography triggering (9,10). Cadmium–zinc–telluride images were reconstructed on a dedicated Xeleris workstation (GE Healthcare) by use of an optimized iterative reconstruction algorithm with maximum-likelihood expectation maximization (8), as in our clinical routine.
SPECT Quantitative Analysis
Attenuation-corrected (AC) and non-AC myocardial perfusion images were processed with standard clinical software (quantitative perfusion SPECT; Cedars–Sinai Medical Center) (11). LV contours were verified independently on stress and rest images by 2 experienced observers (expert 1 and expert 2), both nuclear medicine technologists with more than 15 y of dedicated experience in nuclear cardiology. Experts were unaware of any of the clinical results. When needed, they corrected the gross initial LV localization and the LV mask (region containing the left ventricle), and adjusted the VP position. Stress and rest TPD (2) and per-vessel TPD for the coronary vessel territories were obtained (2). To avoid ambiguity during machine learning training, the interobserver normal and abnormal discrepancies of global TPD measures (at a threshold of 5%) due to VP positioning were resolved by a third experienced observer (imaging cardiologist), who was unaware of the previous results.
CCTA
CCTA images were acquired on a 64-slice CT system (Lightspeed VCT or Discovery HD750; GE Healthcare) (12,13). Contrast-enhanced prospective electrocardiography-triggered CCTA was performed with inspiration breath-hold at 75% of the R-R interval as previously reported (12). Metoprolol was administrated intravenously before the examination if the heart rate was greater than 65 beats/min, and 2.5 mg of isosorbide dinitrate was administrated sublingually to obtain optimal image quality. Iodixanol (Visipaque 320; 320 mg/mL; GE Healthcare) was injected into an antecubital vein, followed by 50 mL of saline solution, via an 18-gauge catheter. The contrast medium volume (40–105 mL) and the flow rate (3.5–5 mL/s) were adapted to body surface area (9).
CCTA Analysis
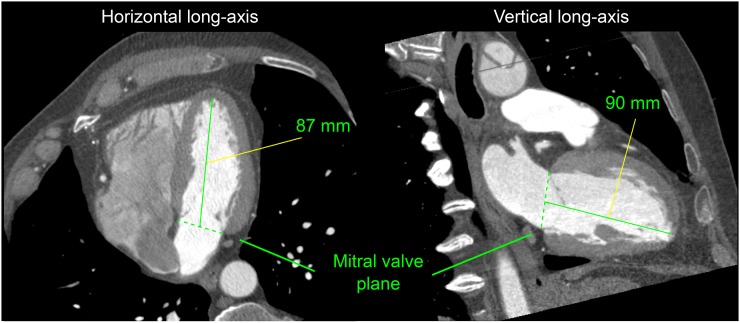
CCTA was used only as the anatomic reference for the evaluation of the algorithm and was not used by the machine learning algorithm. The distance from the endocardial surface of the apex to the anatomic VP centroid was defined by 2 additional experienced observers (different from experts 1 and 2) in the vertical and horizontal long-axis orientations (Fig. 1). During CCTA measurements, the interpreters were unaware of the SPECT measurements. The mean of the 2 values for each observation (horizontal and vertical long-axis orientations) was used for comparison with the corresponding apex–VP distance obtained from MPI.
FIGURE 1.
Example of mitral VP localization in contrast-enhanced CCTA. Inner LV length from apex in endocardial wall to blood-pool centroid in VP was measured in horizontal and vertical long-axis views from ungated stress MPI. Average value (88.5 mm) was obtained for this subject.
ICA
ICA through the femoral or radial artery was performed in a catheterization laboratory (University Hospital Zurich) in accordance with our clinical protocol, which consists of biplane angiography of the left coronary artery in 4 orientations and of the right coronary artery in 2 orientations. Each vessel was visually scored as being normal or stenosed by an experienced interventional cardiologist, reflecting daily clinical routine in the catheterization laboratory. Obstructive stenosis was defined as a diameter reduction of greater than 70%.
Machine Learning: Overview
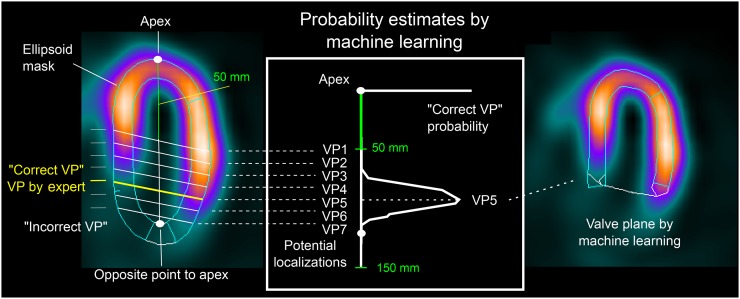
Experts 1 and 2 localized the VP on SPECT images using their inferred knowledge of heart anatomy. The proposed machine learning approach encapsulates this knowledge and estimates the VP position by use of a 2-class model that enables a continuous estimation of VP correct position probability. This approach requires the definition of correct and incorrect VP positions on the basis of the distance from the expert placements (Fig. 2). VP positions defined by both experts were used as examples of “correct” positions, whereas “incorrect” positions were generated every 2.5 mm along the LV long axis, between 50 and 150 mm from the apex (Fig. 2), to reflect anatomic constraints. Therefore, 784 correct positions (392 images, 2 experts) for the stress images and 700 for the rest images were generated. In addition, 6–40 incorrect positions were generated for each image.
FIGURE 2.
Machine learning localization of VP in MPI. Two-class SVM model trained from VP positions verified by 2 experts was used to estimate the most likely VP localization in left ventricle.
Machine Learning: Feature Selection
In total, 22 heuristically derived features related to the VP position computed from intensity, shape, and patient sex were included in the search for the best features during model training. Intensity attributes included values for raw intensity as well as individual extent and TPD in the basal segments. Shape attributes included myocardial mass and VP contour perimeter. Previously proposed VP and gross LV shape failure indicators were also considered (6). LV segmentation on gated images has been demonstrated to outperform that on ungated images (6); therefore, the ungated-to-gated VP distance and the differences in myocardial masses were also included. Attributes obtained from gated studies were included only if the segmentation quality control flag indicated correct segmentation (6) without any manual adjustment of gated studies. These features were evaluated for their incremental value in deciding whether the VP was correctly placed on myocardial perfusion images. We ranked the attributes in accordance with their information gain, as in our previous work (14), and selected the top-ranked attributes that provided a gain greater than 0 and also monotonically increased the area under the receiver operating characteristic curve.
Machine Learning: Support Vector Classification
Automatic VP localization was achieved by finding the position with the highest probability of being correct. We used a 2-class support vector machines (SVM) classification approach (15) that automatically estimated the VP position and its probability from a set of potential positions sampled by 1 mm between the limit bounds defined earlier (Fig. 2). The radial basis function SVM model, defined by the regularization and kernel parameters, was selected. The 2 classes were defined as correct VP position and incorrect VP position. The numbers of correct and incorrect samples were balanced during training by penalty weighting (15).
Machine Learning: 10-Fold Cross Validation
The separation of training and testing data was achieved with a nested 10-fold cross-validation procedure. The main advantages of this procedure are that it reduces the variance in prediction error, leading to a more accurate estimate of model performance; maximizes the use of data for training and validation without overfitting or overlap between test and validation data; and guards against testing hypotheses suggested by arbitrarily split data (16). The procedure divided the study population into 10 nonoverlapping groups of patients of approximately the same size (17). Ten folds were built, with each group being used in turn as the validation set and the remaining 9 groups being used as training sets. Ten models were then trained and validated with these folds. The validation results were stacked to provide overall performance. The SVM regularization and kernel parameters were computed inside the folds with a standard grid search procedure (17).
Anatomic Validation
The anatomic validation included comparisons of VP positions obtained by the 2 experts with the automatic VP localization by SVM, as well as with the position of the anatomic mitral VP in CCTA. In the comparison with CCTA, half of the distance between the end-diastolic VP and the end-systolic VP was added to the VP position to correct for the expected difference between the VP position for ungated MPI and the mitral VP position in CCTA from the 70% diastolic phase. In addition, a comparison of the transient ischemic dilation ratios (18) estimated by the 2 experts and the SVM was also performed.
Diagnostic Validation
The prediction of obstructive stenosis in the coronary vessel territories by per-vessel ischemic TPD and stress TPD was used to evaluate diagnostic accuracy after VP localization. The prediction before manual VP adjustment by experts (unadjusted) has also been provided for reference.
Statistical Analysis
Bland–Altman difference plots (19) depicting bias and agreement limits (95% CIs) were used to assess agreement in VP positions, transient ischemic dilation ratios, and TPD. A paired Wilcoxon test was used to evaluate differences in bias. The Levene homogeneity-of-variance test was used to assess differences in 95% CIs. Pearson correlations and differences between paired correlations were also computed (20). A paired DeLong test was used to evaluate differences between areas under the receiver operating characteristic curve (21). Two-sided P values of less than 0.05 were considered to be significant. All statistical analyses were implemented in R programming language, version 3.2.3 (22).
RESULTS
Patients
The clinical characteristics of the population are shown in Table 1. All subjects underwent SPECT MPI and CCTA. For the CCTA analysis, 18 stress and 16 rest images were rejected because the apex could not be observed on CCTA (11 cases) and because studies were of poor quality (7 cases). Therefore, 374 stress studies and 334 rest studies were retained for the validation of VP positions against CCTA.
TABLE 1.
Population Characteristics
| Characteristic | All (n = 392) | Men (n = 279) | Women (n = 113) |
| Age (y)* | 62.5 ± 9.9 | 61.9 ± 10 | 64 ± 9.4 |
| BMI (kg/m2)* | 27.5 ± 4.9 | 27.6 ± 4.5 | 27.1 ± 5.9 |
| Obesity (BMI, >30 kg/m2)† | 100 (26) | 69 (25) | 31 (27) |
| Previous cardiac events† | |||
| Myocardial infarction | 64 (16) | 56 (20) | 8 (7) |
| PCI | 58 (15) | 51 (18) | 7 (6) |
| CABG | 33 (8) | 30 (11) | 3 (3) |
Continuous variables, reported as mean ± SD.
Reported as numbers of patients, with percentages of patients in parentheses.
BMI = body mass index; PCI = percutaneous coronary intervention; CABG = coronary artery bypass grafting.
For the 48 patients with ICA correlations and no myocardial infarction (144 territories), 34% of vessels (49/144) had obstructive stenosis distributed in 22 left anterior descending, 13 left circumflex, and 14 right coronary artery territories.
VP Positioning on SPECT MPI
For stress images, the VP position assigned by the standard software was adjusted in 38% of AC (149/392) and 18.6% of non-AC (73/392) cases by expert 1, and in 44.4% of AC (174/392) and 21.2% of non-AC (83/392) cases by expert 2. For rest images, the VP position was adjusted in 64.9% of AC (227/350) and 61.4% of non-AC (215/350) cases by expert 1, and in 65.4% of AC (229/350) and 63.7% of non-AC (223/350) cases by expert 2. VP positions on 6.9% of AC (27/392) and 5.1% of non-AC (20/392) stress images and on 13.7% of AC (48/350) and 8.3% of non-AC (29/350) rest images were reviewed by a third expert to resolve the diagnostic discrepancies between experts 1 and 2 for SVM model training.
Feature Selection
During the feature selection step, 6 attributes were selected for AC images and 8 attributes were selected for non-AC images (Table 2; Supplemental Fig. 1) (supplemental materials are available at http://jnm.snmjournals.org). Both previously proposed quality control indicators (6) were selected for AC and non-AC images.
TABLE 2.
Attributes Selected During Support Vector Machine Model Training
| AC |
Non-AC |
||||
| Type | Attribute | Stress | Rest | Stress | Rest |
| Intensity | QC for VP failures (6) | ✓ | ✓ | ✓ | ✓ |
| Sum of basal counts normalized to maximum segment (%) | ✓ | ✓ | ✓ | ✓ | |
| Sum of basal counts normalized to background (%) | ✓ | ||||
| Shape | QC for gross LV contour failures (6) | ✓ | ✓ | ✓ | ✓ |
| Normalized perimeter of VP contour (%) | ✓ | ✓ | ✓ | ✓ | |
| VP contour perimeter (mm) | ✓ | ✓ | |||
| Myocardial mass (g) | ✓ | ||||
| Data from gated scan | Distance to VP on gated image (mm) | ✓ | ✓ | ✓ | ✓ |
| Difference in myocardial mass (g) between ungated and gated images | ✓ | ✓ | ✓ | ✓ | |
QC = quality control.
Anatomic Validation
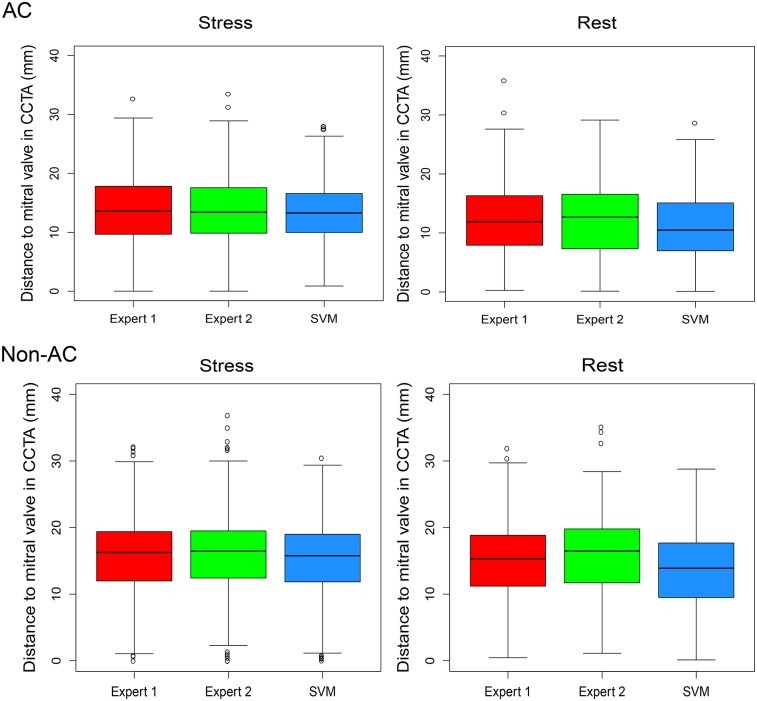
The differences between VP positions on CCTA and VP positions on MPI for expert 1, expert 2, and SVM had similar 95% CIs (Fig. 3). For stress images, a high correlation between the 2 experts (AC: r = 0.79; non-AC: r = 0.90) was observed. The SVM–expert 2 correlation (AC: r = 0.87; non-AC: r = 0.86) was higher for AC images but lower for non-AC images than the SVM–expert 1 correlation (AC: r = 0.78; non-AC: r = 0.92) (P < 0.001). For rest AC images, similar (P was not significant [NS]) correlations were found between experts 1 and 2 (r = 0.72), between SVM and expert 1 (r = 0.68), and between SVM and expert 2 (r = 0.69). For rest non-AC images, expert 1–expert 2 (r = 0.80) and SVM–expert 1 (r = 0.73) correlations were higher than the SVM–expert 2 (r = 0.66) correlation (P < 0.01).
FIGURE 3.
Distance to VP in CCTA. Box plots show distances to VP positions in CCTA and VP positions on AC and non-AC stress and rest images from MPI for 2 experts (red and green) and automatic SVM procedure (blue). Similar stress and rest 95% CIs were found for expert 1, expert 2, and SVM (P = NS).
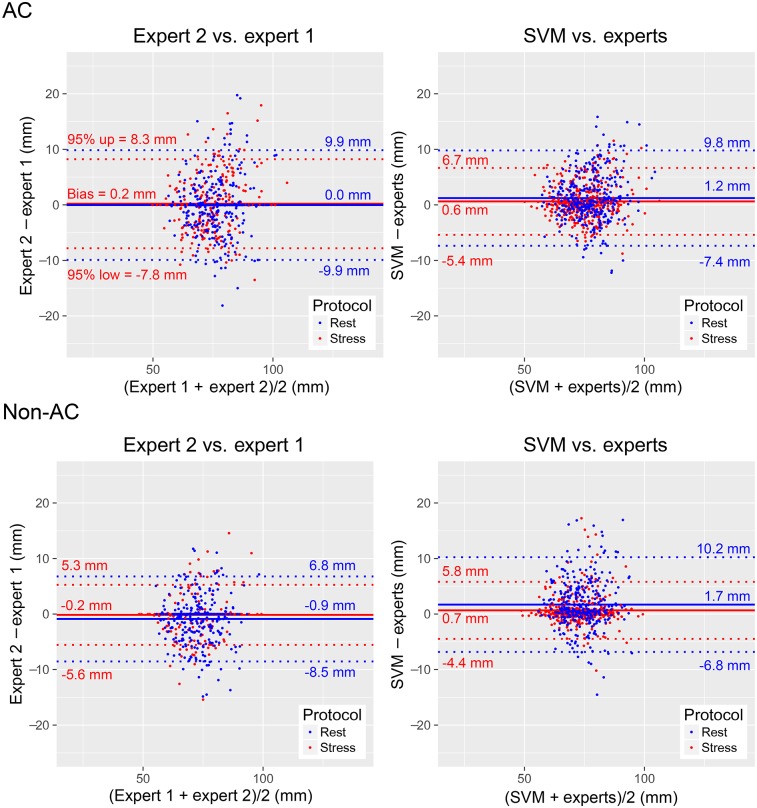
For AC images, the 95% CIs for VP positions between SVM and the experts were narrower than those between the experts; for non-AC images, they were similar (Fig. 4). For AC stress images, similar biases were observed between SVM and the experts and between the experts (P = NS), whereas the biases for AC rest and non-AC stress and rest images were higher for SVM (P < 0.05). The 95% CIs between SVM and the experts were the same as those for CCTA (Supplemental Fig. 2).
FIGURE 4.
VP localization agreement. Bland–Altman difference plots show distances from apex to VP center on stress (red) and rest (blue) images, with VP positions from expert 1, expert 2, average positions from experts [experts = (expert 1 + expert 2)/2], and automatic VP localization procedure (SVM). 95% CIs for SVM vs. experts were narrower for AC stress and rest images (P < 0.01) and the same for non-AC stress and rest images (P = NS) as compared with 95% CIs for expert 2 vs. expert 1.
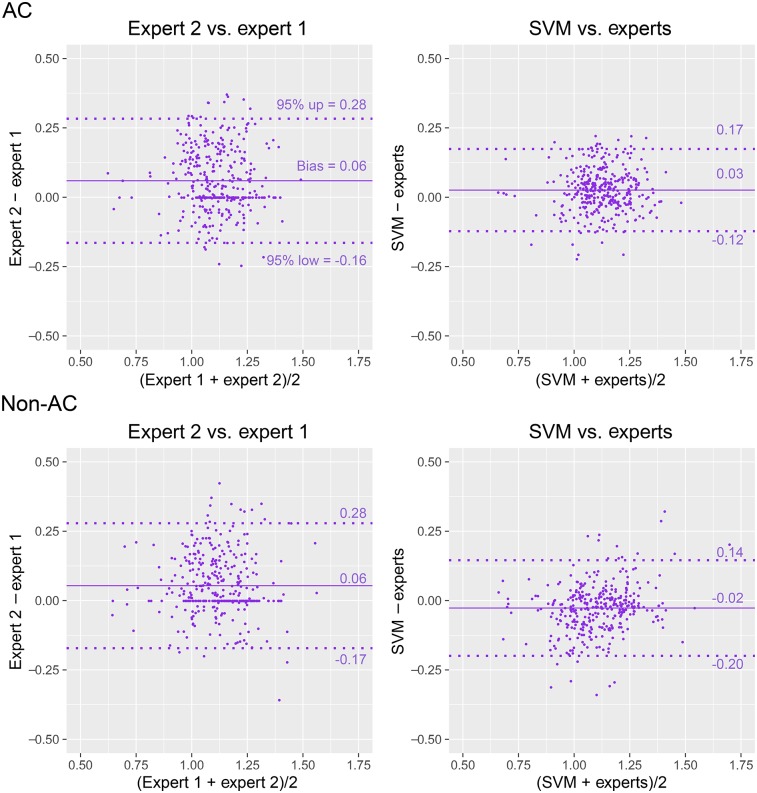
For transient ischemic dilation ratios, the biases and 95% CIs between SVM and the experts were lower and narrower, respectively, than those between the 2 experts (Fig. 5). Significant AC and non-AC transient ischemic dilation ratio correlations were found between the 2 experts (AC: r = 0.65; non-AC: r = 0.72), between SVM and expert 1 (AC: r = 0.67; non-AC: r = 0.88), and between SVM and expert 2 (AC: r = 0.82; non-AC: r = 0.66). For AC images, the correlation between SVM and expert 2 was higher than that between SVM and expert 1; for non-AC images, it was lower (P < 0.001).
FIGURE 5.
Transient ischemic dilation (TID) ratio agreement. Bland–Altman difference plots show TID ratios for VP positions from 2 experts and automatic VP localization procedure (SVM) on AC and non-AC stress and rest images. Average TID ratio from experts [experts = (expert 1 + expert 2)/2] was used as reference for SVM plot. Lower biases and narrower 95% CIs were found for SVM vs. experts than for expert 2 vs. expert 1 (P < 0.001).
Diagnostic Validation
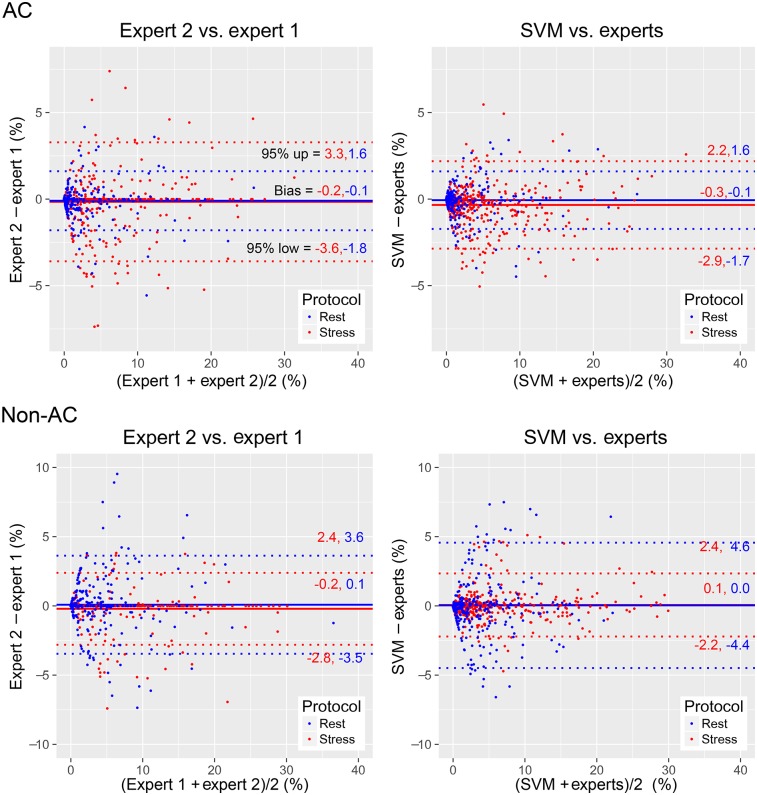
Global TPD biases between SVM and the experts were similar to those between the 2 experts (Fig. 6). For both AC and non-AC images, high correlations were found for global stress TPD and rest TPD between the 2 experts (AC stress: r = 0.96; non-AC stress: r = 0.98; AC rest: r = 0.97; non-AC rest: r = 0.92), between SVM and expert 1 (r = 0.96, 0.97, 0.96, and 0.86, respectively), and between SVM and expert 2 (r = 0.97, 0.98, 0.97, and 0.87, respectively). The correlation between SVM and expert 2 was higher than that between SVM and expert 1 (P < 0.001).
FIGURE 6.
TPD agreement. Bland–Altman difference plots show global stress TPD (red) and rest TPD (blue) for VP positions from 2 experts and automatic VP localization procedure (SVM). Average TPD from experts [experts = (expert 1 + expert 2)/2] was used as reference for SVM plot. Similar stress and rest biases were found for AC and non-AC images (P = NS). Similar 95% CIs were found for AC images and for non-AC stress images (P = NS). Wider 95% CI for non-AC rest images was found for SVM vs. experts than for expert 2 vs. expert 1 (P < 0.05).
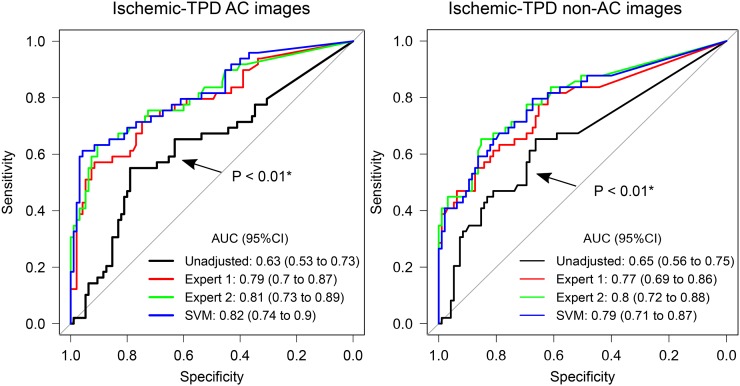
For the 2 experts and SVM, the areas under the receiver operating characteristic curve for the per-vessel detection of obstructive stenosis by regional ischemic TPD (Fig. 7) and by stress TPD (Supplemental Fig. 3) were similar to those for the 2 experts (P = NS) and higher than those for the unadjusted VP, respectively.
FIGURE 7.
Diagnostic outcome agreement. Prediction of per-vessel obstructive stenosis from ICA by ischemic TPD (stress–rest) computed from nonadjusted VP positions (unadjusted), VP positions from 2 experts, and automatic VP localization procedure (SVM). AUC = area under receiver operating characteristic curve. *AUC lower than that for expert 1, expert 2, or SVM. All other comparisons were not significant.
DISCUSSION
We proposed a novel method for automatic VP localization in MPI. The machine learning approach allowed us to encapsulate expert knowledge and capture the complex pattern changes caused by VP variations, using an optimal combination of high-level image features. These tasks could be difficult to accomplish by traditional image-processing approaches. The SVM model combined features such as intensity, shape, and information from gated images to localize the most likely VP position in MPI. The validation was performed in a rigorous fashion with nested 10-fold cross validation. Therefore, only patient data unseen by the algorithm were used in the validation, avoiding possible bias.
VP adjustment is the only explicitly defined (without further algorithm override) adjustment made by the user in most software packages. This adjustment is subjective and time-consuming; consequently, it is the major contributor to the interobserver variability of quantitative perfusion parameters (6). Xu et al. previously proposed 2 quality control indicators of myocardial segmentation quality, one indicating VP failures (6). However, although the detection of gross shape failures in the LV segmentation algorithm was excellent, the detection of VP failures was less optimal. Indeed, such variability could lead to potential degradation of the diagnostic accuracy of MPI performed by inexperienced users. Incorrect VP localization leads to inaccurate definition of the LV base and, consequently, flawed polar-map subdivision of the myocardial segments. TPD computation relies on the comparison of normalized local intensity counts with corresponding local normal limits (2). Therefore, precise VP placement is required to avoid a polar-map localization mismatch in comparisons with normal limits.
The automatic VP positioning was evaluated with CCTA as the anatomic reference standard and ICA as the diagnostic reference standard. The results showed that automated VP localization performed as well as the experts and resulted in similar diagnostic accuracy. Therefore, the results suggest that the algorithms trained by expert annotations could be deployed to entirely eliminate manual adjustment of VP in MPI, thus significantly decreasing quantification subjectivity and facilitating optimal perfusion quantification for less experienced readers.
Although major efforts to standardize MPI analysis (23–26) have been reported, the current recommended method for MPI interpretation is still based on time-consuming and subjective visual scoring of regional perfusion tracer uptake (27). Automatic quantification of MPI would reduce this subjectivity, but current techniques still require the user to make manual adjustments. In the present study, 2 highly experienced observers corrected VP failures in a substantial number of MPI studies. We showed here that without this user correction, the diagnostic accuracy of MPI was significantly degraded. By applying the machine learning approach, we were able to totally automate the VP selection.
The present study has some limitations. First, it was limited to the localization of the VP center, which is the only adjustment performed in the current clinical routine. Second, it was a single-center study with a 1-vendor camera. However, the methodology proposed here can be applied to other systems. Further tests of conventional camera images with available CCTA correlations should be performed. Third, for anatomic validation, we relied on CCTA measurements; these provide excellent anatomic information but have limitations (due to phase matching with ungated myocardial perfusion images) that may have contributed to the systematic bias of the CCTA comparisons. Finally, the angiographic validation was available only for a subset of the overall population.
CONCLUSION
We demonstrated that a machine learning approach allows full automation of VP localization in MPI with new-generation SPECT cameras. This approach represents an important step in efforts to provide objective quantification of MPI without the need for expert intervention for contour correction.
DISCLOSURE
This research was supported in part by grant R01HL089765 from the National Heart, Lung, and Blood Institute, National Institutes of Health (to Dr. Piotr Slomka [principal investigator]). The content is solely the responsibility of the authors and does not necessarily represent the official views of the National Institutes of Health.
Drs. Slomka, Berman, and Germano participate in software royalties at Cedars–Sinai Medical Center. No other potential conflict of interest relevant to this article was reported.
Supplementary Material
Acknowledgments
We thank Joanna Liang for proofreading this article.
REFERENCES
- 1.Einstein AJ. Effects of radiation exposure from cardiac imaging: how good are the data? J Am Coll Cardiol. 2012;59:553–565. [DOI] [PMC free article] [PubMed] [Google Scholar]
- 2.Slomka PJ, Nishina H, Berman DS, et al. Automated quantification of myocardial perfusion SPECT using simplified normal limits. J Nucl Cardiol. 2005;12:66–77. [DOI] [PubMed] [Google Scholar]
- 3.Slomka PJ, Patton JA, Berman DS, Germano G. Advances in technical aspects of myocardial perfusion SPECT imaging. J Nucl Cardiol. 2009;16:255–276. [DOI] [PubMed] [Google Scholar]
- 4.Sharir T, Ben-Haim S, Merzon K, et al. High-speed myocardial perfusion imaging initial clinical comparison with conventional dual detector Anger camera imaging. JACC Cardiovasc Imaging. 2008;1:156–163. [DOI] [PubMed] [Google Scholar]
- 5.Fiechter M, Ghadri JR, Kuest SM, et al. Nuclear myocardial perfusion imaging with a novel cadmium-zinc-telluride detector SPECT/CT device: first validation versus invasive coronary angiography. Eur J Nucl Med Mol Imaging. 2011;38:2025–2030. [DOI] [PubMed] [Google Scholar]
- 6.Xu Y, Kavanagh P, Fish M, et al. Automated quality control for segmentation of myocardial perfusion SPECT. J Nucl Med. 2009;50:1418–1426. [DOI] [PMC free article] [PubMed] [Google Scholar]
- 7.Herzog BA, Buechel RR, Katz R, et al. Nuclear myocardial perfusion imaging with a cadmium-zinc-telluride detector technique: optimized protocol for scan time reduction. J Nucl Med. 2010;51:46–51. [DOI] [PubMed] [Google Scholar]
- 8.Buechel RR, Herzog BA, Husmann L, et al. Ultrafast nuclear myocardial perfusion imaging on a new gamma camera with semiconductor detector technique: first clinical validation. Eur J Nucl Med Mol Imaging. 2010;37:773–778. [DOI] [PubMed] [Google Scholar]
- 9.Pazhenkottil AP, Husmann L, Buechel RR, et al. Validation of a new contrast material protocol adapted to body surface area for optimized low-dose CT coronary angiography with prospective ECG-triggering. Int J Cardiovasc Imaging. 2010;26:591–597. [DOI] [PubMed] [Google Scholar]
- 10.Fiechter M, Ghadri JR, Wolfrum M, et al. Downstream resource utilization following hybrid cardiac imaging with an integrated cadmium-zinc-telluride/64-slice CT device. Eur J Nucl Med Mol Imaging. 2012;39:430–436. [DOI] [PubMed] [Google Scholar]
- 11.Germano G, Kavanagh PB, Waechter P, et al. A new algorithm for the quantitation of myocardial perfusion SPECT. I: Technical principles and reproducibility. J Nucl Med. 2000;41:712–719. [PubMed] [Google Scholar]
- 12.Husmann L, Valenta I, Gaemperli O, et al. Feasibility of low-dose coronary CT angiography: first experience with prospective ECG-gating. Eur Heart J. 2008;29:191–197. [DOI] [PubMed] [Google Scholar]
- 13.Fuchs TA, Stehli J, Fiechter M, et al. First experience with monochromatic coronary computed tomography angiography from a 64-slice CT scanner with gemstone spectral imaging (GSI). J Cardiovasc Comput Tomogr. 2013;7:25–31. [DOI] [PubMed] [Google Scholar]
- 14.Arsanjani R, Dey D, Khachatryan T, et al. Prediction of revascularization after myocardial perfusion SPECT by machine learning in a large population. J Nucl Cardiol. 2015;22:877–884. [DOI] [PMC free article] [PubMed] [Google Scholar]
- 15.Chang C-C, Lin C-J. LIBSVM: a library for support vector machines. ACM Trans Intell Syst Technol. 2011;2:1–27. [Google Scholar]
- 16.Molinaro AM, Simon R, Pfeiffer RM. Prediction error estimation: a comparison of resampling methods. Bioinformatics. 2005;21:3301–3307. [DOI] [PubMed] [Google Scholar]
- 17.Hsu C-W, Chang C-C, Lin C-J. A Practical Guide to Support Vector Classification. Taipei, Taiwan: Department of Computer Science, National Taiwan University; 2003. [Google Scholar]
- 18.McLaughlin MG, Danias PG. Transient ischemic dilation: a powerful diagnostic and prognostic finding of stress myocardial perfusion imaging. J Nucl Cardiol. 2002;9:663–667. [DOI] [PubMed] [Google Scholar]
- 19.Bland JM, Altman D. Statistical methods for assessing agreement between two methods of clinical measurement. Lancet. 1986;1:307–310. [PubMed] [Google Scholar]
- 20.Revelle W. Psych: Procedures for Psychological, Psychometric, and Personality Research. Evanston, IL: Northwestern University; 2016. [Google Scholar]
- 21.Robin X, Turck N, Hainard A, et al. pROC: an open-source package for R and S+ to analyze and compare ROC curves. BMC Bioinformatics. 2011;12:77. [DOI] [PMC free article] [PubMed] [Google Scholar]
- 22.The R Core Team. R: A Language and Environment for Statistical Computing. Vienna, Austria: R Foundation for Statistical Computing; 2015. [Google Scholar]
- 23.Germano G, Kavanagh PB, Slomka PJ, Van Kriekinge SD, Pollard G, Berman DS. Quantitation in gated perfusion SPECT imaging: the Cedars-Sinai approach. J Nucl Cardiol. 2007;14:433–454. [DOI] [PubMed] [Google Scholar]
- 24.Garcia EV, Faber TL, Cooke CD, Folks RD, Chen J, Santana C. The increasing role of quantification in clinical nuclear cardiology: the Emory approach. J Nucl Cardiol. 2007;14:420–432. [DOI] [PubMed] [Google Scholar]
- 25.Ficaro EP, Lee BC, Kritzman JN, Corbett JR. Corridor4DM: the Michigan method for quantitative nuclear cardiology. J Nucl Cardiol. 2007;14:455–465. [DOI] [PubMed] [Google Scholar]
- 26.Liu YH. Quantification of nuclear cardiac images: the Yale approach. J Nucl Cardiol. 2007;14:483–491. [DOI] [PubMed] [Google Scholar]
- 27.Xu Y, Hayes S, Ali I, et al. Automatic and visual reproducibility of perfusion and function measures for myocardial perfusion SPECT. J Nucl Cardiol. 2010;17:1050–1057. [DOI] [PMC free article] [PubMed] [Google Scholar]
Associated Data
This section collects any data citations, data availability statements, or supplementary materials included in this article.


