Fig. 1.
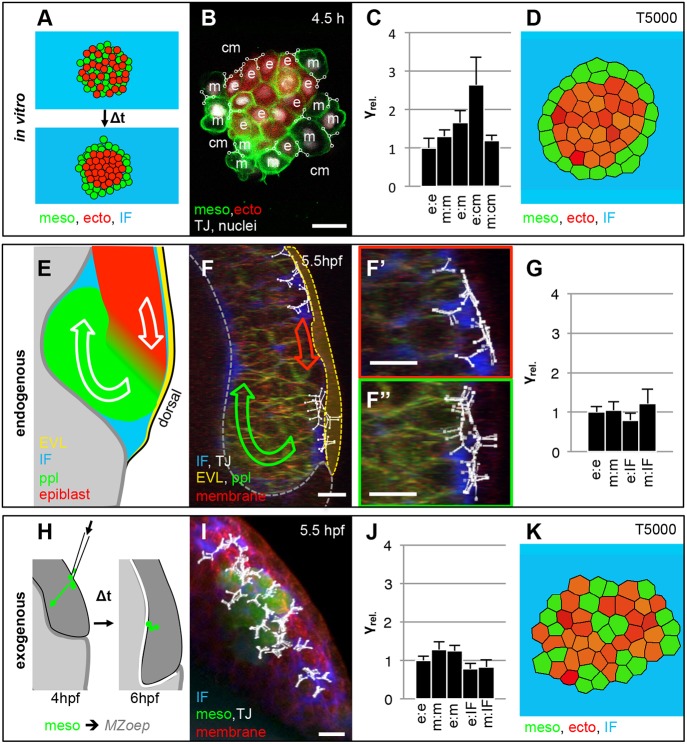
Relative interfacial tension distribution during cell segregation in vitro and in vivo. (A) Schematic illustration of the starting and end configurations for a typical heterotypical progenitor cell-sorting assay in vitro. (B) Single confocal image plane of a heterotypical aggregate consisting of ectoderm (ecto) and mesoderm (meso) progenitor cells expressing histone2A-mCherry in the nucleus (white) and Lyn-Venus at the plasma membrane (green) in all cells after 4.5 h in culture. Ectoderm progenitor cells were additionally labeled with cytoplasmic dextran-Alexa647 (red). Representative cell triple interfacial junctions (TJ, white) for cell-to-cell and cell-to-medium interfaces, as part of the CellFIT-3D based tensions analysis, were overlaid in the image as triple nodes in white with the different interfaces denoted as e (ectoderm), m (mesoderm) and cm (culture medium). Scale bar: 20 μm. For more details of the CellFIT-3D, see the supplementary Materials and Methods. (C) Relative interfacial tension distributions (γrel.) obtained by CellFIT-3D for all interface types present during in vitro cell sorting at 4.5 h in culture. Error bars show standard deviations. (D) Stable configurations of a finite element simulation of heterotypical progenitor cell sorting after 5000 computational iterations, using the CellFIT-3D obtained interfacial tensions shown in C with γe-e=1.00, γm-m=1.31, γe-m=1.66, γe-cm=2.65 and γm-cm=1.20. (E) Schematic illustration of mesoderm internalization in a lateral view through the dorsal germ ring margin at the onset of gastrulation. (F) 3D-rendered image of a Tg(gsc:eGFP) embryo at the onset of internalization (5.5 hpf) with ppl progenitor cells expressing eGFP (green), all cells expressing membrane-labeled Lyn-TagBFP (red), and the IF marked by dextran-rhodamine (blue). The image is overlaid with annotated triple junctions (TJ, white). The green and red arrows indicate global movement directions of mesoderm and ectoderm progenitor cells, respectively. The yellow dotted line demarcates the EVL. Scale bar: 20 μm. (F′,F″) Higher magnification views of the regions with ectoderm cells (F′, red) and ppl progenitor cells expressing eGFP (F″, green) from the image in F. Scale bars: 20 μm. (G) Relative interfacial tension distributions (γrel.) obtained by CellFIT-3D for all interface types present during gastrulation in vivo at 5.5 h with e (ectoderm), m (mesoderm) and IF (interstitial fluid). Error bars show standard deviations. (H) Schematic illustration of a typical transplanted mesoderm cell internalization experiment. (I) 3D-rendered image of Tg(βActin:Ras-eGFP) mesoderm cells (green) transplanted in a Lyn-TagBFP membrane-labeled (red) expressing Tg(dharma:eGFP);MZoep embryo at the onset of internalization (5.5 hpf) with the IF marked by dextran-rhodamine (blue) and overlaid with annotated triple junctions (TJ, white). Scale bar: 20 μm. (J) Relative interfacial tensions obtained by CellFIT-3D at the onset of mesoderm internalization with e (ectoderm), m (mesoderm) and IF (interstitial fluid). Error bars are standard deviations. (K) Stable configurations of a finite element simulation of heterotypical progenitor cell sorting after 5000 computational iterations, using the CellFIT-3D obtained interfacial tensions shown in J with γe-e=1.00, γm-m=1.28, γe-m=1.25, γe-IF=0.78 and γm-IF=0.83.

