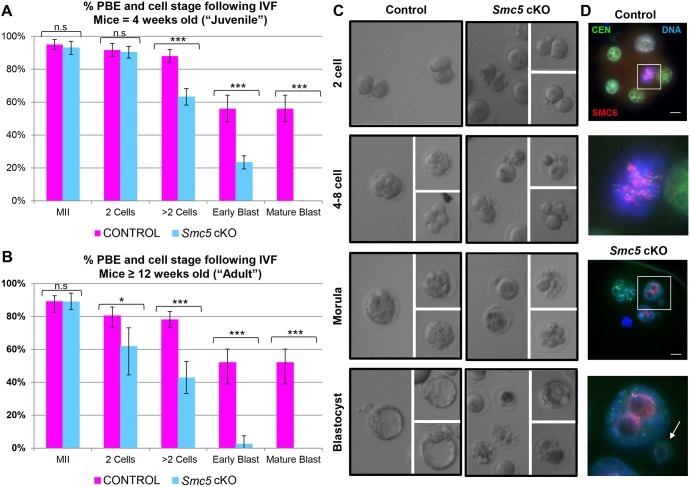
Fig. 3.
Smc5 cKO oocytes fail to form mature blastocysts. (A-C) Assessment of PBE and blastocyst formation following IVF. (A) PBE and IVF data obtained for ‘juvenile’ (4 weeks of age) control (123 oocytes, Smc5 +/flox, Zp3-Cre tg/0) and Smc5 cKO (150 oocytes, Smc5 flox/del, Zp3-Cre tg/0). P values (one-tailed paired t-test) for the indicated comparisons are P=0.0771 (n.s.), MII; P=0.1085 (n.s.), 2 cells; ***P=0.0003, >2 cells; ***P<0.0002, early blastocysts; and ***P<0.0001, mature blastocysts. (B) PBE and IVF data obtained for the ‘adult’ (≥12 weeks of age) control (105 oocytes) and Smc5 cKO (134 oocytes). The error bars represent the variation between three independent experiments. The P values (one-tailed paired t-test) for the indicated comparisons are P=0.4287 (n.s.), MII; *P=0.0282, 2 cells; ***P=0.0004, >2 cells; ***P<0.0001, early blastocysts; and ***P<0.0001, mature blastocysts. (C,D) Example images of cell morphology following IVF for control and Smc5 cKO. (D) Embryos stained with DAPI (blue, DNA), SMC6 (red) and CEN (green). Boxed regions are magnified three times. Arrow indicates a nucleus with irregular size. Collectively, IVF was performed six times using a total of 10 mice for each control and Smc5 cKO cohort. Scale bars: 10 µm.

