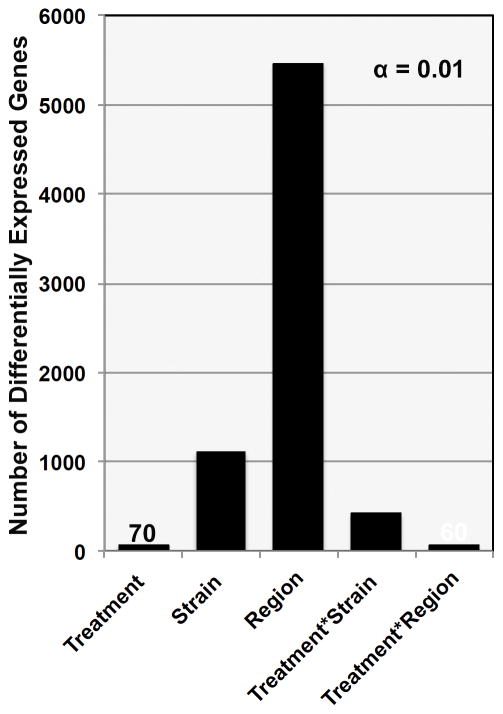
Fig. 1. Frequency of significant p values by model fit.
The number of genes associated with a main effect of strain, treatment, region, or a treatment by strain or treatment by region interaction is shown at an FDR of 10%. Values of approximately 100 or less are indicated on the chart for clarity. Only unique genes were included. Region and Strain have the strongest effect on gene expression, but the expression of a small number of genes shows either a main effect of treatment or an interaction 3 days following the fifth and final cycle of CIE exposure.

