Abstract
The orientation of cell division along the interphase cell long-axis, the century old Hertwig’s rule, has profound roles in tissue proliferation, morphogenesis, architecture and mechanics1,2. In epithelial tissues, the shape of the interphase cell is influenced by cell adhesion, mechanical stress, neighbour topology, and planar polarity pathways3–12. At mitosis, epithelial cells usually round up to ensure faithful chromosome segregation and to promote morphogenesis1. The mechanisms underlying interphase cell shape sensing in tissues are therefore unknown. We found that in Drosophila epithelia, tricellular junctions (TCJ) localize microtubule force generators, orienting cell division via the Dynein associated protein Mud independently of the classical Pins/Gαi pathway. Moreover, as cells round up during mitosis, TCJs serve as spatial landmarks, encoding information about interphase cell shape anisotropy to orient division in the rounded mitotic cell. Finally, experimental and simulation data show that shape and mechanical strain sensing by the TCJ emerge from a general geometric property of TCJ distributions in epithelial tissues. Thus, in addition to their function as epithelial barrier structures, TCJs serve as polarity cues promoting geometry and mechanical sensing in epithelial tissues.
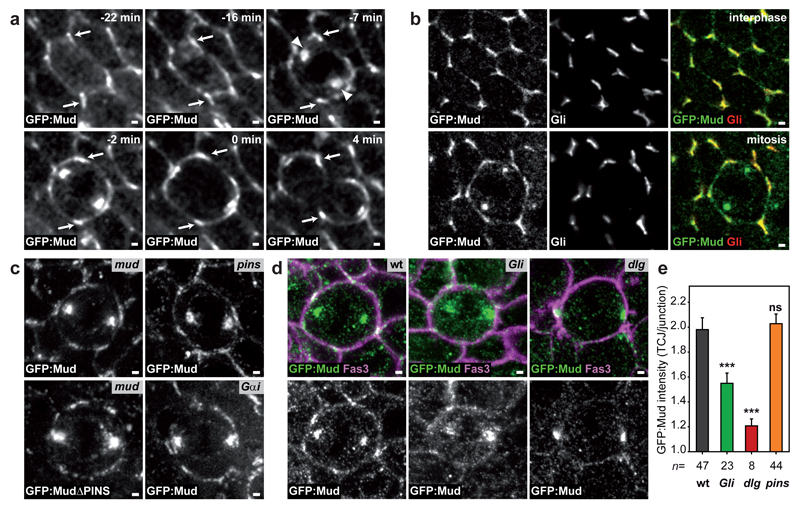
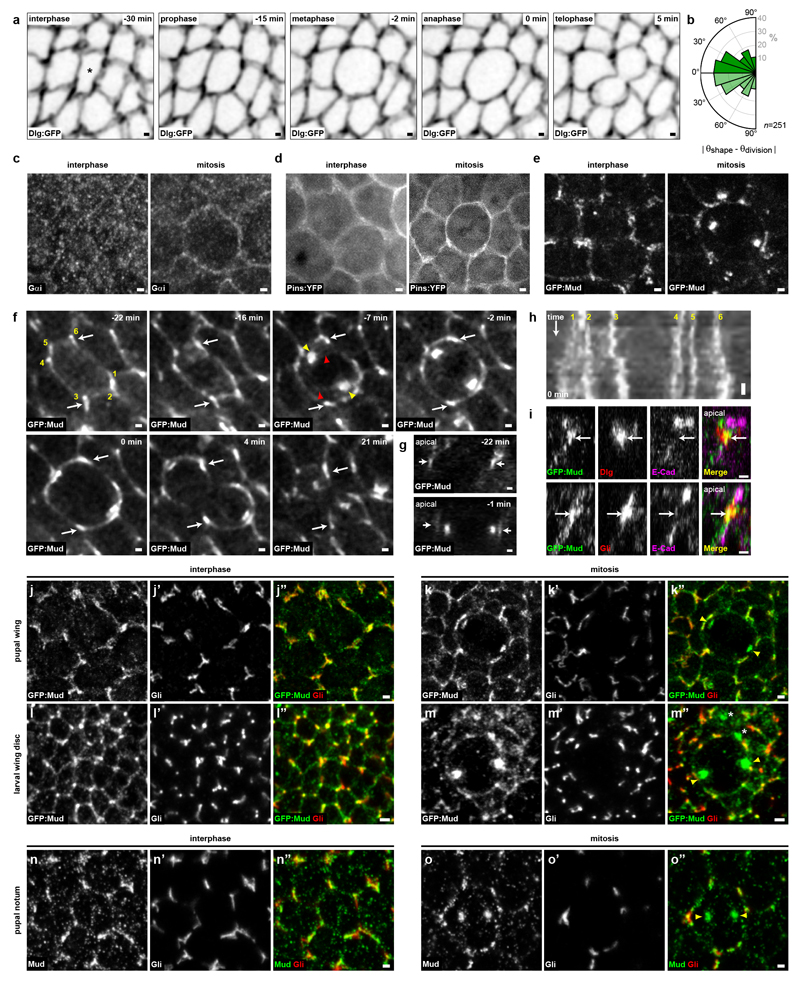
To understand how rounded mitotic cells tend to align their spindle along their interphase shape long-axis, we deciphered the mechanisms of spindle orientation in the Drosophila pupal notum epithelium. Within this tissue, more than ten thousand cells divide13, and, as in many epithelial tissues, the division of rounded mitotic cells takes place in the plane of the tissue and is influenced by their interphase cell shape (Extended Data Fig. 1a,b). One possibility is that Pins (vertebrate LGN) or Gαi polarization orients division as found in single cells in culture or during asymmetric divisions14. However, Pins and Gαi were homogenous around the cortex (Extended Data Fig. 1c,d). In contrast, the distribution of the Dynein associated protein Mud (vertebrate NuMa) suggested a role in orienting the spindle according to the interphase cell shape. GFP:Mudwas localized at the spindle poles and unexpectedly was also enriched at tricellular junctions (TCJs) where at least three cells meet (Fig. 1a, Extended Data Fig. 1e,h and Supplementary Video 1). Accordingly, in this tissue and other pupal or larval epithelial tissue GFP:Mud or endogenous Mud co-localized with Gliotactin (Gli), a septate TCJ marker15 (Fig. 1b and Extended Data Fig. 1i-o). Furthermore, we established that in G2 phase GFP:Mud localizes at TCJs where it persists through mitosis (Extended Data Fig. 2). The TCJ localization of Mud was independent of Pins and Gαi in both interphase and mitotic cells (Fig. 1c-e and not shown). Accordingly, GFP:Mud lacking the Pins binding domain (GFP:MudΔPINS) localizes at TCJs (Fig. 1c). Whereas Mud loss of function did not affect Gli localization, loss of Gli led to a reduction of GFP:Mud localisation at the TCJs (Fig. 1d,e and Extended Data Fig. 3a). Likewise, loss of function of the Discs-large (Dlg) septate protein, which is necessary for Gli localization15 caused the disappearance of both Gli and GFP:Mud from the TCJs (Fig. 1d,e and Extended Data Fig. 3b-d). Collectively, our results show that independently of the Pins/Gαi pathway, epithelial mitotic cells harbour a cortical TCJ Mud distribution inherited from interphase.
Fig. 1. Mud localizes at TCJ.
(a) GFP:Mud from interphase to telophase (t=0 min, anaphase). GFP:Mud at TCJ (arrows), spindle poles (arrowheads). n=21 cells.
(b) GFP:Mud and Gli co-localization in interphase (top, n=54 cells) and metaphase (bottom, n=8 cells).
(c) GFP:Mud localization in mud (n=15), pins (n=22), Gαi (n=5) cells and GFP:MudΔPINS in mud cells (n=18).
(d,e) GFP:Mud distribution (d, images representative of quantifications shown in e) and mean±s.e.m. TCJ intensities (e) in wt, Gli, dlg and pins cells. Fas3, cell contours. t-test (ns: not significant, ***:p<0.0005). n: cell numbers.
Scale bars: 1μm (a, b, c, d).
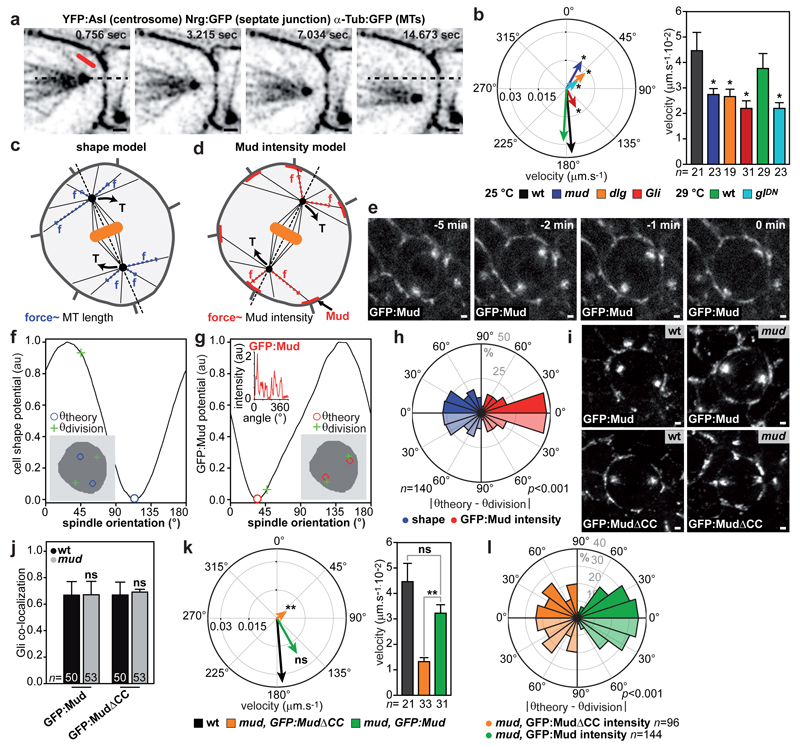
Since astral microtubules (MT) contacted ChFP:Mud patches at TCJ (Extended Data Fig. 4a and Supplementary Video 2), we asked whether TCJs recruit or activate force generators to orient the spindle. Following experiments in C. elegans zygote16, we developed a laser ablation assay to estimate the relative magnitude and the direction of mechanical forces exerted by astral MTs on the centrosome within tissue (Extended Data Fig. 4b and 5). Astral MT ablation in wild-type (wt) cells caused the centrosomes to recoil away from the ablation site, suggesting that MTs predominantly exert pulling forces on spindle poles (Fig. 2a-b and Supplementary Video 3). The loss of Mud or Dynein minus-end directed motor activity led to a reduction in centrosome recoil upon MT ablation (Fig. 2b). In agreement with the role of Gli and Dlg in promoting TCJ Mud localization, centrosome recoil velocities upon MT ablation were also reduced in gli and dlg mutant cells (Fig. 2b). Together, these results indicate that TCJs control the pulling forces exerted by astral MTs on the spindle via Mud and Dynein activities.
Fig. 2. TCJ regulate Mud-dependent MT pulling forces to orient divisions.
(a) Ablation of astral MTs (red line), n=21 cells quantified in b.
(b) Mean centrosome velocity relative to MT ablation site (left), mean velocity amplitude after ablation (mean±s.e.m, right) in wt, mud, dlg and Gli cells at 25°C and in wt and glDN cells at 29°C. t-test (*:p<0.05). Orientations are different in mud, dlg and glDN (Watson’s U2 test, p<0.01).
(c,d) Cell shape (c) and Mud intensity (d) models: pulling forces scale with MT length (blue arrows) or Mud cortical intensity (red arrows) to exert a torque (T, arrows).
(e-g) Experimental spindle orientation (green cross) and predictions based on cell shape (blue circles, f) or GFP:Mud intensity (red circles, g) potentials at t=-1min for cell in e (n=121 cells).
(h) Difference between theoretically predicted (θtheory) (blue: shape, red: GFP:Mud intensity) and experimental (θdivision) spindle orientation. Data are duplicated in a lighter colour relative to 0° line in this and subsequent plots. Kolmogorov-Smirnov test (p value).
(i) Localizations of GFP:Mud in wt (n=54) and mud (n=15) cells as well as of GFP:MudΔCC in wt (n=18) and mud (n=67) cells.
(j) Quantifications (mean±s.e.m) of GFP:Mud or GFP:MudΔCC co-localization with Gli in wt and mud cells. t-test. ns: not significant.
(k) Mean centrosome velocity relative to MT ablation (left), mean velocity amplitude after ablation (mean ± s.e.m, right) in wt and in mud tissues expressing GFP:Mud or GFP:MudΔCC. t-test (**:p<0.005). Orientation is different in mud, GFP:MudΔCC (Watson’s U2 test, p<0.001).
(l) Difference between θtheory (from cortical GFP intensity) and θdivision in mud cells expressing GFP:MudΔCC or GFP:Mud. GFP:Mud in mud and wt (h, red) tissue are similar (p=0.12). Kolmogorov-Smirnov test (p values).
Scale bars: 1μm (a, e, i), n: cell numbers (b, h, j, k, l).
We then investigated whether the Mud distribution at TCJs accounts for the torque exerted by MTs on the spindle to dictate its orientation. To this end, we adapted a mechanical model predicting the spindle orientation according to cell shape17,18. In this model, developed to describe isolated and non-epithelial cells which do not round up at mitosis, the pulling forces exerted by astral MTs scale with MT length and, as a consequence, the model predicts the preferred spindle orientation along the cell long-axis (Fig. 2c). To account for the contribution of Mud to MT pulling forces in epithelia, we modified the model to assume that astral MTs instead pull with a force proportional to the cortical GFP:Mud intensity and independent of MT length (Fig. 2d). We then measured the metaphase distribution of cortical GFP:Mud and cell shapes to compare the predictions based on cell shape and GFP:Mud intensity models for cells in metaphase (Fig. 2e). Strikingly, the model based on GFP:Mud distribution along the cortex predicted spindle orientation and its predictions were significantly better than the ones based on the metaphase cell shape (Fig. 2f-h, Extended Data Fig. 6a-i and Supplementary Table 1). In agreement with the fact that Pins does not regulate Mud localization at TCJs, spindle orientation predictions were similar in wt and pins tissues (Extended Data Fig. 7). To further test the contribution of Mud-dependent MT pulling forces to spindle orientation, we characterized a GFP:Mud mutant deleted of its coiled-coil domain (GFP:MudΔCC, Extended Data Fig. 8). GFP:MudΔCC co-localizes with Gli in wt or mud tissues, but GFP:MudΔCC cannot restore astral pulling forces in mud tissue (Fig. 2i-k). Whereas the GFP:MudΔCC cortical localization predicted spindle orientation in wt tissue (Extended Data Fig. 8d), planar mitotic spindles were not oriented according to the distribution of GFP:MudΔCC in mud tissue (Fig. 2l). Collectively, these findings indicate that TCJ via Mud define the distribution of MT pulling forces specifying the spindle orientation in epithelial tissue.
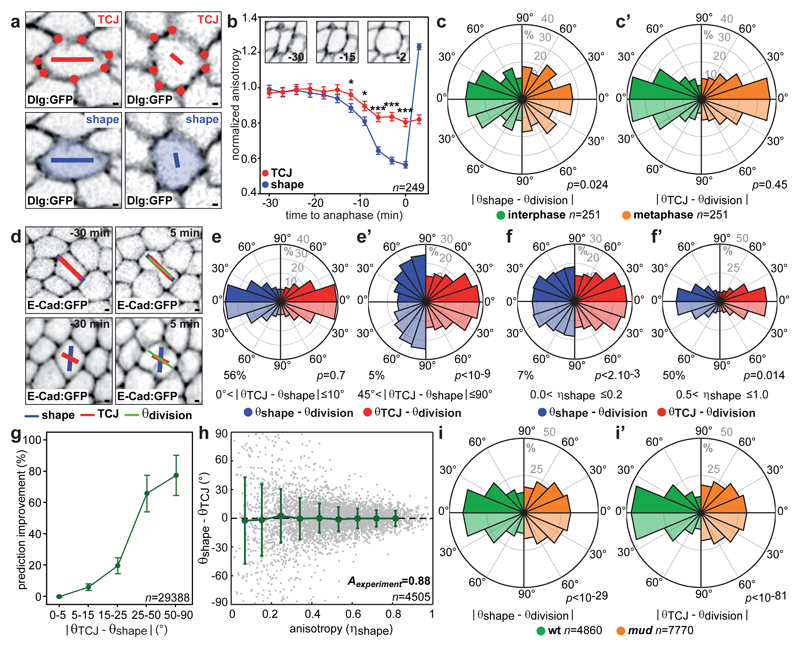
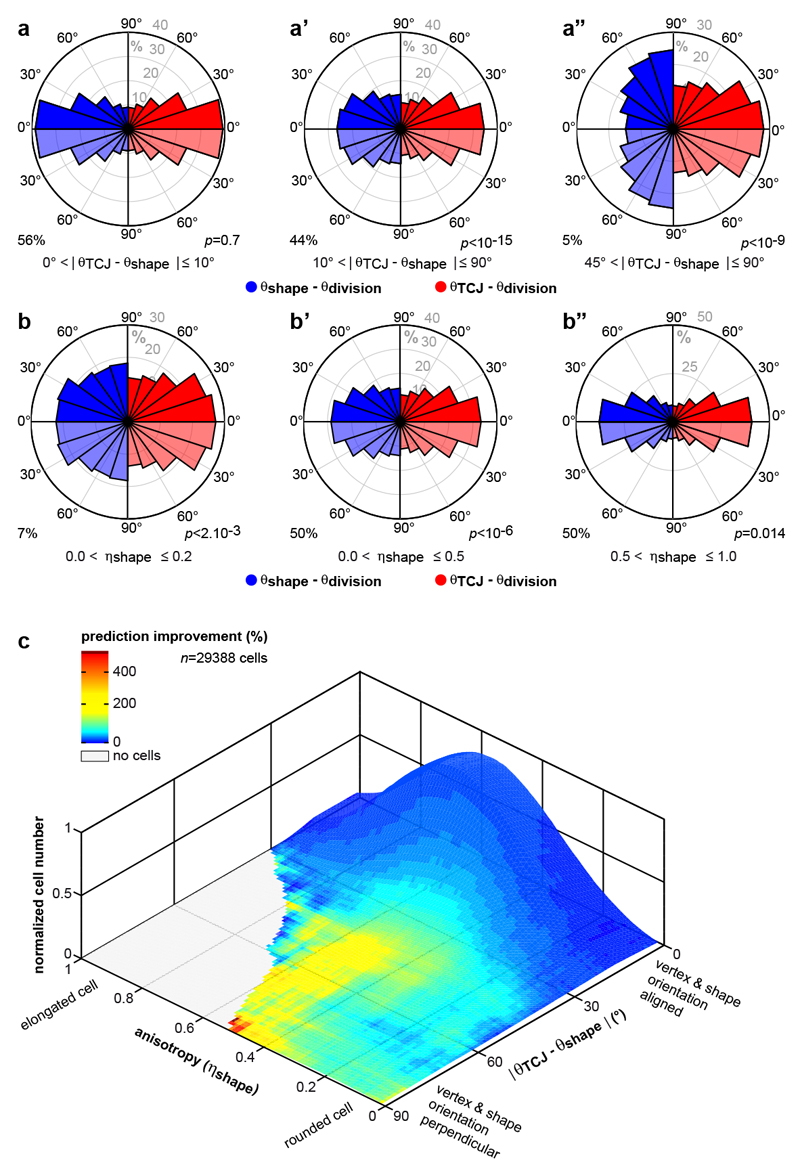
Our finding that in metaphase the Mud distribution at TCJs is a better predictor of spindle orientation than is cell shape argues against a model where incomplete cell rounding ensures interphase cell shape “memorization”. We therefore hypothesized that the interphase TCJ distribution might explain the Hertwig’s rule in tissues. Since our theoretical analysis indicated that spindle orientation is mainly dictated by the anisotropy of the TCJ distribution (Extended Data Fig. 6h,i), we introduced a TCJ bipolarity quantity characterized by an anisotropy (ηTCJ) and orientation (θTCJ) to describe the TCJ angular distribution in a given cell (Fig. 3a and Extended Data Fig. 6j). The TCJ bipolarity anisotropy and orientation can be similar to or distinct from the cell shape anisotropy (or elongation, ηshape) and the long-axis orientation (θshape (Fig. 3a). We found that the anisotropy of TCJ bipolarity decreases much less than cell shape anisotropy during mitotic cell rounding (Fig. 3b). Also, division orientation predictions based on the TCJ distribution, unlike those based on cell shape, were similar in interphase and mitosis (Fig. 3c-c’). These findings support the notion that TCJ bipolarity is a persistent marker of the interphase cell elongation axis during mitotic rounding. We then measured each cell’s average shape (θshape) and TCJ bipolarity (θTCJ) from 60 to 30 minutes prior to mitosis (from late G2 interphase to prior to mitotic rounding) as well as its division orientation (θdivision). Apart from cases where TCJ and shape orientation are aligned (|θTCJ − θshape |<10°), TCJ gives better division orientation predictions than cell shape does, and this improvement increases as the difference between shape and TCJ orientation increases (Fig. 3d-e’,g and Extended Data Fig. 9a). This finding applies for both rounded cells (low ηshape) and elongated cells (high ηshape) (Extended Data Fig. 9b-c). This raises the question of why cells tend to divide according to their interphase cell long-axis. The distribution of the angular difference between TCJ and shape orientation is broad in rounded cells (low ηshape) but narrow in elongated cells (high ηshape) (Fig. 3h). Accordingly, cell shape does not predict cell division axis in rounded cells, and as cell shape anisotropy increases, the predictions based on cell shape agree better and better with the predictions based on TCJ bipolarity (Fig. 3f-g and Extended Data Fig. 9b-c). Hence, in rounded cells TCJ bipolarity and cell shape orientations may be misaligned and division orientation follows TCJ bipolarity, whereas in elongated cells TCJ bipolarity and cell shape orientations are aligned in most cases, and the TCJ distribution ensures that cell division occurs along the former interphase cell shape long-axis. Lastly, cell division orientation along the interphase cell long-axis and TCJ distribution was strongly reduced in mud tissue (Fig. 3i and Extended Data Fig. 5f-g). Altogether, we propose that TCJ, via Mud, constitute the dominant mechanism of division orientation along the interphase cell long-axis.
Fig. 3. TCJ distribution accounts for division orientation along the interphase cell shape.
(a) TCJ (red dots) bipolarity and cell shape (blue) anisotropies η and orientations θ represented by the length and orientation of red and blue bars.
(b) ηTCJ and ηshape from interphase to anaphase (mean±s.e.m). Insets: time-lapse images of a cell from interphase to mitotic rounding (n=249 cells). t-test (*:p<0.05, ***:p<0.0005).
(c-c’) Difference between experimental (θdivision) and predicted division orientations by the average (-20 to -10min interphase, -4 to -3min metaphase) cell long-axis (θshape) (c) or TCJ bipolarity (θTCJ) (c’). Kolmogorov-Smirnov test (p values).
(d) Top: θshape and θTCJ align with θdivision. Bottom: only θTCJ aligns with θdivision. Time-lapse images of 2 cells out of the 29388 cells analysed.
(e-f’) Difference between experimental (θdivision) and predicted division orientations based on interphase TCJ bipolarity (θTCJ) or cell long-axis (θshape) for |θTCJ – θshape| intervals (e-e’) and indicated ηshape intervals (f-f’). Kolmogorov-Smirnov test (p values), percentage of 29388 cells.
(g) TCJ bipolarity (θTCJ) prediction improvement over cell long-axis (θshape) versus |θTCJ – θshape|. mean±s.e.m of three movies for a total of n=29388 cells analyzed.
(h) Differences (mean±s.d.) between θshape and θTCJ versus ηshape. Correlation coefficient Aexperiment = 0.88.
(i-i’) Difference between experimental (θdivision) and predicted division orientations based on interphase cell long-axis (θshape) (left) or the TCJ bipolarity (θTCJ) (right) in wt and mud cells. Kolmogorov-Smirnov test (p values).
Scale bars: 1μm (a, b), n: cell numbers (b, g, h).
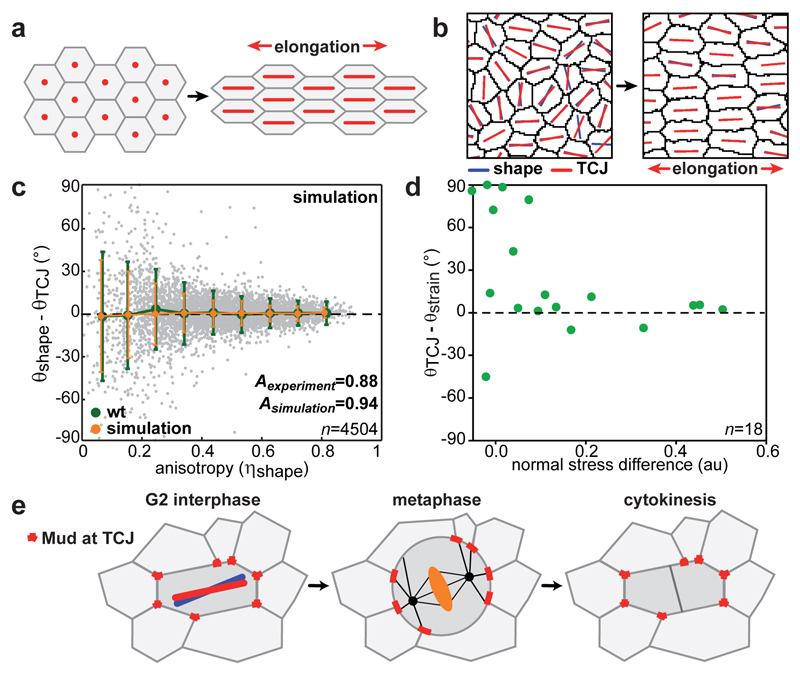
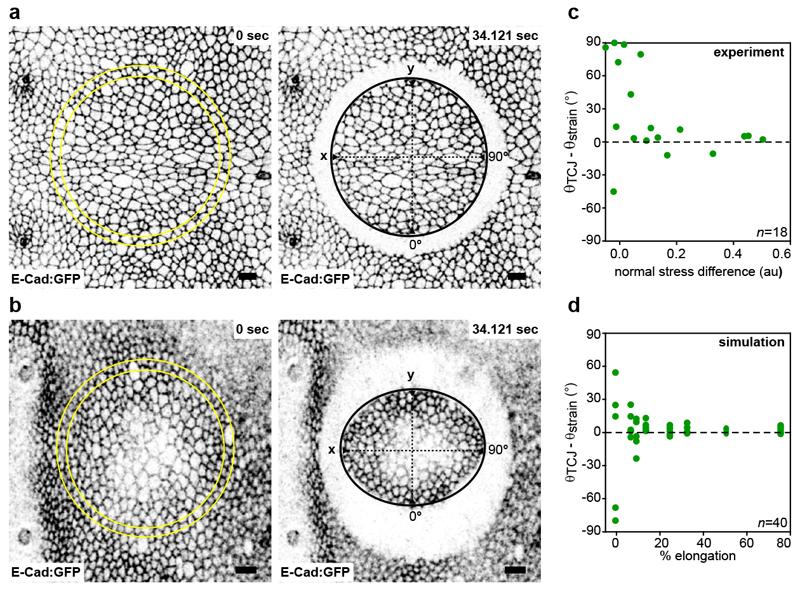
Why are the orientations of cell long-axes and TCJ distributions aligned? This can be understood by picturing regular hexagonal cells, which are then pulled. The cell elongation leads to the alignments of cell shape and TCJ bipolarity orientations with the pulling direction (Fig. 4a). Computer simulation can then be used to model the disordered case of epithelial cells whose shapes depend on adhesion and cortical tension19. The simulations reproduce the alignment between cell shape long-axis and TCJ bipolarity orientations as cell shape anisotropy increases as well as the average alignment of the TCJ bipolarity and mechanical strain orientation (Fig. 4b,c Extended data Fig. 10d and Supplementary Video 4). Therefore generic properties of epithelial cells, adhesion and cortical tension, are sufficient to reproduce the alignment of TCJ bipolarity and cell shape as their anisotropy increases. Furthermore, in agreement with the fact that global mechanical stress tends to elongate cells8,12, the alignment of TCJ bipolarity with mechanical stress increases as tissue stress anisotropy increases, thus accounting for orientation of divisions along the global mechanical stress orientation (Fig. 4d and Extended Data Fig. 10c). Our findings hence indicate that the alignment of TCJ distribution with cell elongation and mechanical stress axis is a core geometric property of epithelial tissues and accounts for a role of TCJ as spatial landmarks providing the information needed for cell shape and mechanical strain orientation sensing.
Fig. 4. TCJ alignment with shape is a core geometric property.
(a-b) Regular hexagonal cells (a) and simulated cell lattice (b) before and after elongation.
(c) Differences (mean±s.d.) between θshape and θTCJ versus ηshape for experimental (Fig. 3g) and simulated cells. Astimulation = 0.94. n: cell numbers.
(d) Difference between θTCJ and principal strain axis (θstrain) versus normal stress differences. n: ablation number.
(e) Upon mitotic rounding, Mud interphase localization is maintained at TCJs orienting the spindle along the interphase cell long-axis.
Altogether our findings provide evidence that TCJ can serve as built-in interphase shape sensors to orient division when the interphase cell shape is well defined. This mechanism is distinct from the ones involving extracellular matrix retraction fibres or signalling17,20–23. It accounts for the integration of two properties of epithelial division: orientation along the interphase cell shape and mitotic rounding (Fig. 4e). The packing of tissue promotes contacts between three (or more) cells and the formation of TCJs. In addition to TCJ proteins implicated in epithelial barrier function24,25, several proteins are enriched at TCJs, including adhesion molecules, cytoskeleton regulators and Hippo pathway component25–29. The alignment of TCJ with cell shape or mechanical strain being a geometrical property of epithelia, TCJ might provide epithelial cells with an axial polarity (or bipolarity) to couple cell shape and tissue mechanics with adhesion, cytoskeleton organization and signalling.
Methods
Fly stocks and genetics
Drosophila melanogaster stocks and associated references are listed in Supplementary Table 2. Flies were crossed and experiments were performed at 25°C unless specified otherwise. Male or female pupae were used. Experiments using the temperature-sensitive allele of p150/Glued, D82glued30 were performed as previously described for temperature-controlled experiments in the Drosophila pupa13. Loss of function, gain of function and dual colored patches experiments were carried out using the FLP/FRT or the MARCM techniques31–33. Somatic clones were induced in the second instar larval stage by heat-shock (20 min at 37°C for FRT19A and FRT40A, 1 h at 37 °C for FRT42D) and analyzed 3-4 days after clone induction in 12-20 hours after pupa formation (hAPF) pupae. The analyses of dlgm52 loss of function clones were performed in small clones (3 days after induction) to avoid AB polarity defects34.
Molecular biology
To create the GFP:Mud or ChFP:Mud transgenes under the control of Mud endogenous promoter, we used recombineering35,36 to introduce a GFP or ChFP tag at the ATG of the mud open reading frame in the CH322-147E14 BAC genomic clone (BACPAC Resources Center). This BAC clone contains ~19.5kb of X chromosome genomic region including ~3.3kb upstream of the mud mRNA 5’ and 5.4kb downstream of the mud 3’ mRNA and thus most of the coding regions of genes proximal and distal to mud locus.
First a galK cassette, amplified with primers F (5’-CATACATATACGGGCGCACACACACCCATAAAAACGCACAAAAATTCGCACCTGTTGACAATTAATCATCGGCA-3’) and R (5’-GATTTACATACCCACTGGAGTAGGACCTTGCGCCAGCTGCGCGTGTCCATTCAGCACTGTCCTGCTCCTT-3’) (underscored letters for galK sequences), was inserted via recombination at the N-terminus of the mud open reading frame. After positive selection, the galK cassette was replaced with a GFP tag, primers F (5’-CATACATATACGGGCGCACACACACCCATAAAAACGCACAAAAATTCGCAATGGTGAGCAAGGGCGAGGA-3’) and R (5’-GATTTACATACCCACTGGAGTAGGACCTTGCGCCAGCTGCGCGTGTCCATCTTGTACAGCTCGTCCATGC -3’) (underscored letters for GFP sequences) or with a ChFP tag, primers F (5’-CATACATATACGGGCGCACACACACCCATAAAAACGCACAAAAATTCGCAATGGTGAGCAAGGGCGAGGAGGATAACATG 3’) and R (5’-GATTTACATACCCACTGGAGTAGGACCTTGCGCCAGCTGCGCGTGTCCATCTTGTACAGCTCGTCCATGCCGCCGGTGGA-3’) (underscored letters for ChFP sequences) via recombination and negative selection for galK37. The attB-P[acman-GFP:Mud]-CmR-BW was integrated into the PBac{y[+]-attP-9A}VK00030 landing site at 50E1, PBac{y[+]-attP-9A}VK00031 landing site at 62E1 and PBac{y[+]-attP-9A}VK00033 landing site at 65B2. The attB-P[acman-ChFP:Mud]-CmR-BW was integrated into the PBac{y[+]-attP-9A}VK00030 landing site at 50E1, PBac{y[+]-attP-9A}VK00031.
Deletions within the GFP:Mud genomic region were created by recombineering using a neomycin resistance cassette flanked by loxP sites38, which were amplified by PCR (see below), at the amino acid positions shown in Extended Data Fig. 8a. Upon neomycin selection, the cassette was removed by Cre-mediated recombination38 leaving behind a 78 bp loxP site sequence. The following primers were used for PCR: MudΔCH: F (5’-CATACATATACGGGCGCACACACACCCATAAAAACGCACAAAAA TTCGCAGGCCTGGTGATGATGGCGGGATC-3’) and R (5’-CTGCTGGGAAGACATGGGCTGACTGAGGTCGAAACCCCTTGTCGGTAAACTCAGAAGAACTCGTCAAGAAGGCG-3’, Note that the MudΔCH is not tagged with GFP); GFP:MudΔCC:
F (5’- GGCTGTTGACGCGCGAATATCTTAGCCAGGCGATCGCCAACGTTGCAGTTCGTTCCTTGTATACGGCGGAGGTGACGCGCATGAAGGAGAAGCAGGAACG-3’) and R (5’-CGTTCCTGCTTCTCCTTCATGCGCGTCACCTCCGCCGTATACAAGGAACGAACTGCAACGTTGGCGATCGCCTGGCTAAGATATTCGCGCGTCAACAGCC-3’); GFP:MudΔPINS: F (5’-CCGTTTCGTCCAGTTCGTCGGCGCCGAACGATGACTGGCAGCCCTTCAAGCGCCACTCCGGCTCCCAGATAAC-3’) and R (5’-CTTACTTTGAGATCTTCGTCCTGGCTGCCCAAATCATATTGGGCAGCATAACTAGTGGATCCCCTCGAGGGACCTAATAAC-3’) and GFP:MudΔTM: F (5’-AATTCACACAACTGGTGGCCGCCTCTTGCAGTAATATCACTACGACTAGCTAGAAGCGGCAACGAAAGCAATGGGAAACGCACAAATCTTGCTGATGATC-3’) and R (5’- GATCATCAGCAAGATTTGTGCGTTTCCCATTGCTTTCGTTGCCGCTTCTAGCTAGTCGTAGTGATATTACTGCAAGAGGCGGCCACCAGTTGTGTGAATT-3’).
The MudΔCH, GFP:MudΔPINS, GFP:MudΔCC and GFP:MudΔTM BAC constructs were integrated at the (PBac{y[+]-attP-9A}VK00030 landing site at 50E1 and at the PBac{y[+]-attP-9A}VK00033 landing site at 65B2.
A deletion of the C-terminal domain of Mud including the Pins and MT binding domains (MudΔC) (see Extended Data Fig. 8a) was created using the CRISPR/Cas9 system39 at the endogenous mud locus. Two sgRNAs (upstream targeting sequence; 5’-CATCCAGTCTAACCAGGCGGAGG-3’ and downstream targeting sequence: 5’-AGATGAGGCGCCGGTCATGTTGG-3’) were inserted into pU6B-sgRNA-short40 and co-injected with purified ssODN 5’- GGCTGCTTCTCGCTTCCAACCAAGAGTTGGAAGAACTAAATTCCATCCAGTCTAACCAGGT-Δ-GACCGGCGCCTCATCTTGTACAGTCTATTCGATCGGCAGTGTGCACATGCAGCCGCTGC-3’ (Δ denotes position of the deletion) in the vas-Cas9 line41. Resulting F1 flies were screened for germline transmission of the deletion by single fly PCR. The F2 progeny was sequenced to confirm the deletion of the C-terminus domain.
Immunohistochemistry and fixed tissue imaging
Pupae were dissected and fixed as previously described42. Primary antibodies were: rabbit anti-Gαi (1:500, provided by JA Knoblich, IMP), rabbit anti-Mud (aa375-549) (1:100043, mouse anti-Gli (1:25044, mouse anti-Dlg (1:1000, DSHB, 4F3), mouse anti-FasIII (1:50, DSHB, 7G10), guinea-pig anti-Cora (1:200045, rabbit anti-GFP (1:2000, Molecular Probes). Fluorescent secondary antibodies were: alexa-488 goat-anti-rabbit IgG (1:500, Molecular Probes), Cy2, Cy3 and Cy5 donkey-anti-mouse IgGs (1:500, Jackson ImmunoResearch). Images were collected with confocal microscopes (LSM710NLO or LSM780, Carl Zeiss). All images are maximum projections of a z-stack unless otherwise indicated.
Live imaging microscopy
Live imaging
Pupae were prepared for live imaging as described previously46. Samples were imaged at 25°C or 29°C with either an inverted confocal spinning disk microscope from Nikon or Zeiss using either 40x NA1.3 OIL DIC H/N2 WD0.2 PL FLUOR, 60x NA1.4 OIL DIC N2 PL APO VC, 63x NA1.4 OIL DICII PL APO or 100x NA1.4 OIL DIC N2 PL APO VC objectives and either a CoolSNAP HQ2 (Photometrics), an EMCCD Evolve (Photometrics) or a CMOS (Hamamtsu) camera. Live images of FUCCI and GFP:Mud were acquired using a confocal microscope (LSM780, Carl Zeiss) and 63x NA 1.4 OIL DICII PL APO objective. To improve signal-to-noise ratio, videos and images for display and segmentation were either deconvolved using Huygens software (Scientific Volume Imaging b.v., NL) or denoised using Safir software47. Average projections of raw z-stack images were used for intensity measurements.
Unless specified otherwise, all experiments on dividing cells were performed during the first round of cell divisions in the notum tissue (12-20 hAPF). In the analyses (unless mentioned otherwise), the time (t) equals 0 was set at anaphase onset defined by the initial cell elongation and/or centrosome movements towards the cortex.
Photobleaching of GFP:Mud or GFP:MudΔCC in neighbouring cells
Since the cortical GFP:Mud or GFP:MudΔCC signals at the TCJ has contributions from both the dividing cell and its neighbouring cells, we performed prediction of spindle orientation based on GFP:Mud or GFP:MudΔCC intensity upon photobleaching of GFP:Mud or GFP:MudΔCC in the neighbouring cells, the residual GFP:Mud or GFP:MudΔCC signal reflecting more faithfully the distribution of GFP:Mud or GFP:MudΔCC at the TCJ in the dividing cells. Having found by Fluorescence Recovery after Photobleaching (FRAP) that GFP:Mud turn-over at TCJ is on the order of tens of seconds (t1/2=21±7 sec, data not shown), a region of approximately 2 cell diameters was photobleached (491 nm laser at 100% power, 12 iterations) around a dividing cell, which was identified by the accumulation of GFP:Mud or GFP:MudΔCC at the spindle poles. Following photobleaching of GFP:Mud or GFP:MudΔCC in neighbouring cells, confocal z-stacks of 14 slices (0.5 μm/slice) were acquired every 1 min. Cells were used for predictions of mitotic spindle orientation when their anaphase onset (t=0) occurred at least 4 minutes after photobleaching ensuring that the GFP:Mud or GFP:MudΔCC signal are mainly contributed by the dividing cells.
Segmentation and tracking of cells during tissue development
To record cell division orientation, cell shape and TCJ bipolarity during development, maximal projected images of multiscale time-lapse videos of pupa notum tissue labelled with either E-Cad:GFP (16-28 z-stacks 0.5μm/slice, 0.322 μm/pixel, 5 min/acquisition, labelling of the apical adherens junctions) or Dlg:GFP (20 z-stacks 0.5μm/slice, 0.205 μm/pixel, 3 min/acquisition, labelling of the septate junctions) were segmented and cell divisions were tracked as in13,48.
GFP:Mud kymograph from interphase to mitosis
To generate the kymograph of the GFP:Mud signal around the cell contour from interphase to anaphase, the cell contour was manually segmented using the GFP:Mud signal. The GFP:Mud intensity of the fluorescence signal was recorded as a function of the angle θ of each contour pixel around the center of mass and then plotted as a line for each time point.
Laser ablations of astral MTs and estimation of cortical forces
Laser ablation of astral MTs were performed in cells labelled with Jupiter:GFP or α-Tub:GFP (MT markers) and Sas-4:RFP, Spd-2:RFP or YFP:Asl (centrosome markers) as well as Dlg:GFP or Nrg:GFP (septate junction markers). Images were captured using a two-photon laser-scanning microscope (LSM710 NLO, Carl Zeiss) equipped with a 63x NA 1.4 OIL DICII PL APO objective (digital zoom 3X) in single-photon bidirectional scan mode lasting δt=756 ms. The astral MTs of mitotic spindles, which were parallel to the plane of the epithelial tissue were severed (t3) using the Ti:Sapphire laser (Mai Tai DeepSee, Spectra Physics) at 890 nm with < 100 fs pulses with a 80 MHz repetition rate typically set at 60% power.
To measure the recoil velocity (amplitude and orientation) of the centrosomes upon astral MT ablation, all spindles were registered horizontally with the ablated astral MTs at the top right and the centrosome positioned at the origin. Centrosome movements were then manually tracked. The velocity (amplitude and orientation) was measured between t2 and t20.
Image quantifications and GFP:Mud and GFP:MudΔCC localization analyses
To measure and compare the TCJ accumulation of GFP:Mud in wt, pins, Gli and dlg cells (Fig. 1e), confocal z-stack average projections at the level of the septate junction (labelled by FasIII, Cora, PH:ChFP or mRFP) were generated using ImageJ from fixed (pins and dlg) or live (wt and Gli) tissues harbouring wt, Gli, dlg and pins mutant cells. Using FasIII, Cora, PH:ChFP or mRFP labelling, the positions of the TCJs in each cell were manually determined. The FasIII, Cora, PH:ChFP or mRFP labelling were used to draw a mask (5 pixels wide) delineating the cell outline at the level of the mitotic spindle (as determined by GFP:Mud localization at the spindle poles) of (pro)metaphase cells. Following background subtraction, the mean intensity at TCJs (10° over each TCJ) was divided by the mean intensity along the rest of the cell outline to obtain the accumulation at TCJs. Significance was determined using the Student’s t-test.
To compare the GFP:Mud or GFP:MudΔCC distributions at TCJ in wt, pins and mud tissues (Fig 2j or Extended Data Fig 7b), their co-localization with Gli were quantitatively compared as follows. Confocal z-stack average projections at the level of the septate junction of fixed (pro)metaphase cells (as determined by DAPI staining) expressing either GFP:Mud or GFP:MudΔCC and labelled with Gli and Coracle (Cora, a septate junction marker) were generated using ImageJ. Using the Cora staining, a mask of 5-pixels wide was manually drawn to measure the raw fluorescent intensity profiles of GFP:Mud or GFP:MudΔCC and Gli in (pro)metaphase cells (as determined by DAPI staining) which were normalised by their total fluorescence intensity upon subtraction of the background intensity. The colocalization factor (C, vertical axis Fig. 2j and Extended Data Fig. 7b) between GFP:Mud or GFP:MudΔCC and Gli was then determined by calculating the area between the GFP:Mud or GFP:MudΔCC and Gli normalized intensity curves.
C equals 1 if the two proteins perfectly co-localize and equals 0 if the two proteins do not colocalize. The comparisons of the distribution of GFP:Mud, GFP:MudΔCC in wt and mud tissues were performed blind (Fig 2j). Significance was determined using the Student’s t-test.
Quantitative analyses of epithelial cell divisions orientation, cell shape and TCJ bipolarity
Measurement of apical-basal (AB) angle of the spindle αAB
The AB orientations of the mitotic spindle (αAB) in the different experimental conditions were determined by measuring the orientation of the centrosomes (marked by Spd-2:RFP, Sas-4:RFP or Sas-4:GFP) relative to the plane of the epithelial tissue (labelled by α-Tub:GFP, Jupiter:GFP or RFP:α-Tub) using a custom ImageJ plugin. Statistical significance was assessed using the Kolmogorov-Smirnov test.
Analyses of cell rounding and mitotic spindle prediction from interphase cell shape and TCJ bipolarity
The analyses of cell rounding from t=-60 min to cytokinesis was performed using Dlg:GFP. The mitotic spindle being positioned at the level of the septate junction (Extended Data Fig. 1g-i), the segmentation of Dlg:GFP cortical signal recapitulates cell shape changes at the level of the spindle and the distributions of TCJ where GFP:Mud is enriched in interphase and mitosis. Due to the spreading of the Dlg:GFP cortical signal along the lateral domain of the cell, the accurate segmentation of the cortical Dlg:GFP signal was achieved by manual correction of each individual cell. This can only be performed on a limited number of cells during their cell cycle (n=249 cells from 2 distinct videos, 3 min temporal resolution).
In order to compare the prediction based on cell shape long-axis versus TCJ bipolarity, a very large number of segmented cells are needed. We therefore used E-Cad:GFP time-lapse videos (5 min temporal resolution) since the segmentation of the E-Cad:GFP signal can be readily automated and accurate segmentation of cell shapes and TCJ positions can be achieved for a very large number of cells. Quantifications shown in Fig. 3e-g and Extended Data Fig. 9 were obtained from 29388 cells analysed from 3 distinct videos.
To compare the prediction based on cell shape long-axis versus TCJ bipolarity in wt (6 videos, n=4860 cells) and mud (8 videos, n=7770 cells) mutant tissue predictions were performed in a specific region of the tissue were spindle misorientation along the AB is very weak (Extended Data Fig. 5f-g).
Upon Dlg:GFP signal or E-Cad:GFP signal segmentation and cell tracking, the following measurements were determined using Matlab:
(i) The experimental cell division orientation (θdivision) was determined as the orthogonal of the interface between the two daughter cells upon cytokinesis. θdivision, which correlates very well with cell division orientation measured by the positions of the two centrosomes at metaphase (R=0.91, n=127 cells, data not shown) as established using time-lapse videos of E:Cad:GFP and Spd-2:mRFP (centrosome marker) labelled epithelial tissue.
(ii) To characterize cell shape elongation (ηshape) and cell shape long-axis orientation (θshape), each cell region was used to construct its inertia matrix.
where npix is the number of pixels in the cell and are the vectors pointing from the barycenter of the cell to each pixel of the cell, p. Its eigenvalues λS, 𝛬S, with 0 < λS < 𝛬S, have the dimensions of a squared distance. Its eigenvector associated to 𝛬S defines the direction of the cell’s long-axis (θshape). The cell shape anisotropy was defined as a dimensionless number, which ranged from 0 for a cell perfectly circular, to 1 for an infinitely stretched cell: ηshape = 1 − λS/𝛬S.
(iii) To characterize the anisotropy (ηTCJ) and orientation of the TCJ (θTCJ) angular distribution, we built the “TCJ bipolarity” matrix V:
where nTCJ is the number of TCJs in the cell and the are the unit vectors pointing from the barycenter of the cell to each cell TCJ, (Extended Data Fig. 6j). Its eigenvalues λTCJ, 𝛬TCJ, with 0 < λTCJ < 𝛬TCJ, are dimensionless numbers. Its eigenvector associated to defines the direction of the long-axis of the TCJ bipolarity (θTCJ). The TCJ distribution anisotropy was defined as a dimensionless number, ranging from 0 for TCJ uniformly distributed around the cell, to 1 for the theoretical case of TCJ split in two groups diametrically opposed: ηTCJ = 1 − λTCJ/𝛬TCJ.
Note that unlike the cell inertia S that is calculated using all the pixels making up the cell, the TCJ bipolarity V solely uses the unit vectors pointing from the cell center to each cell TCJ. By doing so, the TCJ bipolarity disentangle the characterization of TCJ distribution from cell shape measurement, and any correlation observed between the two quantities is not due a shape bias in the TCJ bipolarity measurement. In the example shown in Extended Data Fig. 6j, although the two cells have different shape anisotropies, they share the same set of vectors and have therefore the same TCJ bipolarity.
Both cell shape anisotropy and TCJ anisotropy were normalized to their respective averages over all the cells in the tissue. The cell shape and TCJ distribution anisotropies are represented with bars whose directions give the direction of their respective anisotropies and whose length is proportional to the magnitude of the normalized anisotropy.
To compare the orientations of the cell shape long-axis or the TCJ bipolarity axis with the cell division orientation, the cell shape and TCJ distribution tensors S and V were averaged during late interphase from 60 to 30 minutes prior to the end of cytokinesis. The orientations of the resulting averaged tensors were then compared to the experimental cell division orientation, θdivison.
The improvement of spindle orientation prediction is calculated as NS is the number of cells for which and NTCJ is the number of cells for which The mean improvement and its standard deviation were calculated using the improvement values from three different videos. Similar improvement values are found when determining NS and NTCJ for below 5°, 10°, 20° or 25°.
The correlation coefficient A between TCJ bipolarity and cell long-axis orientation is calculated as
where N is the total number of cells analyzed. For each cell, 𝛥θi equals θTCJ − θshape and ηi is the cell shape anisotropy. The correlation coefficient A ranged from -1 for complete anti-correlation to 1 for complete correlation. In between, a homogeneous distribution indicating an absence of correlation led to A = 0. The correlation coefficient was calculated over all 4504 simulated cells or over an equal number of experimental cells randomly picked (n=4505) among the 29388 cells analyzed in Fig. 3e-g and Extended Data Fig. 9.
As cell division is symmetric in size in the Drosophila notum we have focused on the anisotropy and the orientation of the distribution of the TCJ (bipolarity). The analysis of the asymmetry of TCJ distribution in epithelial tissue where epithelial cells undergo unequal size distribution might provide insights on how unequal daughter cells are generated in epithelial tissue.
Numerical simulations
We used numerical simulations based on the cellular Potts model, which is particularly relevant in biology to describe variable cell shape, size, packing and irregular fluctuating interfaces of cells48–50. We consider a 2D square lattice. Each pixel i has an integer index 𝜎i The m-th cell is defined as the domain consisting of all pixels with the same index value 𝜎i = m. The number of pixels that cell has defines its cell area. A cell shape changes when one of its pixels is attributed to another cell. Here, the evolution is driven by the minimization of a total energy E, which has three physical ingredients: interfacial energy, area constraints and an external force applied to the patch of cells. Since the calculations are performed on a lattice, we have
The first term represents the contribution of the energy of the interfaces between the cells. Minimizing this term leads to perimeter minimization (𝛿 is the Kronecker symbol and Λ is interfacial energy). The second term keeps each cell area Am close to its predefined target value A0(𝛾 is the compressibility). The balance between this term and the preceding one simulates a tissue relaxing towards mechanical equilibrium. The third term describes an energy gradient51,52, i.e. an elastic force field, which pulls on the tissue in opposite directions (k is an elastic constant and is the x-position of the center of the simulated field).
The algorithm to minimize E uses Monte Carlo sampling and the Metropolis algorithm, as follows. We randomly draw (without replacement) a lattice pixel and one of its eight neighboring pixels. If both pixels belong to different cells, we try to copy the state of the neighboring pixel to the first one. If the copying decreases E, we accept it, and if it increases E, we accept it with probability P = e−∆E/T, where ∆E = Eafter − Ebefore. The prefactor T is a fluctuation (random copying) allowance. Because all energy parameters are scalable with T, we can fix it without loss of generality; for numerical convenience, we choose numbers on the order of 103. We define one Monte Carlo time step (MCS) as the number of random drawings equal to the number of lattice pixels. We ran simulations during 600 MCS to reach a tissue shape that no longer evolves (initial image). We then applied a constant bulk force that stretched a tissue and run the simulations for 600 MCS (final image). To obtain a large range of cell anisotropies in the simulations we used simulations with an elastic constant, k=[0;0.5;1;2;3;4;5;10]. For each value of k, 5 simulations (with about 170 cells in each simulation) were run. Using the initial and final images, the tissue elongation along the direction of stretching was calculated for each simulation as the relative increase in distances between landmarks. On the final image, the segmented cell contours were used to determine the tensors V (TCJ bipolarity) and S (inertia matrix) for each cell as well as their averages over all cells in the simulation.
Mechanical stress estimation and TCJ bipolarity orientation
To compare the mechanical stress and TCJ bipolarity orientations as a function of the normal mechanical stress difference (𝜎yy − 𝜎xx), we used 𝜎yy − 𝜎xx experimental values of the estimated mechanical stress obtained up to a prefactor by Bonnet et al.53 measured from 12hAPF to 28hAPF in the medial region of the scutellum, where the mechanical stress is oriented along the medial-lateral axis (𝜎xy = 0 and θstress = 0). The experimental orientation of mechanical stress for each ablation was compared to the average TCJ bipolarity orientation determined using the segmented cell outlines of the E-Cad:GFP cells within the rim of ablated cells (Extended Data Fig. 10a,b).
Models for predicting spindle orientation
Predictions based on experimental Mud distribution and cell shape
For predictions of the mitotic spindle orientation based on GFP:Mud or GFP:MudΔCC signals (thereafter referred to as Mud fluorescence signal) in wt and mud tissues, average intensity (2-4 μm) projections centred around the plane of the centrosomes were generated using a custom ImageJ plugin for the t=-2 min and t=-1 min frames (t=0 corresponding to the anaphase onset). A 5 pixel mask that does not overlap with the GFP:Mud or GFP:MudΔCC centrosome signal was drawn around the cortex to determine using a Matlab script the shape of the dividing cell as well as the cortical Mud signal profiles. The experimental orientation of the mitotic spindle and the positions of the two centrosomes were manually determined using the GFP:Mud or GFP:MudΔCC accumulation at the spindle poles (Fig. 2e,i).
The model predicting spindle orientation from cell shape is similar to the one used in8,18. The model based on Mud fluorescence signal is adapted from this previous model and inputs the distribution of cortical intensity of GFP:Mud or GFP:MudΔCC obtained from a fluorescence image in a mitotic cell17,18. This intensity computed around the cell contour is renormalized, so that the sum of intensities around each treated cell is the same. For each cell, we aimed to compute the global torque T generated as a function of the spindle orientation angle θ (Fig. 2d,g). For each possible spindle orientation θ, (θ varying from 0 to π) we generate two asters of N MTs nucleated at a constant angular density ρ from centrosomes placed at a distance ±L/2 from the spindle center along the axis θ. Both L, which represents the spindle length, and the spindle center are computed from the experimental position of the two centrosomes (Fig. 2e). An MT projecting at an angle ϕ with respect to the spindle contacts the cortex at a given location with a GFP:Mud or GFP:MudΔCC concentration Cmud; and is assumed to pull on the spindle pole it is connected to with a force f[] that scales with Cmud: f[Cmud (θ,ϕ)]~(Cmud)α with the exponent α representing putative non-linearity in how Mud may influence astral MT pulling forces. This yields a torque, τ(θ,ϕ), at the spindle centre projected along the z-axis:
| (Eq. 1) |
The resultant total torque T(θ) generated by the two asters is then obtained by summing the projected torques over all MTs:
| (Eq. 2) |
where Φ is the total angular width of the aster. Initial tests of the model showed that, above a certain threshold, the number of MTs N (or equivalently the angular density: ρ = N/Φ), does not significantly impact axis definition (Extended Data Fig. 6c-f). Thus, in the model, we keep N as a silent parameter, by normalizing the total torque with N. The stable theoretical axis orientation θtheory, can be identified from the minima of the potential U(θ) computed as a primitive of T(θ), and compared with the experimental division axis θdivision (Fig. 2f-h and Extended Data Fig. 6g).
The quality of the prediction was computed based on the magnitude of the angular deviation between the model and the experiments, |θtheory − θdivision|. Overall, the model based on the Mud distribution accounts for observed spindle orientation, with a mean angular deviation magnitude of 27.7° +/- 11.9° (n=140 cells). The shape-based model applied to these same cells predicted a higher mean deviation magnitude of 37.6° +/- 12.3° (n=140 cells). An open question is why the model based on Mud distribution predicts spindle orientation within only 27.7° For comparison, a previous model applied to dividing sea urchin eggs of various shapes made predictions within 15.6°. Although we cannot fully preclude the existence of Mud-independent secondary systems that contribute to spindle orientation, it is important to outline the structural differences in models and biological systems that could explain these differences. One first difference is that the Mud model infers a fluorescence signal distribution which could be in part affected by the imaging itself, yielding variations in Mud signal peak heights or widths which do not reflect the actual force field. In agreement with this, the same model run with cells where the neighbours are not photobleached makes predictions within 32.4°(n=241 cells, data not shown). Another probably more important difference is that in Drosophila epithelial cells the spindles jiggle and move with a time-scale close to mitosis duration (data not shown). In contrast, in large cells like zygotes and blastomeres, division axes are stably set for tens of minutes with negligible movement and rotation of the spindles18,54. Although the lack of a standardized Mud distribution precludes us from computing the effective temperature of the system, the difference in spindle movements suggests that the noise in the Drosophila epithelial system studied is much larger than in these other cell types previously analysed.
Predictions at the tissue scale based on TCJ anisotropy
In order to study spindle orientation across the entire tissue, we used the bipolarity axis of the TCJ distribution in each cell as a proxy for a prediction based on the full Mud protein distribution (see Fig. 3 and the discussion of the tensor 𝑉 earlier in this Supplementary Information). This quantity has the advantages that it relies only on a marker (E-Cad:GFP or Dlg:GFP) that can be reliably imaged over the necessary length and time scales and that the predicted spindle orientations can be computed in a reasonable time, even for tens of thousands of cells. In this section, we show how the bipolarity axis arises naturally as an approximation to a more detailed description that explicitly calculates forces and torques.
We begin by examining in general terms how a cortical force distribution translates into a potential U(θ) governing the spindle orientation. In the context of this analytic formulation, we assume that the rounded, mitotic cells are approximately circles with radius R and center coinciding with the center of the spindle. Points on the cortex can then be labelled by their angle with the positive x axis. If the spindle makes an angle θ with the positive x axis, then a MT projecting from one of the spindle poles at an angle ϕ to the spindle contacts the cortex at an angle 𝛽 = θ + 𝜓 to the positive x axis, where 𝜓 satisfies with cot(ϕ) = cot(𝜓) − 𝜖/sin(𝜓) with 𝜖 = L/2R. (Extended Data Fig. 6h). With this relation, one can translate the integral (2) over φ giving the net torque into an integral over the circle of the form
Similarly, the potential can be written as
Here, we have suppressed the explicit dependence of the force f on Cmud, and the kernel ũ(𝜓) is a 2π-periodic function given, for −π < 𝜓 ≤ π, by
where Ψ is related to Φ as cot(Φ/2) = cot(Ψ) − 𝜖/sin(Ψ).
Importantly, ũ(𝜓) is hence a symmetric function whose magnitude peaks at 𝜓 = 0. That is, within our model the net effect of the MTs is to act as a linear filter that smooths out the cortical Mud distribution without otherwise altering it. We therefore expect that the spindle should generally prefer to orient itself towards the direction of highest Mud concentration but that it is more sensitive to relatively wide, broad peaks of Mud than to the fine details of a rapidly varying Mud distribution. This idea can be expressed more formally by Fourier transforming the periodic functions U, f, and ũ. With U(θ) = ∑n Un exp(inθ), and similarly for f and ũ, we have Un = ρLfnũn for n even and Un = 0 for n odd. The magnitudes of the coefficients ũn are plotted in Extended Data Fig. 6i. As expected, the filter decreases the importance of components with higher n relative to the dominant n = 2 mode. Thus, the orientation of the n = 2 mode of the force distribution f(𝛽) gives the natural, leading approximation to the location of the minimum of U(θ). For forces centered on the TCJs (where the Mud concentration is highest), the n = 2 mode of the TCJ distribution similarly gives the natural proxy for f2 and thus for the orientation of the mitotic spindle. Moreover, the orientation of this bipolar mode can be computed far more efficiently than can the location of the global minimum of a potential including all Fourier modes. Indeed, it is a standard result that this orientation corresponds with the anisotropy axis of the second rank tensor V defined previously. This makes it especially appropriate for use in our tissue-scale calculations.
Statistics
Sample sizes vary in each experiment. Every experiment was done at least three independent times. Statistical significances of protein distribution and velocity amplitude were assessed using Student t-tests: the distribution normalities were checked using Kolmogorov-Smirnov test. In cases where the variances were different, significance was assessed using the unequal variance t-test. The angular distribution of velocity was assessed using Watson’s U2 test for circular data. GFP:Mud localization at TCJ and GFP:Mud or GFP:MudΔCC co-localization with Gli in the different mutant backgrounds were analysed blindly. Kolmogorov-Smirnov tests were used to analyse differences in αAB spindle orientations and differences in division orientation. P values superior to 0.05 are indicated as not significant (n.s.) in figure legends or graphs. Predictions of division orientation based on GFP:Mud or GFP:MudΔCC in mud or wt tissues were performed blindly. Experiments were not randomized and every experiment was repeated at least three independent times.
Code availability
Matlab code used to segment and track cells has been previously published13. Matlab code used to determine division orientation, cell shape and TCJ bipolarity upon cell segmentation and tracking are available upon request.
Extended Data
Extended Data Figure 1. Mud, Pins, Gαi and Gli localization during symmetric epithelial cell division in the Drosophila notum.
Within the Drosophila pupal notum tissue cells divide according to their intephasic cell shape long-axis (a,b), thereby following the 130-year-old Hertwig rule. However, upon entry into mitosis cells round up (the cell shown in a, -15 to -2 min and Fig. 3b).
(a) Time-lapse images of Dlg:GFP in a dividing cell (out of 249 cells quantified in b) in the pupal notum tissue illustrating cell rounding during mitosis (The same cell is shown as inset in Fig. 3b.). Prior to mitosis (-30 min) the cell (marked by asterisk) is clearly elongated and divides according to its interphasic cell shape (5 min). Upon entry into mitosis (-15 min) the cell rounds up and reaches a minimal anisotropy just prior to anaphase (-2 min, see also Fig. 3b).
(b) Rose plot of the difference between the experimental (θdivision) and predicted division orientations by the average (60-30 min prior to mitosis) interphase cell long-axis (θshape). The data are duplicated relative to 0° line (light green). Number of cells (n) analysed is indicated.
(c,d,e) Gαi localization in fixed epithelial dorsal thorax tissue (c), Pins:YFP localization in pins mutant tissue (d) and GFP:Mud localization (e) showing cells in G2 interphase (left) and mitosis (right). Gαi is hardly detected at the cell cortex in G2 phase and Gαi is mostly homogenously distributed around the cortex during mitosis. Pins:YFP is homogenously distributed around the cell cortex in both interphase and mitotic cells. In mitosis Pins:YFP also weakly localizes at the mitotic spindle. GFP:Mud localize at TCJs during interphase and mitosis (see also f). n=24 cells (c, left); n=19 cells (c, right); n=80 cells (d, left); n=12 cells (d, right); n=111 cells (e, left) and 54 cells (e, right).
(f) GFP:Mud time-lapse images from G2 interphase to telophase (n=21 cells). White arrows: GFP:Mud at TCJ (numbered at t=-22min). Red and yellow arrowheads: GFP:Mud on the spindle and its poles, respectively. The same panels -22min to 4min are shown in Fig. 1a. See also Supplementary Video 1.
(g) Apical-basal (AB) sections of the cell in (f) at t=-22min (top) and t=-1min (bottom). White arrows: GFP:Mud at TCJ. n=21 cells.
(h) GFP:Mud kymograph along the cortex (x axis) from t=-22 to t=0 min of the cell in (f). TCJ numbered as in (f). The kymograph shows that during mitotic rounding GFP:Mud spread only modestly along the cortex of the dividing cell. n=21 cells.
(i) AB sections of GFP:Mud, adherens junction marker E-Cad and septate junction marker Dlg (top, n=16 cells) or septate TCJ marker Gli (bottom, n=30 cells).
(j-m) Localizations of GFP:Mud (white in j-m and green in j”-m”) and Gli (white in j’-m’ and red in j”-m”) in fixed pupal wing (j-k) and larval wing disc (l-m) tissues. GFP:Mud colocalizes with Gli at TCJ in G2 interphase and mitotic cells in both the pupal wing and larval wing disc epithelium. Asterisks mark Mud punctate structures present on the nuclear envelope of early G1 cells. Yellow arrows indicate GFP:Mud on the spindle poles. n=20 cells (j-j”); n=5 cells (k-k”); n=63 cells (l-l”) and n=12 cells (m-m”).
(n-o) Localizations of Mud (white in n, o and green in n”, o”) and Gli (white in n’, o’ and red in n”, o”) detected by antibody staining in G2 interphase and mitotic cells in the pupal dorsal thorax tissue. As observed for GFP:Mud (Fig. 1b and Extended data Fig. 1j-m), the endogenous Mud is enriched at TCJ where it co-localizes with Gli in G2 interphase and mitotic cells. Yellow arrows indicate Mud on the spindle poles. n=37 cells (n-n”) and n=21 cells (o-o”).
Scale bars: 1μm (a, c, d, e, f, g, i, j, k, l, m, n, o). 3 min (h).
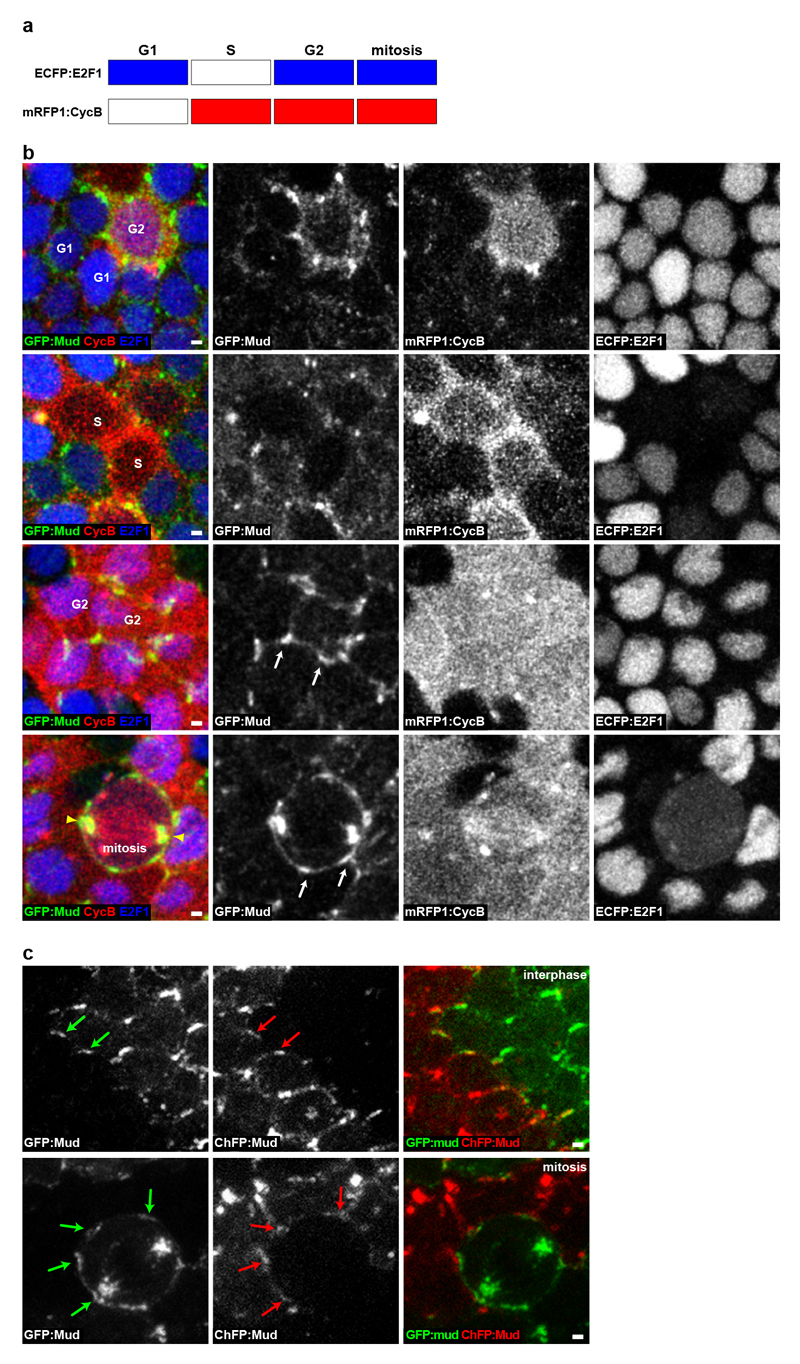
Extended Data Figure 2. GFP:Mud localizes at TCJ from G2 interphase to mitosis.
(a) Scheme depicting the accumulation of the Drosophila FUCCI reporters during the cell cycle. ECFP:E2F1 accumulates during G1 phase, G2 phase and mitosis, whereas mRFP1:CycB accumulates during S phase, G2 phase and mitosis55.
(b) Localization of GFP:Mud (green left column and white in the second column panels), mRFP1:CycB (red in the left column and white in the third column panels) and ECFP:E2F1 (blue in the left column and white in the right column panels) in epithelial cells of the pupal notum tissue. Confocal sections at the level of septate junctions are shown. Cells in G1 (n=21), S (n=6), G2 (n=35) phases and mitosis (n=6) are indicated in the left panels. During both G1 and S phase (upper two row panels), GFP:Mud is weakly localized at the nuclear envelope membrane, weakly localized at the cortex and at the apically localized centrioles (not shown). During G2 phase GFP:Mud becomes prominently localized at the TCJ (one cell in the 1st row panels and 2 cells in the 3rd row panels). Arrows indicate examples of TCJ GFP:Mud accumulation. During mitosis GFP:Mud remains localized at the TCJ and accumulates on the spindle and the spindle pole (bottom row panels). Similar results were obtained on fixed tissue for which the cell cycle phases were determined using the PCNA S-phase marker and the nucleus size to distinguish cells in G1 or G2 interphases (not shown).
(c) GFP:Mud (green arrows) and ChFP:Mud (red arrows) in adjacent tissue patches in G2 (n=31) and mitotic (n=8) cells. The FLP/FRT system was used to generate adjacent groups of cells labelled with either GFP:Mud or ChFP:Mud. By analysing the distribution of GFP:Mud in dividing cells adjacent to ChFP:Mud interphasic cells, we found that GFP:Mud was localized at the TCJs of the dividing cell from G2 through mitosis.
Scale bars: 1μm (b, c).
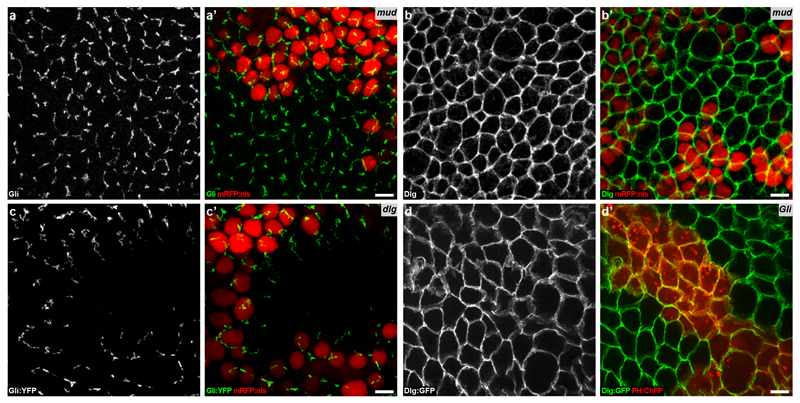
Extended Data Figure 3. Regulation of Dlg, Gli and Mud localization in epithelial tissue.
(a,b) Localizations of Gli (white in a and green in a’, n=2 clones) and Dlg (white in b and green in b’, n=3 clones) in fixed notum tissues harbouring mud clones (identified by loss of mRFP:nls, red in a’-b’). The loss of Mud function does not modify the Gli and Dlg localizations at septate junctions.
(c) Localization of Gli (white in c and green in c’) in fixed notum tissue harbouring a clone of dlg (identified by the loss of mRFP:nls, red in c’, n=13 clones). The loss of Dlg function results in a loss of Gli localization at TCJ.
(d) Localization of Dlg:GFP (white in d and green in d’) in live epithelial dorsal thorax tissue harbouring a Gli clone (identified by expression of PH:ChFP, red in d’, n=5 clones). The loss of Gli function does not affect the distribution of Dlg:GFP at the septate junctions.
Scale bars: 5μm (a, b, c, d).
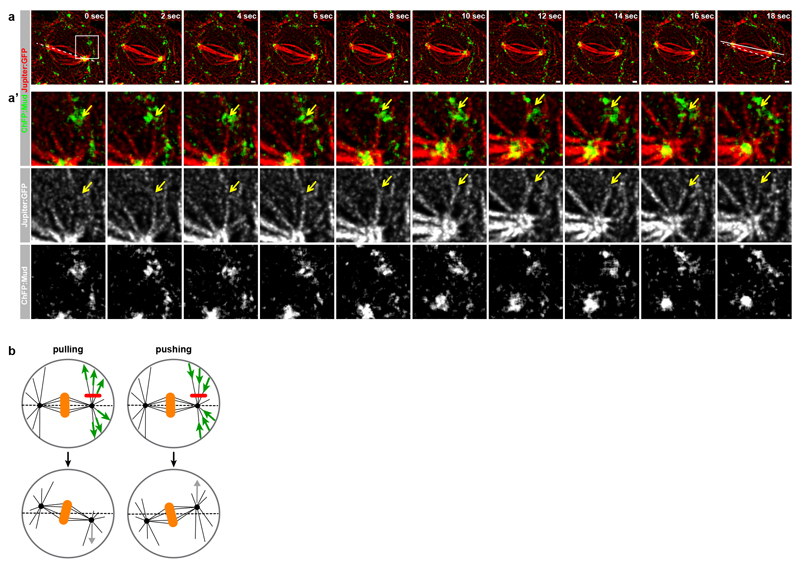
Extended Data Figure 4. Astral MTs contact Mud at the TCJ.
(a,a’) Time-lapse images of ChFP:Mud (green in a and top panels a’, white in bottom panel a’) and of Jupiter:GFP (red in a and top panels a’, white in middle panel a’) in dividing cells (n=11) in the Drosophila pupal notum tissue. The panels in a’ are magnifications of the boxed region in a. Yellow arrow points at an astral MT that contact ChFP:Mud at the cortex and shortens concomitant to the spindle pole movement towards the TCJ and spindle rotation. The dashed line corresponds to the initial spindle orientation and the solid lines correspond to its orientation at the final time point (see Supplementary Video 2). Similar results were obtained in cells expressing GFP:Mud and Tub:RFP to label the MTs (data not shown).
(b) Schematic of the laser-ablation assay used to estimate the origin and magnitude of forces on astral MT required for spindle orientation in the Drosophila pupal dorsal thorax epithelium. Upon ablation (red lines, top), pulling forces (green arrows, left column) or pushing forces (green arrows, right column) yield recoil away (grey arrow, left column) or toward the ablation site (grey arrow, right column), respectively.
Scale bars: 1μm (a).
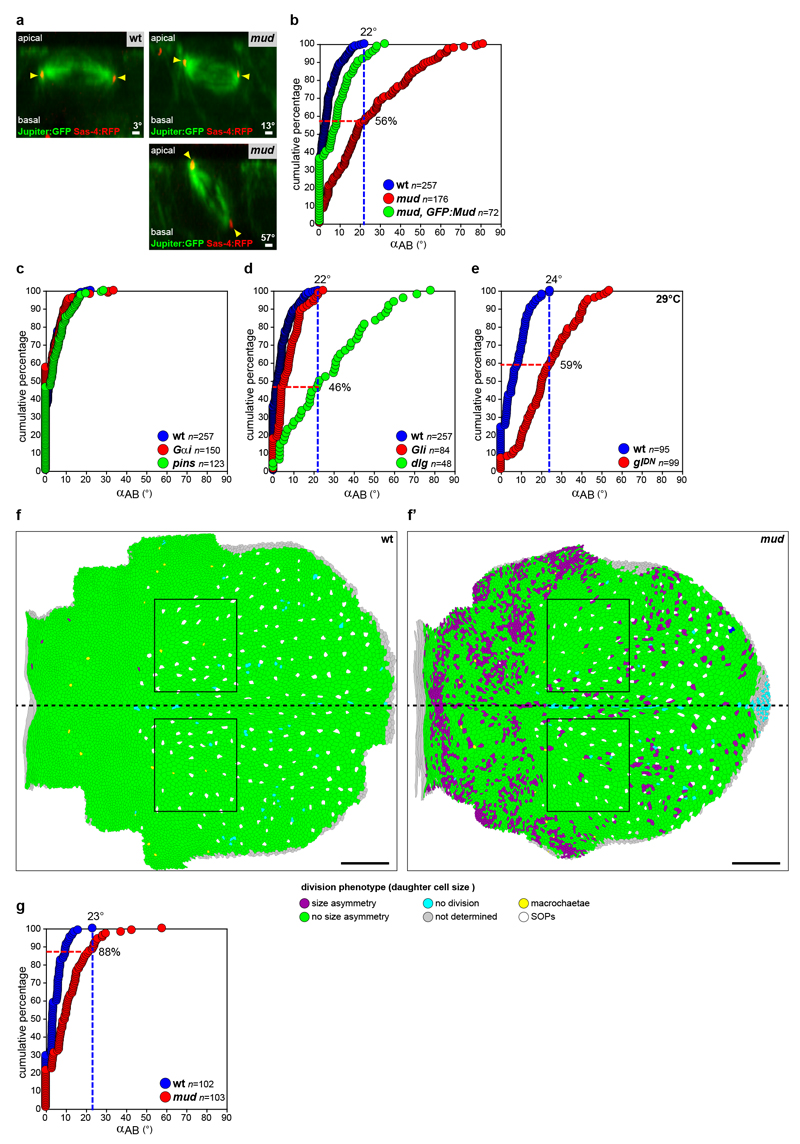
Extended Data Figure 5. A large proportion of mitotic spindles remain planar in the absence of Mud, Dlg and Dynein function.
Loss of Mud activity is known to induce defects in mitotic spindle orientation relative to the apical-basal axis (AB) of the cell31,34,56. Nonetheless, in mud, dlg, dynein (glDN) mutant cells around 50% of the epithelial cell divide with an AB angle (αAB) in the range of the wt tissue (a-e). Since a large proportion of the spindles remain within the plane of the tissue, all analyses reported in the manuscript were performed on cell divisions that occurred within the plane of the tissue. Furthermore, in a central region of the tissue (box in f and f’), 88% of the divisions in mud tissue occur with an αAB in the range of the wt tissue (g). This region was analysed to compare TCJ bipolarity and cell shape based predictions of division orientation in wt and mud tissue (Fig. 3h-h’).
(a) AB views of a dividing epithelial cell in a wt (left panel, out of 257 cells quantified in b) or mud (right panels, out of 176 cells quantified in b) tissue. The spindle is labelled using Jupiter:GFP (green) and the centrosomes using Sas-4:RFP (red). αAB varies from 0° (spindle parallel to the plane of the tissue) to 90° (spindle perpendicular to the plane of the tissue).
(b) Quantification of αAB in wt, mud and in mud tissue expressing GFP:Mud (mud, GFP:Mud). In wt tissue, αAB varies between 0 and 22° (blue dashed line). In mud tissue, 56% of cells divide with a αAB angle lower than 22° (dashed red lines). The expression of GFP:Mud in mud tissue rescues the spindle AB orientation phenotype caused by Mud loss of function. Numbers of cells (n) for each genotype are indicated. The distribution of angles in mud tissue is significantly different from wt (p<10-4), and is restored in mud, GFP:mud (p<10-4). p values, Kolmogorov-Smirnov test.
(c) Quantification of αAB in wt , Gαi and pins. The loss of either Gαi or Pins function does not affect the orientation of the spindle relative to the plane of tissue (p>0.3) in agreement with our findings that Mud localization at TCJ is independent of Pins and Gαi. The analysis in pins tissue confirmed previously published findings46. Number of cells (n) are indicated. p value, Kolmogorov-Smirnov test.
(d, e) Quantification of αAB in wt, Gli and dlg tissues at 25°C (d) and in wt and glDN tissues at 29°C (e). Gli loss of function does not affect αAB orientation, whereas 46% of the dlg cells (p<10-4) and 59% of the glDN cells (p<10-4) divide with αAB lower than 22° and 24°, respectively. Numbers of cells (n) are indicated. p values, Kolmogorov-Smirnov test.
(f-f’) Identification of a region of the notum where AB orientation of the spindle is not affected in mud mutant tissue. Defects in AB orientation of the mitotic spindle result in size asymmetry of the two daughter cells57. Therefore daughter cell size was initially used as a proxy for the magnitude of spindle misorientation along the AB axis in mud tissue. The maps of daughter cell size asymmetry in wt (f) and mud (f’) tissues (green, no size asymmetry; purple strong size asymmetry) revealed that a region (highlighted by the black box, f, f’) in the mud notum tissue exhibits almost no defects in daughter cell size asymmetry. Accordingly the quantification of spindle AB orientation within the region in wt and mud tissue revealed that 88% of the cells of the region divide within the range of the wt cells (see g).
Anterior is to the right and the dashed back line indicates the midline. Colour coding; purple: daughter cells with strong size asymmetry, green: daughter cells with normal size symmetry, cyan: cells for which no division was detected, grey: cells which left the field of view and were not analysed, yellow: macrocheatae, white: sensory organ precursors (SOPs).
(g) Quantification of αAB in wt and mud tissue in the boxed regions in f-f’ was performed as in b-e. Numbers of cells (n) for each genotype are indicated.
Scale bars:1 μm (a), 100 μm (f-f’).
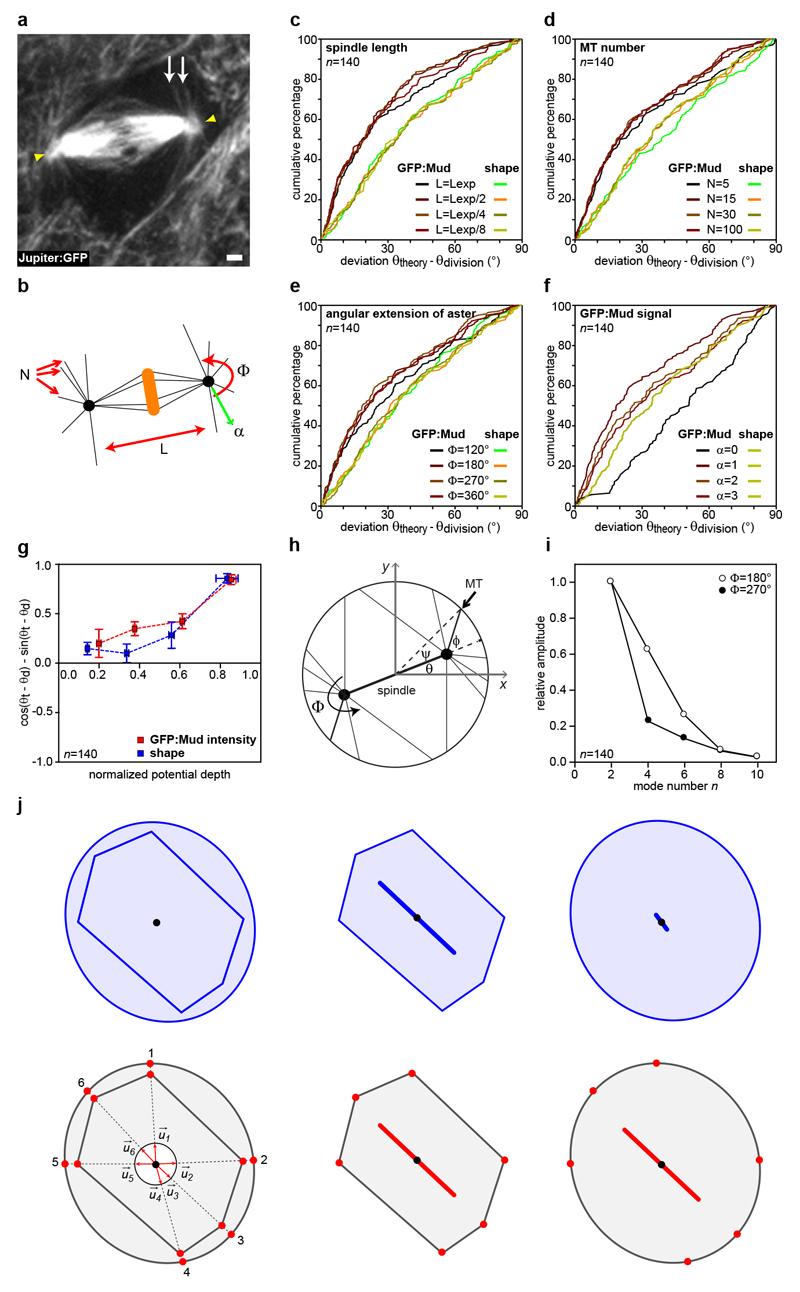
Extended Data Figure 6. Spindle orientation modelling.
(a) Mitotic cell in the Drosophila pupal notum labelled with Jupiter:GFP to label MTs (n=23 cells). White arrows point at astral MTs. Yellow arrowheads indicate spindle poles. Scale bar: 1μm.
(b) Representation of the different parameters that were varied for the predictions based on the GFP:Mud cortical intensity and shape model to estimate their contribution. L: length of the mitotic spindle, N: number of astral MTs, Φ: the angle covered by the astral MTs and α: the GFP:Mud intensity scaling factor. See also Supplementary Table 1.
(c-f) Cumulative plots of the differences between the theoretical spindle orientation (θtheory) and the experimental spindle orientation (θdivision) angles in GFP:Mud expressing cells (same cells as in Fig. 2h) for different spindle lengths (c), MT number (d), angular extension of astral MTs (e) and different scaling factor between the GFP:Mud intensity and mechanical pulling force (f). The GFP:Mud model predictions are mostly independent of spindle length, the number of astral MTs, the angle covered by the astral MTs or the scaling factor between GFP:Mud intensity and MT pulling force.
(g) Dependence of model prediction on shape or GFP:Mud effective potential depth (±s.e.m.). The y-axis quantitates the difference between the theoretical angle (θt) and experimental angle (θd) (1: aligned, -1: perpendicular). A larger potential depth corresponds to more deformed cells for the shape model, and to a sharp and anisotropic GFP:Mud distribution for the cortical model. Model predictions improve with potential depth, suggesting the model can capture the effect of GFP:Mud distributions in a dose-dependent manner. n=140 cells
(h) Definitions of the angles used in the analytical calculation of the contribution of different harmonics to the potential (U(θ). The spindle (heavy black line) makes an angle θ with the positive x axis. An astral MT (thin black line indicated by the black arrow) projects to the cortex (circle) at an angle φ with respect to the spindle. The same MT contacts the cortex an angle β = ψ + θ above the positive x axis.
(i) Normalized magnitudes |ũn|/|ũ2| of the Fourier coefficients of the kernel ũ(Ψ) for n even. The magnitudes |ũn| drop off substantially with increasing n, indicating that for many purposes it should be sufficient to approximate the function U by its lowest, n = 2 mode. To calculate numerical values for the Fourier coefficients, we took the average of the normalized spindle length ϵ = L/2R for the 140 cells (n) analysed in this paper, obtaining ϵ ≈ 0.76 ± 0.03; because it is difficult to precisely estimate Φ from the available data, coefficients are shown for Φ = 180° and 270° in agreement with the astral MT distribution observed in a.
(j) Schematic illustrating the difference between cell shape and cell TCJ bipolarity measurements. An elongated cell and a rounded cell are overlaid (left panels) and shown side-by-side (middle and right panels). In this example, although the two cells have distinct shapes, they have the same TCJ bipolarity. The upper panels illustrate the measurement of cell shape, which uses all the pixels making up the cell (blue bars). The lower panels illustrate the measurement of TCJ bipolarity (red bars), which is solely based on the angular distribution of the TCJs (red dots), only using the unit vectors pointing from the cell center (black dot) to each cell TCJ. The TCJ bipolarity therefore characterizes TCJ distribution independently of cell shape, and a correlation observed between the two quantities is not due to a shape bias in the TCJ bipolarity measurement.
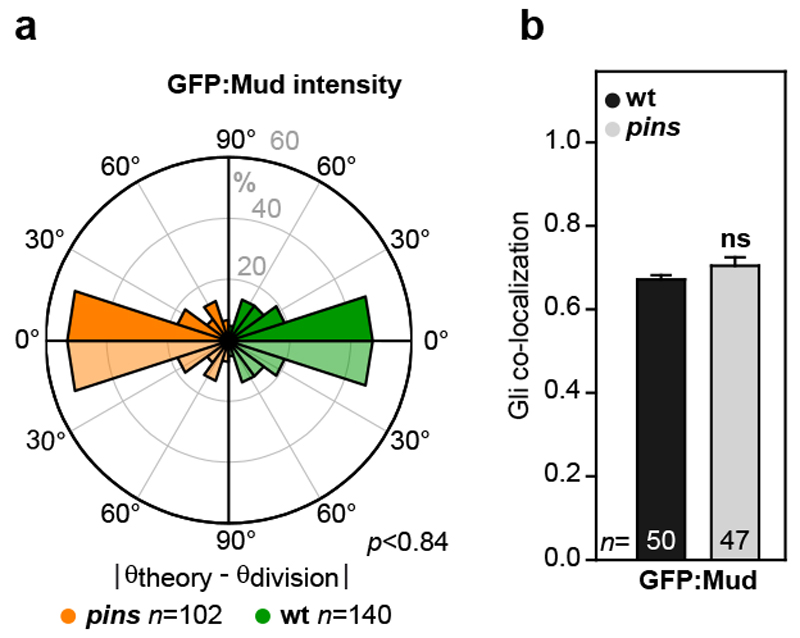
Extended Data Figure 7. Pins does not contribute to Mud-dependent epithelial cell division orientation.
(a) Rose plots of the difference between the theoretically predicted (θtheory) and the experimental division (θdivision) orientation of the mitotic spindle in pins tissue (orange left rose plot) and wt tissue (green right) based on the GFP:Mud intensity. To facilitate the comparison between the left and the right rose plots, the data are duplicated relative to 0° line (light orange and light green).Number of cells (n) analysed is indicated. p value, Kolmogorov-Smirnov test.
(b) Quantifications of the co-localization of GFP:Mud with Gli in pins in metaphase cells (±s.e.m.). Number of cells (n) analysed is indicated. ns: not significant (Student t-test).
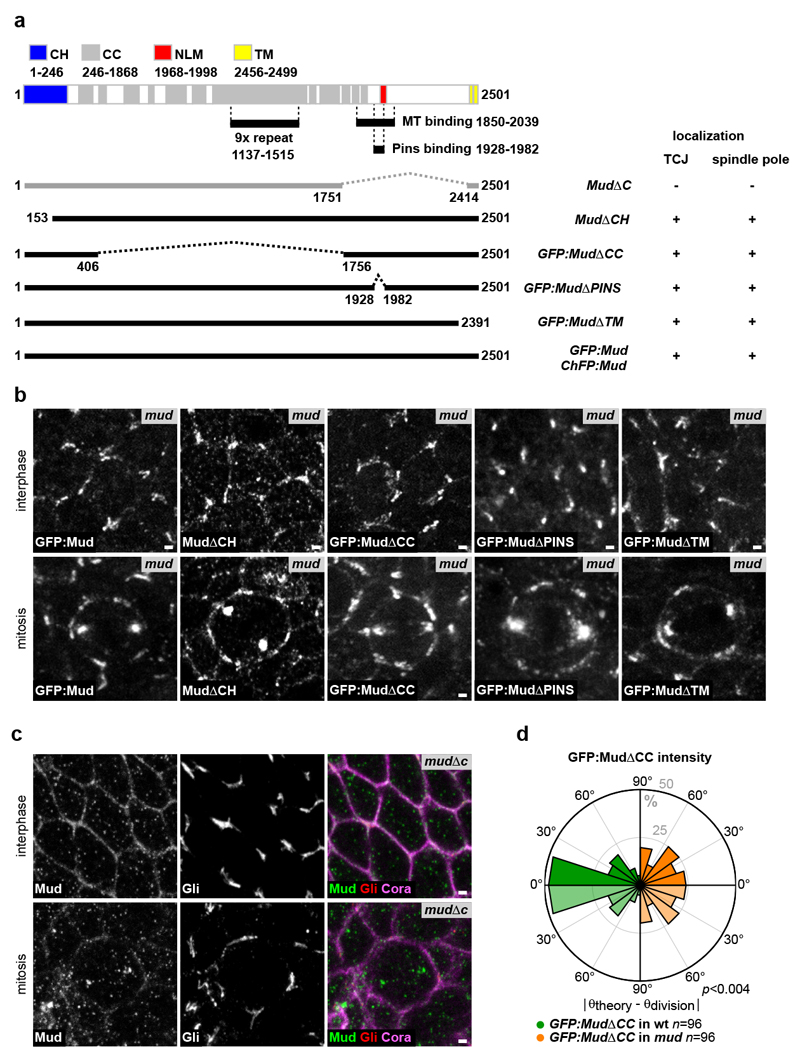
Extended Data Figure 8. Structure-function analyses of the Mud protein in epithelial cells.
(a) Diagram of the domains of the Mud protein: putative actin binding calponin homology domain (CH, aa 1-246, blue), coiled-coil domain (CC, aa 246-1868, grey), conserved Numa/Lin-5/Mud domain (NLM, aa 1968-1998, red), putative transmembrane domain (TM, aa 2456-2499, yellow), 9x repeat domain (aa 1137-1515), MT binding domain (MT, aa 1850-2039) and Pins binding domain (aa 1928-1982)58–60. GFP or ChFP tagged deletion constructs and the MudΔCH constructs were generated by BAC recombineering (see Supplementary Methods for details). The MudΔC allele was generated at the mud locus using a CRISPR/Cas9 approach (see Supplementary Methods for details). For each mutant allele, its localization at the TJCs and its localization at the spindle pole are indicated.
(b) Localization of the GFP:Mud, MudΔCH, GFP:MudΔCC, GFP:MudΔPINS, GFP:MudΔTM and in G2 interphase and mitotic mud epithelial cells. GFP:Mud, GFP:MudΔCC, GFP:MudΔPINS, GFP:MudΔTM proteins were imaged in living tissue, whereas MudΔCH was localised on fixed tissue using Mud antibodies. GFP:Mud (n=56), MudΔCH (n=33), GFP:MudΔCC (n=165), GFP:MudΔPINS (n=42) and GFP:MudΔTM (n=67) interphase cells. GFP:Mud (n=15), MudΔCH (n=4), GFP:MudΔCC (n=67), GFP:MudΔPINS (n=18) and GFP:MudΔTM (n=11) mitotic cells.
(c) Localization of the MudΔC protein (white in the left panels, green in the right panels), Gli (white in the panels in the middle and red in panels at the right) and Cora (magenta in the right panels) in fixed G2 interphase (n=71) and mitotic (n=6) cells. The MudΔC protein is not enriched at TJCs and its localization at the spindle pole is strongly reduced.
(d) Rose plots of the difference between the theoretically predicted (θtheory) and experimental (θdivision) spindle orientation angles in wt (left rose plot, green) and mud (right rose plot, orange) tissues based on the distribution of GFP:MudΔCC. The right rose plot is identical to the one shown in Fig. 2I. To facilitate the comparison between the left and the right rose plots, the data are duplicated relative to 0° line (light green and light orange). Number of cells (n) analysed is indicated. p value, Kolmogorov-Smirnov test.
Scale bars: 1 μm (b, c).
Extended Data Figure 9. Predicting cell division based on TCJ distribution.
(a-a”) Rose plots of the magnitude of the difference between experimental (θdivision) and predicted division orientations by the average (60-30 min prior to mitosis) interphase TCJ bipolarity (θTCJ) or cell long-axis (θshape) in cells for the indicated |θTCJ – θshape| intervals. To facilitate the comparison between the left and the right rose plots, the data are duplicated relative to 0° line (light blue and light red). Kolmogorov-Smirnov test (p values), percentage of total cells (n=29388). Panels b and b” are identical to panels e and e’ in Fig. 3.
(b-b”) Rose plots of the magnitude of the difference between experimental (θdivision) and predicted division orientations by the average (60-30min prior to mitosis) interphase TCJ bipolarity (θTCJ) or cell long-axis (θshape) for the indicated ηshape intervals. To facilitate the comparison between the left and the right rose plots, the data are duplicated relative to 0° line (light blue and light red). Kolmogorov-Smirnov test (p values), percentage of total cells (n=29388). Panels c and c” are identical to panels f and f’ in Fig. 3.
(c) Plot of the spindle orientation prediction improvements (color-coded from dark blue to red) based on TCJ bipolarity over those based on cell shape versus the magnitude of their angular difference (|θTCJ – θshape|) and the cell shape anisotropy (ηshape). The plot height is the normalized cell number in each domain of the plot (29883 cell were analysed in total). As |θTCJ – θshape| increases, the TCJ bipolarity predictions improve over cell shape prediction for both rounded (low ηshape) and elongated cells (high ηshape). Whereas the rounded cells are characterized by an even distribution along the |θTCJ – θshape| axis, the elongated cells are mainly characterized by a strongly skewed distribution towards low |θTCJ – θshape|.
Extended Data Figure 10. TCJ bipolarity aligns with mechanical stress.
(a,b) Images of the scutellum tissue before and after ablation (ablated region in yellow) in early and late pupa characterized by small isotropic stress (a) and high anisotropic stress (b). Tissue stress was estimated by determining the initial recoiled velocity upon circular ablation in the x and y directions53. First and last images of two time-lapse movies out of the 18 quantified in c are shown. Scale bars: 10μm (a, b).
(c) Plot of the difference between the orientation of TCJ bipolarity (θTCJ) and principal strain axis (θstrain) as a function of normal stress differences (σyy – σxx, note that σxy = 0) as estimated up to a prefactor by circular laser ablation. Number of ablations (n) analysed is indicated. The same plot is shown in Fig. 4D.
(d) Plot of the difference between the orientation of TCJ bipolarity (θTCJ) and the orientation of strain (θstrain) as a function of the percentage of cell elongation applied to a simulated cell lattice. When cell elongation increases TCJ bipolarity orientation becomes aligned with the direction of cell elongation. Number of simulations (n) analysed is indicated.
Supplementary Material
Acknowledgments
We thank V. Auld, A. Bardin, R. Basto, B. Edgar, S. Luschnig, F. Schweisguth, the Bloomington Stock Center and Developmental Studies Hybridoma Bank for reagents; M. Manil-Ségalen, S. Rigaud. T. Piolot, I. Bonnet for input and data analyses; the Developmental Biology Curie imaging facility; F. Graner, A. Guichet, S. Herszterg, J L. Maître M. Piel, M. Thery for comments; ANR-MorphoDro, ERC Advanced, ARC (SL220130607097), Curie Mayent-Rothschild, Labex DEEP, NSF DMR1056456 and ICAM grants for funding.
Footnotes
Author contributions
F.B., N.M., Y.B. designed the project. F.B., M.B., A.A., N.C. performed experiments. C.M., Z.W., I.G. produced reagents. O.M., B.G., A.P., N.M. developed methods and scripts for data analysis. O.M. performed simulations. F.B., O.M., B.G., A.P., N.M., Y.B. analysed the data. D.K.L., N.M. developed theoretical models. F.B., O.M., D.K.L., N.M., Y.B. wrote the manuscript.
Author Information
The authors declare no competing financial interests.
References
- 1.Cadart C, Zlotek-Zlotkiewicz E, Le Berre M, Piel M, Matthews HK. Exploring the function of cell shape and size during mitosis. Dev Cell. 2014;29:159–169. doi: 10.1016/j.devcel.2014.04.009. [DOI] [PubMed] [Google Scholar]
- 2.Hertwig O. Das Problem der Befruchtung und der Isotropie des Eies, eine Theory der Vererbung. Jenaische Zeitschrift fuer Naturwissenschaft. 1884 [Google Scholar]
- 3.Baena-López LA, Baonza A, García-Bellido A. The orientation of cell divisions determines the shape of Drosophila organs. Curr Biol. 2005;15:1640–1644. doi: 10.1016/j.cub.2005.07.062. [DOI] [PubMed] [Google Scholar]
- 4.Saburi S, Hester I, Fischer E, Pontoglio M, et al. Loss of Fat4 disrupts PCP signaling and oriented cell division and leads to cystic kidney disease. Nat Genet. 2008;40:1010–1015. doi: 10.1038/ng.179. [DOI] [PubMed] [Google Scholar]
- 5.Aigouy B, Farhadifar R, Staple DB, Sagner A, et al. Cell flow reorients the axis of planar polarity in the wing epithelium of Drosophila. Cell. 2010;142:773–786. doi: 10.1016/j.cell.2010.07.042. [DOI] [PubMed] [Google Scholar]
- 6.Gibson WT, Veldhuis JH, Rubinstein B, Cartwright HN, et al. Control of the mitotic cleavage plane by local epithelial topology. Cell. 2011;144:427–438. doi: 10.1016/j.cell.2010.12.035. [DOI] [PMC free article] [PubMed] [Google Scholar]
- 7.Mao Y, Tournier AL, Bates PA, Gale JE, et al. Planar polarization of the atypical myosin Dachs orients cell divisions in Drosophila. Genes Dev. 2011;25:131–136. doi: 10.1101/gad.610511. [DOI] [PMC free article] [PubMed] [Google Scholar]
- 8.Campinho P, Behrndt M, Ranft J, Risler T, et al. Tension-oriented cell divisions limit anisotropic tissue tension in epithelial spreading during zebrafish epiboly. Nat Cell Biol. 2013;15:1405–1414. doi: 10.1038/ncb2869. [DOI] [PubMed] [Google Scholar]
- 9.Le Goff L, Rouault H, Lecuit T. A global pattern of mechanical stress polarizes cell divisions and cell shape in the growing Drosophila wing disc. Development. 2013;140:4051–4059. doi: 10.1242/dev.090878. [DOI] [PubMed] [Google Scholar]
- 10.Mao Y, Tournier AL, Hoppe A, Kester L, et al. Differential proliferation rates generate patterns of mechanical tension that orient tissue growth. EMBO J. 2013;32:2790–2803. doi: 10.1038/emboj.2013.197. [DOI] [PMC free article] [PubMed] [Google Scholar]
- 11.Xiong F, Ma W, Hiscock TW, Mosaliganti KR, et al. Interplay of cell shape and division orientation promotes robust morphogenesis of developing epithelia. Cell. 2014;159:415–427. doi: 10.1016/j.cell.2014.09.007. [DOI] [PMC free article] [PubMed] [Google Scholar]
- 12.Wyatt TP, Harris AR, Lam M, Cheng Q, et al. Emergence of homeostatic epithelial packing and stress dissipation through divisions oriented along the long cell axis. Proc Natl Acad Sci U S A. 2015 doi: 10.1073/pnas.1420585112. [DOI] [PMC free article] [PubMed] [Google Scholar]
- 13.Bosveld F, Bonnet I, Guirao B, Tlili S, et al. Mechanical Control of Morphogenesis by Fat/Dachsous/Four-Jointed Planar Cell Polarity Pathway. Science. 2012;336:724–727. doi: 10.1126/science.1221071. [DOI] [PubMed] [Google Scholar]
- 14.Kotak S, Gönczy P. Mechanisms of spindle positioning: cortical force generators in the limelight. Curr Opin Cell Biol. 2013;25:741–748. doi: 10.1016/j.ceb.2013.07.008. [DOI] [PubMed] [Google Scholar]
- 15.Schulte J, Charish K, Que J, Ravn S, et al. Gliotactin and Discs large form a protein complex at the tricellular junction of polarized epithelial cells in Drosophila. J Cell Sci. 2006;119:4391–4401. doi: 10.1242/jcs.03208. [DOI] [PubMed] [Google Scholar]
- 16.Grill SW, Gönczy P, Stelzer EH, Hyman AA. Polarity controls forces governing asymmetric spindle positioning in the Caenorhabditis elegans embryo. Nature. 2001;409:630–633. doi: 10.1038/35054572. [DOI] [PubMed] [Google Scholar]
- 17.Théry M, Jiménez-Dalmaroni A, Racine V, Bornens M, Jülicher F. Experimental and theoretical study of mitotic spindle orientation. Nature. 2007;447:493–496. doi: 10.1038/nature05786. [DOI] [PubMed] [Google Scholar]
- 18.Minc N, Burgess D, Chang F. Influence of cell geometry on division-plane positioning. Cell. 2011;144:414–426. doi: 10.1016/j.cell.2011.01.016. [DOI] [PMC free article] [PubMed] [Google Scholar]
- 19.Morelli LG, Uriu K, Ares S, Oates AC. Computational approaches to developmental patterning. Science. 2012;336:187–191. doi: 10.1126/science.1215478. [DOI] [PubMed] [Google Scholar]
- 20.Fink J, Carpi N, Betz T, Bétard A, et al. External forces control mitotic spindle positioning. Nat Cell Biol. 2011;13:771–778. doi: 10.1038/ncb2269. [DOI] [PubMed] [Google Scholar]
- 21.Kwon M, Bagonis M, Danuser G, Pellman D. Direct Microtubule-Binding by Myosin-10 Orients Centrosomes toward Retraction Fibers and Subcortical Actin Clouds. Dev Cell. 2015;34:323–337. doi: 10.1016/j.devcel.2015.06.013. [DOI] [PMC free article] [PubMed] [Google Scholar]
- 22.Tamada M, Zallen JA. Square Cell Packing in the Drosophila Embryo through Spatiotemporally Regulated EGF Receptor Signaling. Dev Cell. 2015;35:151–161. doi: 10.1016/j.devcel.2015.09.015. [DOI] [PMC free article] [PubMed] [Google Scholar]
- 23.Machicoane M, de Frutos CA, Fink J, Rocancourt M, et al. SLK-dependent activation of ERMs controls LGN-NuMA localization and spindle orientation. J Cell Biol. 2014;205:791–799. doi: 10.1083/jcb.201401049. [DOI] [PMC free article] [PubMed] [Google Scholar]
- 24.Byri S, Misra T, Syed ZA, Bätz T, et al. The Triple-Repeat Protein Anakonda Controls Epithelial Tricellular Junction Formation in Drosophila. Dev Cell. 2015;33:535–548. doi: 10.1016/j.devcel.2015.03.023. [DOI] [PubMed] [Google Scholar]
- 25.Furuse M, Izumi Y, Oda Y, Higashi T, Iwamoto N. Molecular organization of tricellular tight junctions. Tissue Barriers. 2014;2:e28960. doi: 10.4161/tisb.28960. [DOI] [PMC free article] [PubMed] [Google Scholar]
- 26.Lye CM, Naylor HW, Sanson B. Subcellular localisations of the CPTI collection of YFP-tagged proteins in Drosophila embryos. Development. 2014;141:4006–4017. doi: 10.1242/dev.111310. [DOI] [PMC free article] [PubMed] [Google Scholar]
- 27.Rauskolb C, Pan G, Reddy BV, Oh H, Irvine KD. Zyxin links fat signaling to the hippo pathway. PLoS Biol. 2011;9:e1000624. doi: 10.1371/journal.pbio.1000624. [DOI] [PMC free article] [PubMed] [Google Scholar]
- 28.Sawyer JK, Harris NJ, Slep KC, Gaul U, Peifer M. The Drosophila afadin homologue Canoe regulates linkage of the actin cytoskeleton to adherens junctions during apical constriction. J Cell Biol. 2009;186:57–73. doi: 10.1083/jcb.200904001. [DOI] [PMC free article] [PubMed] [Google Scholar]
- 29.Oda Y, Otani T, Ikenouchi J, Furuse M. Tricellulin regulates junctional tension of epithelial cells at tricellular contacts through Cdc42. J Cell Sci. 2014;127:4201–4212. doi: 10.1242/jcs.150607. [DOI] [PubMed] [Google Scholar]
- 30.Allen MJ, Shan X, Caruccio P, Froggett SJ, et al. Targeted expression of truncated glued disrupts giant fiber synapse formation in Drosophila. J Neurosci. 1999;19:9374–9384. doi: 10.1523/JNEUROSCI.19-21-09374.1999. [DOI] [PMC free article] [PubMed] [Google Scholar]
- 31.Herszterg S, Leibfried A, Bosveld F, Martin C, Bellaiche Y. Interplay between the Dividing Cell and Its Neighbors Regulates Adherens Junction Formation during Cytokinesis in Epithelial Tissue. Dev Cell. 2013;24:256–270. doi: 10.1016/j.devcel.2012.11.019. [DOI] [PubMed] [Google Scholar]
- 32.Xu T, Rubin GM. Analysis of genetic mosaics in developing and adult Drosophila tissues. Development. 1993;117:1223–1237. doi: 10.1242/dev.117.4.1223. [DOI] [PubMed] [Google Scholar]
- 33.Lee T, Luo L. Mosaic analysis with a repressible cell marker for studies of gene function in neuronal morphogenesis. Neuron. 1999;22:451–461. doi: 10.1016/s0896-6273(00)80701-1. [DOI] [PubMed] [Google Scholar]
- 34.Nakajima Y, Meyer EJ, Kroesen A, McKinney SA, Gibson MC. Epithelial junctions maintain tissue architecture by directing planar spindle orientation. Nature. 2013;500:359–362. doi: 10.1038/nature12335. [DOI] [PubMed] [Google Scholar]
- 35.Venken KJ, He Y, Hoskins RA, Bellen HJ. P[acman]: a BAC transgenic platform for targeted insertion of large DNA fragments in D. melanogaster. Science. 2006;314:1747–1751. doi: 10.1126/science.1134426. [DOI] [PubMed] [Google Scholar]
- 36.Venken KJ, Carlson JW, Schulze KL, Pan H, et al. Versatile P[acman] BAC libraries for transgenesis studies in Drosophila melanogaster. Nat Methods. 2009 doi: 10.1038/nmeth.1331. [DOI] [PMC free article] [PubMed] [Google Scholar]
- 37.Warming S, Costantino N, Court DL, Jenkins NA, Copeland NG. Simple and highly efficient BAC recombineering using galK selection. Nucleic Acids Res. 2005;33:e36. doi: 10.1093/nar/gni035. [DOI] [PMC free article] [PubMed] [Google Scholar]
- 38.Venken KJ, Kasprowicz J, Kuenen S, Yan J, et al. Recombineering-mediated tagging of Drosophila genomic constructs for in vivo localization and acute protein inactivation. Nucleic Acids Res. 2008;36:e114. doi: 10.1093/nar/gkn486. [DOI] [PMC free article] [PubMed] [Google Scholar]
- 39.Gratz SJ, Cummings AM, Nguyen JN, Hamm DC, et al. Genome Engineering of Drosophila with the CRISPR RNA-Guided Cas9 Nuclease. Genetics. 2013 doi: 10.1534/genetics.113.152710. [DOI] [PMC free article] [PubMed] [Google Scholar]
- 40.Ren X, Sun J, Housden BE, Hu Y, et al. Optimized gene editing technology for Drosophila melanogaster using germ line-specific Cas9. Proc Natl Acad Sci U S A. 2013;110:19012–19017. doi: 10.1073/pnas.1318481110. [DOI] [PMC free article] [PubMed] [Google Scholar]
- 41.Gratz SJ, Ukken FP, Rubinstein CD, Thiede G, et al. Highly specific and efficient CRISPR/Cas9-catalyzed homology-directed repair in Drosophila. Genetics. 2014;196:961–971. doi: 10.1534/genetics.113.160713. [DOI] [PMC free article] [PubMed] [Google Scholar]
- 42.Ségalen M, Johnston CA, Martin CA, Dumortier JG, et al. The Fz-Dsh planar cell polarity pathway induces oriented cell division via Mud/NuMA in Drosophila and zebrafish. Dev Cell. 2010;19:740–752. doi: 10.1016/j.devcel.2010.10.004. [DOI] [PMC free article] [PubMed] [Google Scholar]
- 43.Yu JX, Guan Z, Nash HA. The mushroom body defect gene product is an essential component of the meiosis II spindle apparatus in Drosophila oocytes. Genetics. 2006;173:243–253. doi: 10.1534/genetics.105.051557. [DOI] [PMC free article] [PubMed] [Google Scholar]
- 44.Auld VJ, Fetter RD, Broadie K, Goodman CS. Gliotactin, a novel transmembrane protein on peripheral glia, is required to form the blood-nerve barrier in Drosophila. Cell. 1995;81:757–767. doi: 10.1016/0092-8674(95)90537-5. [DOI] [PubMed] [Google Scholar]
- 45.Lamb RS, Ward RE, Schweizer L, Fehon RG. Drosophila coracle, a member of the protein 4.1 superfamily, has essential structural functions in the septate junctions and developmental functions in embryonic and adult epithelial cells. Mol Biol Cell. 1998;9:3505–3519. doi: 10.1091/mbc.9.12.3505. [DOI] [PMC free article] [PubMed] [Google Scholar]
- 46.David NB, Martin CA, Segalen M, Rosenfeld F, et al. Drosophila Ric-8 regulates Galphai cortical localization to promote Galphai-dependent planar orientation of the mitotic spindle during asymmetric cell division. Nat Cell Biol. 2005;7:1083–1090. doi: 10.1038/ncb1319. [DOI] [PubMed] [Google Scholar]
- 47.Boulanger J, Kervrann C, Bouthemy P, Elbau P, et al. Patch-based nonlocal functional for denoising fluorescence microscopy image sequences. IEEE Trans Med Imaging. 2010;29:442–454. doi: 10.1109/TMI.2009.2033991. [DOI] [PubMed] [Google Scholar]
- 48.Bardet PL, Guirao B, Paoletti C, Serman F, et al. PTEN Controls Junction Lengthening and Stability during Cell Rearrangement in Epithelial Tissue. Dev Cell. 2013;25:534–546. doi: 10.1016/j.devcel.2013.04.020. [DOI] [PubMed] [Google Scholar]
- 49.Käfer J, Hayashi T, Marée AF, Carthew RW, Graner F. Cell adhesion and cortex contractility determine cell patterning in the Drosophila retina. Proc Natl Acad Sci U S A. 2007;104:18549–18554. doi: 10.1073/pnas.0704235104. [DOI] [PMC free article] [PubMed] [Google Scholar]
- 50.Graner F, Glazier J. Simulation of biological cell sorting using a two-dimensional extended Potts model. Phys Rev Lett. 1992;69:2013–2016. doi: 10.1103/PhysRevLett.69.2013. [DOI] [PubMed] [Google Scholar]
- 51.Jiang Y, Swart PJ, Saxena A, Asipauskas M, Glazier JA. Hysteresis and avalanches in two-dimensional foam rheology simulations. Phys Rev E Stat Phys Plasmas Fluids Relat Interdiscip Topics. 1999;59:5819–5832. doi: 10.1103/physreve.59.5819. [DOI] [PubMed] [Google Scholar]
- 52.Raufaste C, Dollet B, Cox S, Jiang Y, Graner F. Yield drag in a two-dimensional foam flow around a circular obstacle: effect of liquid fraction. Eur Phys J E Soft Matter. 2007;23:217–228. doi: 10.1140/epje/i2006-10178-9. [DOI] [PubMed] [Google Scholar]
- 53.Bonnet I, Marcq P, Bosveld F, Fetler L, et al. Mechanical state, material properties and continuous description of an epithelial tissue. J R Soc Interface. 2012;9:2614–2623. doi: 10.1098/rsif.2012.0263. [DOI] [PMC free article] [PubMed] [Google Scholar]
- 54.Wühr M, Tan ES, Parker SK, Detrich HW, Mitchison TJ. A model for cleavage plane determination in early amphibian and fish embryos. Curr Biol. 2010;20:2040–2045. doi: 10.1016/j.cub.2010.10.024. [DOI] [PMC free article] [PubMed] [Google Scholar]
- 55.Zielke N, Korzelius J, van Straaten M, Bender K, et al. Fly-FUCCI: A versatile tool for studying cell proliferation in complex tissues. Cell Rep. 2014;7:588–598. doi: 10.1016/j.celrep.2014.03.020. [DOI] [PubMed] [Google Scholar]
- 56.Bergstralh D, Lovegrove H, St Johnston D. Discs Large Links Spindle Orientation to Apical-Basal Polarity in Drosophila Epithelia. Current Biology. 2013;23:1707–1712. doi: 10.1016/j.cub.2013.07.017. [DOI] [PMC free article] [PubMed] [Google Scholar]
- 57.Morin X, Bellaïche Y. Mitotic Spindle Orientation in Asymmetric and Symmetric Cell Divisions during Animal Development. Dev Cell. 2011;21:102–119. doi: 10.1016/j.devcel.2011.06.012. [DOI] [PubMed] [Google Scholar]
- 58.Bowman SK, Neumüller RA, Novatchkova M, Du Q, Knoblich JA. The Drosophila NuMA Homolog Mud regulates spindle orientation in asymmetric cell division. Dev Cell. 2006;10:731–742. doi: 10.1016/j.devcel.2006.05.005. [DOI] [PubMed] [Google Scholar]
- 59.Izumi Y, Ohta N, Hisata K, Raabe T, Matsuzaki F. Drosophila Pins-binding protein Mud regulates spindle-polarity coupling and centrosome organization. Nat Cell Biol. 2006;8:586–593. doi: 10.1038/ncb1409. [DOI] [PubMed] [Google Scholar]
- 60.Siller KH, Cabernard C, Doe CQ. The NuMA-related Mud protein binds Pins and regulates spindle orientation in Drosophila neuroblasts. Nat Cell Biol. 2006;8:594–600. doi: 10.1038/ncb1412. [DOI] [PubMed] [Google Scholar]
Associated Data
This section collects any data citations, data availability statements, or supplementary materials included in this article.


