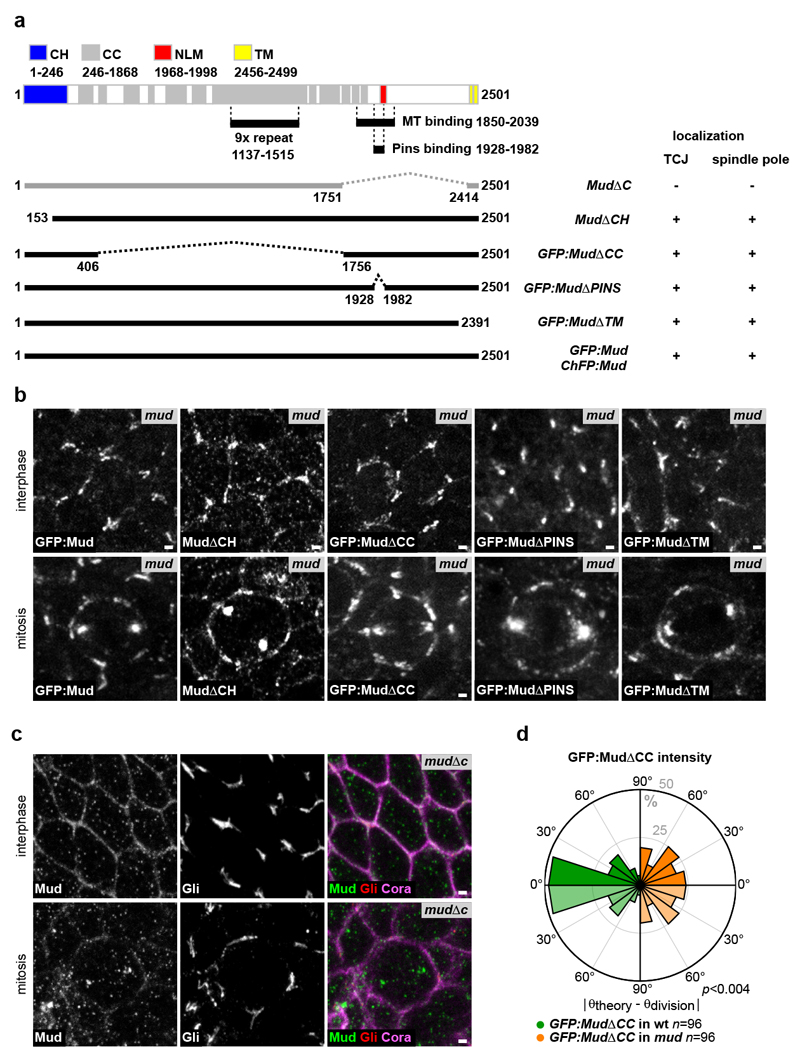
Extended Data Figure 8. Structure-function analyses of the Mud protein in epithelial cells.
(a) Diagram of the domains of the Mud protein: putative actin binding calponin homology domain (CH, aa 1-246, blue), coiled-coil domain (CC, aa 246-1868, grey), conserved Numa/Lin-5/Mud domain (NLM, aa 1968-1998, red), putative transmembrane domain (TM, aa 2456-2499, yellow), 9x repeat domain (aa 1137-1515), MT binding domain (MT, aa 1850-2039) and Pins binding domain (aa 1928-1982)58–60. GFP or ChFP tagged deletion constructs and the MudΔCH constructs were generated by BAC recombineering (see Supplementary Methods for details). The MudΔC allele was generated at the mud locus using a CRISPR/Cas9 approach (see Supplementary Methods for details). For each mutant allele, its localization at the TJCs and its localization at the spindle pole are indicated.
(b) Localization of the GFP:Mud, MudΔCH, GFP:MudΔCC, GFP:MudΔPINS, GFP:MudΔTM and in G2 interphase and mitotic mud epithelial cells. GFP:Mud, GFP:MudΔCC, GFP:MudΔPINS, GFP:MudΔTM proteins were imaged in living tissue, whereas MudΔCH was localised on fixed tissue using Mud antibodies. GFP:Mud (n=56), MudΔCH (n=33), GFP:MudΔCC (n=165), GFP:MudΔPINS (n=42) and GFP:MudΔTM (n=67) interphase cells. GFP:Mud (n=15), MudΔCH (n=4), GFP:MudΔCC (n=67), GFP:MudΔPINS (n=18) and GFP:MudΔTM (n=11) mitotic cells.
(c) Localization of the MudΔC protein (white in the left panels, green in the right panels), Gli (white in the panels in the middle and red in panels at the right) and Cora (magenta in the right panels) in fixed G2 interphase (n=71) and mitotic (n=6) cells. The MudΔC protein is not enriched at TJCs and its localization at the spindle pole is strongly reduced.
(d) Rose plots of the difference between the theoretically predicted (θtheory) and experimental (θdivision) spindle orientation angles in wt (left rose plot, green) and mud (right rose plot, orange) tissues based on the distribution of GFP:MudΔCC. The right rose plot is identical to the one shown in Fig. 2I. To facilitate the comparison between the left and the right rose plots, the data are duplicated relative to 0° line (light green and light orange). Number of cells (n) analysed is indicated. p value, Kolmogorov-Smirnov test.
Scale bars: 1 μm (b, c).

