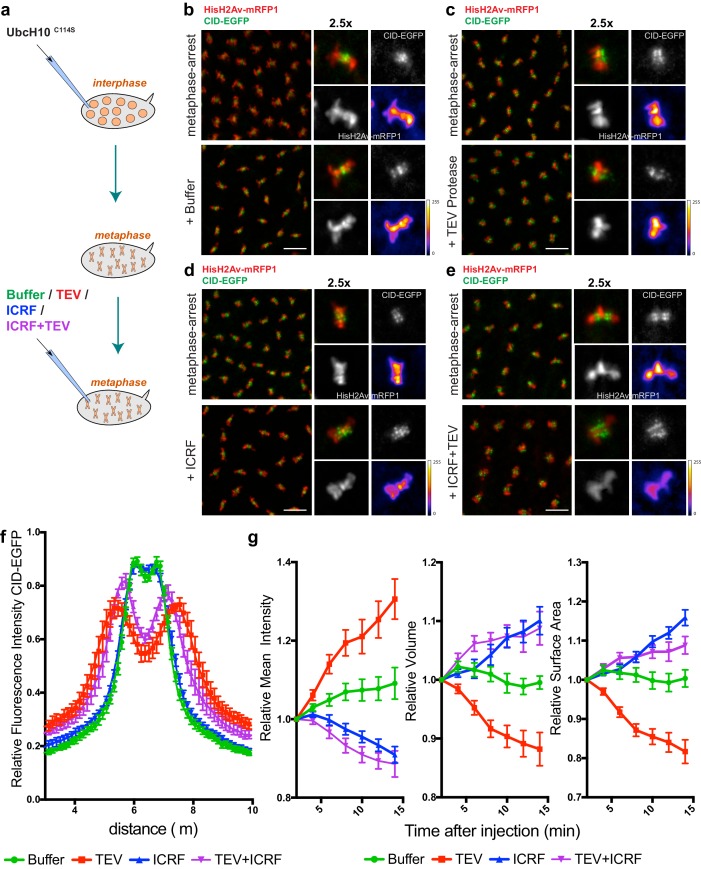
Figure 3. Condensin I inactivation in pre-assembled chromosomes leads to disruption of centromere structure and hyper-compaction of mitotic chromosomes.
(a) Schematic representation of the experimental layout. Embryos expressing solely BarrenTEV were injected with 12 mg/ml of a dominant-negative form of the human E2 ubiquitin-conjugating enzyme (UbcH10C114S) to induce a metaphase arrest. Embryos were subsequently injected with buffer (b), 13 mg/ml TEV protease (c), 280 μM ICRF (d) or a mixture containing 13 mg/ml TEV protease and 280 μM ICRF (e); Images depict embryos before the second injection and 14 min after. Embryos also express His2A–mRFP1 (red) and Cid-EGFP (green); scale bars, 10 μm. Insets show higher magnifications (2.5x) of a single metaphase. Times (minutes:seconds) are relative to the time of the second injection. (f) Quantitative analysis of centromere positioning 10 min after the second injection, as above; graph shows average ± SEM of individual embryos (n ≥ 7 embryos for each experimental condition); for each embryo, a minimum of 8 metaphases was measured; (g) quantifications of mean voxel intensity, volume and surface area of the entire metaphase plate quantified in 3D, over time, and normalized to the time of the second injection. Graphs represent the average ± SEM of individual embryos (n ≥ 10 embryos for each experimental condition); for each embryo, a minimum of 8 metaphases was quantified.
DOI: http://dx.doi.org/10.7554/eLife.26120.008


