. 2017 May 31;6:e23645. doi: 10.7554/eLife.23645

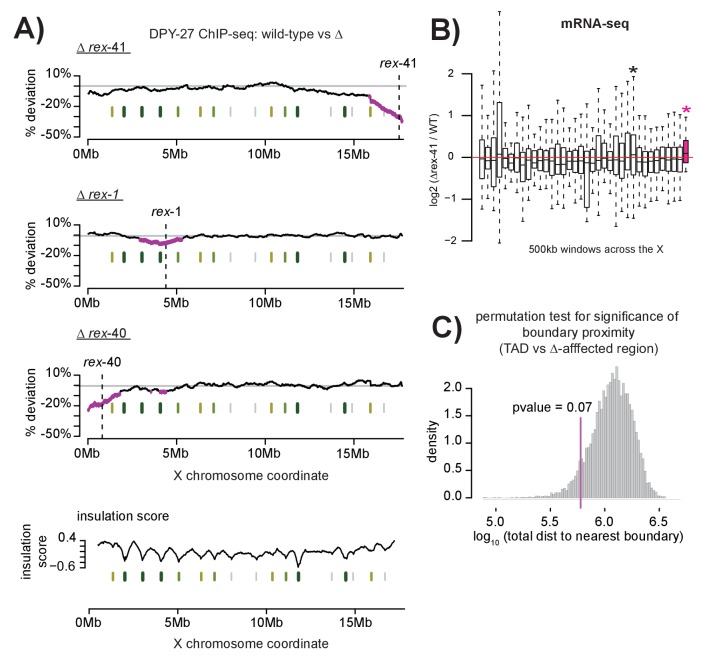
Figure 7. Multiple DCC recruitment sites establish DCC binding within defined X chromosomal domains.

(A) DPY-27 ChIP-seq data was used to calculate percent deviation from wild-type in three different recruitment site deletion strains. Briefly, the log2 ratio between wild-type and deletion strain was calculated for all DPY-27 ChIP-seq peaks and compared to a positive control locus (rex-8, the strongest recruitment site). A variable-step sliding window (window size of 2 Mb stepped across each DPY-27 peak) was used to calculate average deviation from wild-type binding. Regions shown in pink have significantly decreased DPY-27 enrichment compared to the rest of the chromosome, p-value<0.05, determined by one tailed students t-test, comparing log2 ratios in an individual window to log2 ratios across the whole X chromosome. In each experiment, the deleted recruitment site is indicated by a dashed line. Green lines (darker with stronger insulation activity) indicate TAD boundaries (as described in [Crane et al., 2015]). (B) mRNA-seq data comparing rex-41 deletion strain to wild-type is shown. Boxplot indicates the log2 ratio between deletion and wild-type for 500 kb windows tiled contiguously across the X chromosome. The rightmost window, shown in pink, contains a significant number of genes with increased transcription compared to wild-type (fisher test, p-value=0.0126). Asterisks mark windows with p-value<0.05). (C) Summed distance between borders of deletion-affected regions from all three recruitment site deletions in (A) and nearest TAD boundary (min: 54 kb, max: 230 kb) is closer than expected by chance alone (average: 313 kb). Shuffling the boundaries of deletion-affected regions (10000 permutations) produced a normal distribution wherein the observed proximity to TAD borders is expected to occur less than 7% of the time by chance. Shown is the distribution of the summed total distance between permuted deletion boundaries and nearest TAD boundary expressed as a log10 value.

DOI: http://dx.doi.org/10.7554/eLife.23645.014

Figure 7.

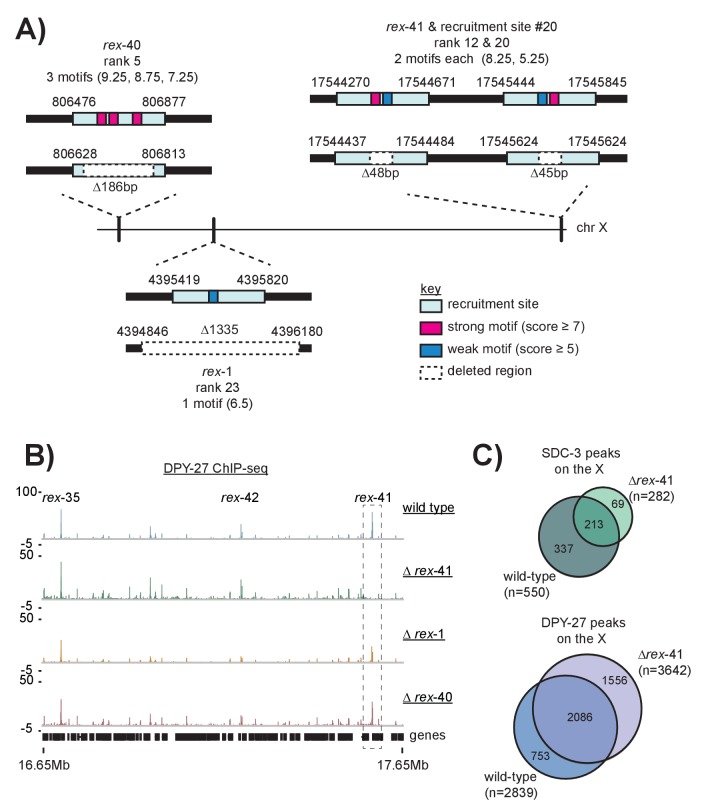
Figure 7—figure supplement 1. Schematic of recruitment site deletions and ChIP-seq data demonstrating DCC recruitment in the deletion strains.

Figure 7—figure supplement 1.

(A) Cartoon indicating location and size of the deleted recruitment sites in Figure 7. Recruitment sites are shown as light blue boxes. Strong motifs are shown in pink, weak motifs are shown in blue. Deleted regions are indicated by dashed boxes. Rex-41 is part of an inverted repeat. The sgRNA used to delete rex-41 (ranked #12) simultaneously deleted its sister recruitment site (ranked #20) 1 kb downstream. (B) DPY-27 ChIP-seq enrichment for the right-most 1 Mb of the X chromosome. Data from wild-type, ∆rex-41, ∆rex-1, and ∆rex-40 is plotted. Dashed box around rex-41 shows lack of recruitment to this site is specific to the ∆rex-41 strain. (C) Overlap of SDC-3 and DPY-27 peaks in wild-type and ∆rex-41 indicate that the gross pattern of DCC binding across the X is not changed in the deletion strain.
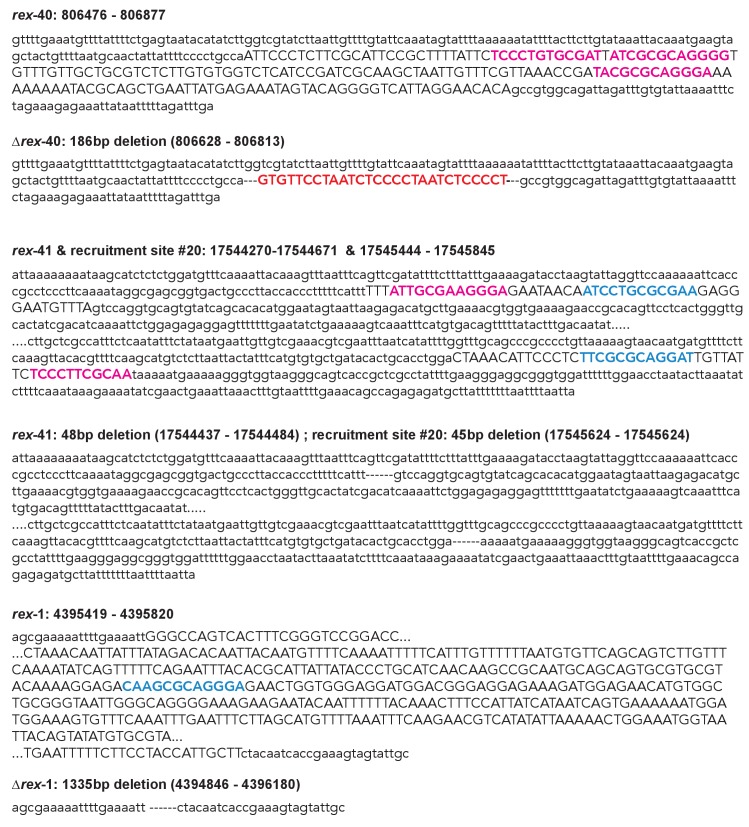
Figure 7—figure supplement 2. Sanger sequencing results from the wild-type and recruitment site deletion strains.

Figure 7—figure supplement 2.

Sequence that is deleted is capitalized and in italics. Strong motifs are given in pink; weak motifs are given in blue. The rex-40 deletion bears a small insert of dpy-10 sequence, indicated in red.
Figure 7—figure supplement 3. Sliding-window analysis of DCC binding change across the X chromosome using different window sizes.

Figure 7—figure supplement 3.

As in Figure 7, DPY-27 ChIP-seq data was used to calculate percent deviation from wild-type. Analysis was repeated for 2 Mb, 1 Mb, and 500 kb windows.
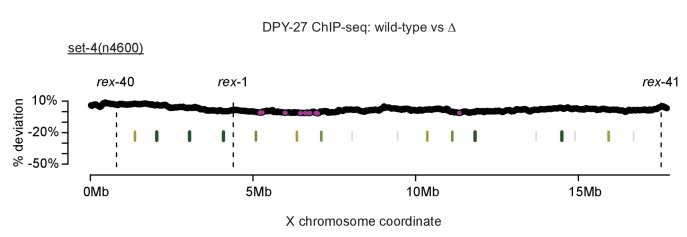
Figure 7—figure supplement 4. Control for sliding-window analysis of DCC binding change across the X chromosome.

Figure 7—figure supplement 4.

As in Figure 7, DPY-27 ChIP-seq data was used to calculate percent deviation from wild-type. The set-4(n4600) mutation affects DCC function but not localization. TAD boundaries are shown in green. Regions with significantly decreased DPY-27 enrichment are shown in pink.
Figure 7—figure supplement 5. 12-bp motif directionality and recruitment site interactions. .

Figure 7—figure supplement 5.

(A) Motif directionality for all strong motifs (score ≥7) contained within annotated recruitment sites across the length of the X chromosome. The numbers in parenthesis indicate the rank of each recruitment site. Motifs on the plus strand are shown in yellow. Motifs on the minus strand are shown in blue. Locations of the recruitment sites are indicated. Strong recruitment sites are shown in pink, intermediate in blue, weak in grey. Insulation boundaries are plotted below the recruitment sites for reference. Insulation boundary strength is indicated: strongest boundaries are in dark green, weakest boundaries in light green. HiC data from (Crane et al., 2015) was used to plot the top 35% of contacts involving recruitment sites. (B) Table listing all recruitment sites, which contain at least one motif. Strong recruitment sites are highlighted. Motif directionality is indicated.