Abstract
Shear-wave imaging optical coherence elastography (SWI-OCE) is an emerging method for 3D quantitative assessment of tissue local mechanical properties based on imaging and analysis of elastic wave propagation. Current methods for SWI-OCE involve multiple temporal optical coherence tomography scans (M-mode) at different spatial locations across tissue surface (B- and C-modes). This requires an excitation for each measurement position leading to clinically unacceptable long acquisition times up to tens of minutes. In this Letter, we demonstrate, for the first time, noncontact true kilohertz frame-rate OCE by combining a Fourier domain mode-locked swept source laser with an A-scan rate of ~1.5 MHz and a focused air-pulse as an elastic wave excitation source. The propagation of the elastic wave in the sample was imaged at a frame rate of ~7.3 kHz. Therefore, to quantify the elastic wave propagation velocity in a single direction, only a single excitation was needed. This method was validated by quantifying the elasticity of tissue-mimicking agar phantoms as well as of a porcine cornea ex vivo at different intraocular pressures. The results demonstrate that this method can reduce the acquisition time of an elastogram to milliseconds.
It is well known that biomechanical properties of tissues can be altered by many diseases such as cancer [1], atherosclerosis [2], and keratoconus [3]. Therefore, assessing the local biomechanical properties of tissues may further aid in the detection and monitoring of disease progression and improve the effectiveness of therapeutic interventions. Thus, there is a great demand for the development of noninvasive elastographic methods that combine an external loading force with an imaging modality, such as magnetic resonance elastography (MRE) [4] and ultrasound elastography (USE) [5]. However, MRE and USE methods require large displacements or contact-based excitation. Furthermore, the limited spatial resolution inhibits use in applications where highly localized information is required or small-amplitude deformations are needed, such as in the case of ocular tissues.
Optical coherence tomography (OCT) is a well-established imaging technique with μm spatial resolution and imaging depth of a few millimeters in tissue [6]. Recently, Fourier domain mode-locked (FDML) lasers [7] and graphics-processing unit (GPU) accelerated software [8] have enabled video-rate volumetric imaging. OCT is a staple in ophthalmology [9] and is actively being developed for other clinical applications such as cardiology [10]. By combining the superior spatial resolution of OCT with external loading, optical coherence elastography (OCE) [11] can provide localized mechanical information with μm spatial resolution [12]. Furthermore, by utilizing the phase of the complex OCT signal, displacement sensitivity can reach the nm scale [13]. The advantages of OCE have been demonstrated for tissue margin detection [14], engineered tissue characterization [15], and depth-resolved assessment of corneal elasticity [16].
Previously, OCE has been able to achieve high equivalent frame rates of several kilohertz but required multiple stimulations and loading source synchronization [17,18]. In our previous work, we have developed shear-wave imaging optical coherence elastography (SWI-OCE), which is a noncontact method of assessing the mechanical properties of soft tumors [19], cardiac muscle [20], hyaline cartilage [21], and the cornea [22] utilizing multiple parameters obtained from the elastic wave propagation, such as velocity, attenuation, and spectral analysis. We were able to achieve “kilohertz-equivalent” frame rates, but this method required point-wise M-mode scanning and air-pulse excitation for each OCE measurement position. This resulted in a total acquisition time of up to tens of minutes, which is not feasible for many clinical applications. In this work, we present the first report of noncontact true kilohertz frame-rate phase-sensitive optical coherence elastography. A single focused air-pulse was used to induce an elastic wave in tissue-mimicking agar phantoms of various concentrations and porcine cornea ex vivo. The elastic wave was imaged directly by a home-built phase sensitive OCE system, and the group velocity of the elastic wave was translated to Young’s modulus. The OCE-based values were validated by uniaxial mechanical testing system.
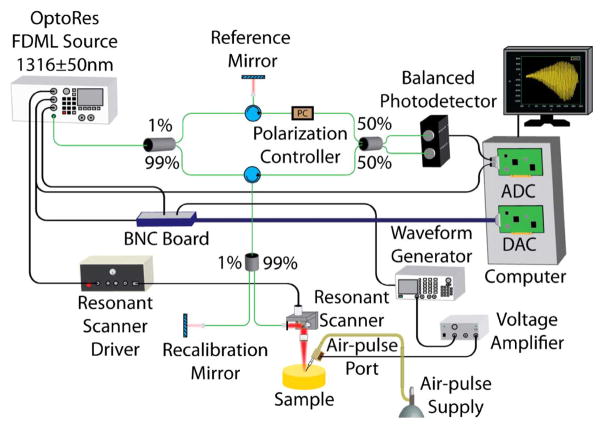
Tissue-mimicking agar phantoms (Difco nutrient agar, Beckton, Dickinson and Company, Sparks, Maryland, USA) of various concentrations (1%, 1.5%, and 2% w/w, n = 3 of each concentration), with ink for increased scattering (in NIR), were first used for validation of the technique. The OCE system was comprised of a phase-sensitive OCT system, ~7.3 kHz resonant scanner (Electro-Optical Products Corp., New York, USA), and a home-built air-pulse delivery system. Briefly, the OCT system was composed of an FDML-swept source laser (OptoRes Gmbh, Munich, Germany) with an A-scan rate of ~1.5 MHz, central wavelength of 1316 nm, scan range of 100 nm, output power up to 160 mW, axial resolution of ~16 μm, sensitivity of 106 dB, and phase stability of ~14 nm in air. An arbitrary waveform generator was synchronized with the OCT system and output a 2-ms wide square pulse to a voltage amplifier. The amplifier drove an electronically controlled solenoid that expelled the air-pulse through a cannula port with an inner diameter of ~150 μm and a flat edge. The tip of the air-port was kept ~250 μm from the surface of the sample to reduce the influence of any near-field effects. A schematic representation of the OCE setup can be seen in Fig. 1.
Fig. 1.
Schematic of OCE setup.
A focused air-pulse was delivered to the sample surface and induced a small deformation (μm scale), which then propagated as an elastic wave through the sample [23]. The elastic wave was imaged by the OCT system by continuous B-scans of ~4 mm along the elastic wave propagation path (B-M mode) for ~30 ms, and only the linear scan region of the scanner was utilized for calculations. Immediately after the OCE measurements, the elasticity of each agar phantom was measured by a uniaxial mechanical testing system (Model 5943, Instron Corp., Massachusetts, USA).
The OCE phase data was corrected for surface motion and the refractive index mismatch between air and the sample [24]. The corrected phase data was converted to displacement by
| (1) |
where ϕ(t) was the temporal phase profile obtained from the phase difference between successive B-scans [25], and λ0 was the central wavelength of the OCT system.
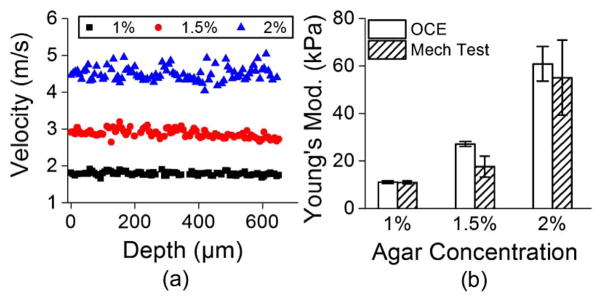
The elastic wave group velocity was determined by cross-correlation analysis of the normalized temporal displacement profiles of each OCE measurement position (n = 75) for a given imaged in-depth layer [21]. The subsequent propagation delays were linear fitted with the corresponding distances of the OCE measurements positions to calculate the elastic wave group velocity. Figure 2(a) presents typical depth-wise velocities of a 1%, 1.5%, and 2% agar phantom sample from a single measurement. The velocities were then averaged and used to quantify sample elasticity using the surface wave equation [19,23]
Fig. 2.
(a) Depth-wise group velocity of the elastic wave in a 1%, 1.5%, and 2% agar phantom. (b) Elasticity of the 1%, 1.5%, and 2% agar phantoms as assessed by OCE and uniaxial mechanical testing.
| (2) |
where ρ = 1000 kg/m3 was the sample density, ν = 0.49 was Poisson’s ratio to account for the near incompressibility of the agar phantoms, and cg was the elastic wave group velocity. This equation does not represent the true complexity of elastic wave in the cornea and was used here for its simplicity, which allows for rapid elasticity estimation.
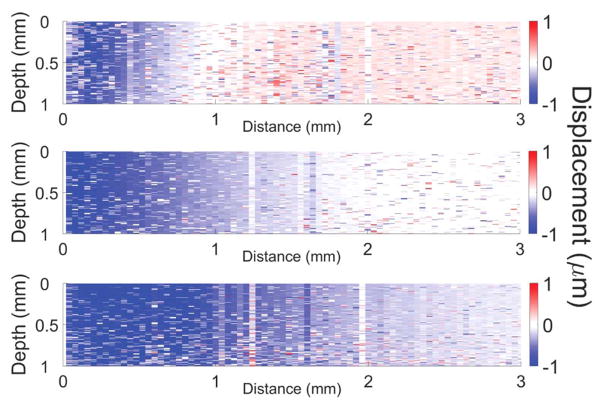
Because the acquisition time for each OCE measurement was ~30 ms, multiple measurements (n = 10) were taken at different areas of each phantom and averaged sample-wise for each phantom concentration. The elasticity of the agar phantoms as quantified by Eq. (2) and obtained from uniaxial mechanical testing system is depicted in Fig. 2(b). The elasticity of the 1% agar phantoms was 11.0 ± 0.6 kPa and 11.0 ± 0.7 kPa as assessed by OCE and mechanical testing, respectively. For the 1.5% agar phantoms, the Young’s modulus obtained by OCE was 27.2 ± 1.0 kPa and 17.6 ± 4.4 kPa by mechanical testing. The Young’s modulus of the 2% agar phantoms was 60.9 ± 7.3 kPa as quantified by OCE and 55.1 ± 15.8 as assessed by mechanical testing. Media 1 depicts the elastic wave propagating in a 1% (top), 1.5% (middle), and 2% (bottom) agar phantoms (played 1000× slower than real-time). Figure 3 is a still frame from Media 1 showing the propagation of the elastic wave through the agar phantoms at 1.2 ms after excitation. From Media 1 and Fig. 3, it can clearly be seen that the elastic wave velocity increases as a function of agar concentration, as expected.
Fig. 3.
Still frame from Media 1 showing the elastic wave propagation through a 1% (top), 1.5% (middle), and 2% (bottom) agar phantom at 1.2 ms after excitation.
The slight discrepancies between the OCE and mechanical testing may be due to the assumptions made during the derivation of Eq. (2) and the characteristic “J” shape of the agar phantom stress-strain curve [26]. Nevertheless, the 1.5-MHz OCE results show that this method allows noncontact quantification of sample elasticity similar to uniaxial mechanical compression testing.
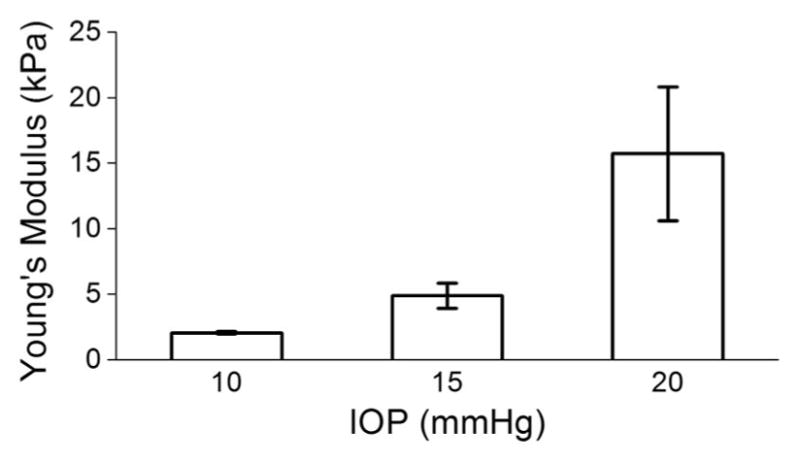
After these preliminary experiments, the elasticity of a porcine cornea at different intraocular pressures (IOP) was assessed. A whole fresh juvenile porcine eye (J&J Packing Corp., Texas, USA) was cannulated with two needles for artificial IOP control after all extraneous tissues such as muscles and epithelium were removed. One needle was connected to a micro-infusion pump, and the other needle was connected to a pressure transducer. Multiple OCE measurements (n = 3) were taken at IOPs of 10, 15, and 20 mmHg at a rate of 1 Hz for each measurement. Figure 4 shows that utilizing Eq. (2), the elasticity of the porcine cornea was estimated to be 2.1 ± 0.1 kPa, 4.9 ± 1.0 kPa, and 15.7 ± 5.1 kPa at 10, 15, and 20 mmHg IOP, respectively. Even though the OCE measurements were taken over the same region, the high variance in the 20-mmHg IOP measurement may be due to the increased inhomogeneity at higher IOPs [27] and limited number of temporal pixels available for velocity calculations. These results correlate with data previously reported by OCE [28] and fall within the values reported in the literature for the elasticity of the porcine cornea (from less than 1 kPa to greater than 1 MPa with varying conditions and measurement techniques [29–32]).
Fig. 4.

Elasticity of porcine cornea ex vivo at different IOPs as measured by OCE and quantified by Eq. (2).
True kilohertz frame-rate shear wave OCE has been demonstrated previously by 2D full-field OCT using four-step phase shifting [33]. However, depth-resolved elasticity assessment required shifting the sample to obtain successive en-face images. The method presented here can provide depth-resolved elasticity information (using, e.g., spectral analysis [16]), but the similar frame-rate is achieved using fewer pixels.
In summary, we have demonstrated a noncontact true kilohertz frame-rate phase-sensitive OCE technique, which was capable of assessing the elasticity of agar phantoms and a porcine cornea ex vivo at various IOPs. Previous techniques have relied on multiple M-mode scans requiring an excitation for each measurement position. Here, only one stimulation was required for a single depth-resolved line measurement. However, the sensitivity and maximum detectable elastic wave velocity are limited due to the relatively small number of pixels available in time and space for velocity calculations as there is an intrinsic trade-off between transverse resolution and frame-rate because a greater number of lateral pixels would result in a lower frame-rate. Nevertheless, this method was successfully able to quantify elastic properties of samples at an ultra-high frame rate. In addition, the time to acquire a single OCE measurement, process the data, and provide an elasticity estimate was under 5 min, with an acquisition time of ~30 ms.
Due to the single excitation and rapid acquisition and processing speed, this technique may potentially be useful for clinical applications where patient discomfort is a critical factor. In addition, the 30-ms exposures with a beam power of ≤ 160 mW taken at 1 Hz did not exceed the ANSI Z136.1 MPE limit for the cornea. Future work will involve implementing algorithms for the forward and backward scans that would effectively double the frame rate and incorporating phase-velocity computation to enable more robust methods of viscoelasticity assessment [22]. Combined with GPU accelerated OCE [34], multiple B-scans would allow reconstruction of 3D elasticity maps in real time. It has been demonstrated that 3D compressional OCE can acquire volumetric elasticity data in a few seconds using significantly less data [35]. Application of the method presented in this study would potentially reduce the acquisition time from seconds to milliseconds and allow quantitative representation of elasticity.
Acknowledgments
This work was supported in parts by grants 1R01EY022362, 1R01HL120140, and U54HG006348 from NIH.
Footnotes
OCIS codes: (170.4500) Optical coherence tomography; (170.4470) Ophthalmology; (170.6935) Tissue characterization; (170.7160) Ultrafast technology.
References
- 1.Lyshchik A, Higashi T, Asato R, Tanaka S, Ito J, Mai JJ, Pellot-Barakat C, Insana MF, Brill AB, Saga T. Radiology. 2005;237:202. doi: 10.1148/radiol.2363041248. [DOI] [PubMed] [Google Scholar]
- 2.van Popele NM, Grobbee DE, Bots ML, Asmar R, Topouchian J, Reneman RS, Hoeks AP, van der Kuip DA, Hofman A, Witteman JC. Stroke. 2001;32:454. doi: 10.1161/01.str.32.2.454. [DOI] [PubMed] [Google Scholar]
- 3.Nash IS, Greene PR, Foster CS. Expt Eye Res. 1982;35:413. doi: 10.1016/0014-4835(82)90040-9. [DOI] [PubMed] [Google Scholar]
- 4.Muthupillai R, Lomas D, Rossman P, Greenleaf J, Manduca A, Ehman R. Science. 1995;269:1854. doi: 10.1126/science.7569924. [DOI] [PubMed] [Google Scholar]
- 5.Ophir J, Cespedes I, Ponnekanti H, Yazdi Y, Li X. Ultrason Im. 1991;13:111. doi: 10.1177/016173469101300201. [DOI] [PubMed] [Google Scholar]
- 6.Huang D, Swanson EA, Lin CP, Schuman JS, Stinson WG, Chang W, Hee MR, Flotte T, Gregory K, Puliafito CA, Fujimoto JG. Science. 1991;254:1178. doi: 10.1126/science.1957169. [DOI] [PMC free article] [PubMed] [Google Scholar]
- 7.Huber R, Wojtkowski M, Fujimoto JG. Opt Express. 2006;14:3225. doi: 10.1364/oe.14.003225. [DOI] [PubMed] [Google Scholar]
- 8.Zhang K, Kang JU. Opt Express. 2010;18:11772. doi: 10.1364/OE.18.011772. [DOI] [PMC free article] [PubMed] [Google Scholar]
- 9.Hee MR, Puliafito CA, Wong C, Duker JS, Reichel E, Rutledge B, Schuman JS, Swanson EA, Fujimoto JG. Arch Ophthalmol. 1995;113:1019. doi: 10.1001/archopht.1995.01100080071031. [DOI] [PubMed] [Google Scholar]
- 10.Jang IK, Bouma BE, Kang DH, Park SJ, Park SW, Seung KB, Choi KB, Shishkov M, Schlendorf K, Pomerantsev E. J Am Coll Cardiol. 2002;39:604. doi: 10.1016/s0735-1097(01)01799-5. [DOI] [PubMed] [Google Scholar]
- 11.Schmitt J. Opt Express. 1998;3:199. doi: 10.1364/oe.3.000199. [DOI] [PubMed] [Google Scholar]
- 12.Wang S, Larin KV. J Biophotonics. 2015;8:279. doi: 10.1002/jbio.201400108. [DOI] [PMC free article] [PubMed] [Google Scholar]
- 13.Sticker M, Hitzenberger CK, Leitgeb R, Fercher AF. Opt Lett. 2001;26:518. doi: 10.1364/ol.26.000518. [DOI] [PubMed] [Google Scholar]
- 14.Kennedy KM, Kennedy BF, McLaughlin RA, Sampson DD. Opt Lett. 2012;37:2310. doi: 10.1364/OL.37.002310. [DOI] [PubMed] [Google Scholar]
- 15.Ko HJ, Tan W, Stack R, Boppart SA. Tissue Eng. 2006;12:63. doi: 10.1089/ten.2006.12.63. [DOI] [PubMed] [Google Scholar]
- 16.Wang S, Larin KV. Biomed Opt Express. 2014;5:3807. doi: 10.1364/BOE.5.003807. [DOI] [PMC free article] [PubMed] [Google Scholar]
- 17.Song S, Huang Z, Nguyen TM, Wong EY, Arnal B, O’Donnell M, Wang RK. J Biomed Opt. 2013;18:121509. doi: 10.1117/1.JBO.18.12.121509. [DOI] [PMC free article] [PubMed] [Google Scholar]
- 18.Wang S, Larin KV. Opt Lett. 2014;39:41. doi: 10.1364/OL.39.000041. [DOI] [PMC free article] [PubMed] [Google Scholar]
- 19.Wang S, Li JS, Manapuram RK, Menodiado FM, Ingram DR, Twa MD, Lazar AJ, Lev DC, Pollock RE, Larin KV. Opt Lett. 2012;37:5184. doi: 10.1364/OL.37.005184. [DOI] [PMC free article] [PubMed] [Google Scholar]
- 20.Wang S, Lopez AL, Morikawa Y, Tao G, Li J, Larina IV, Martin JF, Larin KV. Biomed Opt Express. 2014;5:1980. doi: 10.1364/BOE.5.001980. [DOI] [PMC free article] [PubMed] [Google Scholar]
- 21.Liu C, Skryabina MN, Li J, Singh M, Sobol EN, Larin KV. Quantum Electron. 2014;44:751. [Google Scholar]
- 22.Han Z, Aglyamov SR, Li J, Singh M, Wang S, Vantipalli S, Wu C, Liu CH, Twa MD, Larin KV. J Biomed Opt. 2015;20:20501. doi: 10.1117/1.JBO.20.2.020501. [DOI] [PMC free article] [PubMed] [Google Scholar]
- 23.Wang S, Larin K, Li J, Vantipalli S, Manapuram R, Aglyamov S, Emelianov S, Twa M. Laser Phys Lett. 2013;10:075605. doi: 10.1088/1612-2011/10/7/075605. [DOI] [PMC free article] [PubMed] [Google Scholar]
- 24.Song S, Huang Z, Wang RK. J Biomed Opt. 2013;18:121505. doi: 10.1117/1.JBO.18.12.121505. [DOI] [PubMed] [Google Scholar]
- 25.Wang RK, Kirkpatrick S, Hinds M. Appl Phys Lett. 2007;90:164105. [Google Scholar]
- 26.Han Z, Li J, Singh M, Wu C, Liu CH, Wang S, Idugboe R, Raghunathan R, Sudheendran N, Aglyamov SR, Twa MD, Larin KV. Phys Med Biol. 2015;60:3531. doi: 10.1088/0031-9155/60/9/3531. [DOI] [PMC free article] [PubMed] [Google Scholar]
- 27.Nguyen TM, Aubry JF, Fink M, Bercoff J, Tanter M. Invest Ophthalmol Visual Sci. 2014;55:7545. doi: 10.1167/iovs.14-15127. [DOI] [PubMed] [Google Scholar]
- 28.Li J, Han Z, Singh M, Twa MD, Larin KV. J Biomed Opt. 2014;19:110502. doi: 10.1117/1.JBO.19.11.110502. [DOI] [PMC free article] [PubMed] [Google Scholar]
- 29.Kling S, Remon L, Perez-Escudero A, Merayo-Lloves J, Marcos S. Invest Ophthalmol Visual Sci. 2010;51:3961. doi: 10.1167/iovs.09-4536. [DOI] [PubMed] [Google Scholar]
- 30.Elsheikh A, Alhasso D, Rama P. Expt Eye Res. 2008;86:783. doi: 10.1016/j.exer.2008.02.006. [DOI] [PubMed] [Google Scholar]
- 31.Mikula E, Hollman K, Chai D, Jester JV, Juhasz T. Ultrasound Med Biol. 2014;40:1671. doi: 10.1016/j.ultrasmedbio.2013.11.009. [DOI] [PMC free article] [PubMed] [Google Scholar]
- 32.Wollensak G, Spoerl E, Seiler T. J Cataract Refract Surg. 2003;29:1780. doi: 10.1016/s0886-3350(03)00407-3. [DOI] [PubMed] [Google Scholar]
- 33.Nahas A, Tanter M, Nguyen TM, Chassot JM, Fink M, Claude Boccara A. J Biomed Opt. 2013;18:121514. doi: 10.1117/1.JBO.18.12.121514. [DOI] [PubMed] [Google Scholar]
- 34.Kirk R, Kennedy B, Sampson D, McLaughlin R. J Lightwave Technol. 2015;PP:1. [Google Scholar]
- 35.Kennedy BF, Malheiro FG, Chin L, Sampson DD. J Biomed Opt. 2014;19:076006. doi: 10.1117/1.JBO.19.7.076006. [DOI] [PubMed] [Google Scholar]


