

Abstract
Congenital macrothrombocytopenia is a family of rare diseases, of which a significant fraction remains to be genetically characterized. To analyze cases of unexplained thrombocytopenia, 27 individuals from a patient cohort of the Bleeding and Thrombosis Exploration Center of the University Hospital of Marseille were recruited for a high-throughput gene sequencing study. This strategy led to the identification of two novel FLI1 variants (c.1010G>A and c.1033A>G) responsible for macrothrombocytopenia. The FLI1 variant carriers’ platelets exhibited a defect in aggregation induced by low-dose adenosine diphosphate (ADP), collagen and thrombin receptor-activating peptide (TRAP), a defect in adenosine triphosphate (ATP) secretion, a reduced mepacrine uptake and release and a reduced CD63 expression upon TRAP stimulation. Precise ultrastructural analysis of platelet content was performed using transmission electron microscopy and focused ion beam scanning electron microscopy. Remarkably, dense granules were nearly absent in the carriers’ platelets, presumably due to a biogenesis defect. Additionally, 25–29% of the platelets displayed giant α-granules, while a smaller proportion displayed vacuoles (7–9%) and autophagosome-like structures (0–3%). In vitro study of megakaryocytes derived from circulating CD34+ cells of the carriers revealed a maturation defect and reduced proplatelet formation potential. The study of the FLI1 variants revealed a significant reduction in protein nuclear accumulation and transcriptional activity properties. Intraplatelet flow cytometry efficiently detected the biomarker MYH10 in FLI1 variant carriers. Overall, this study provides new insights into the phenotype, pathophysiology and diagnosis of FLI1 variant-associated thrombocytopenia.
Introduction
Congenital reduced platelet count or impaired platelet function lead to a family of diseases, which are increasingly recognized as a significant cause of bleeding in children and adults.1 Congenital macrothrombocytopenias (CMTPs) constitute a large subgroup of inherited thrombocytopenia characterized by enlarged platelets. Several genetic variants have been associated with CMTP, of which the most frequent alter genes that encode platelet surface proteins and megakaryocyte (MK) cytoskeletal proteins.2
However, mounting evidence has shown that several forms of CMTP are caused by variants in genes encoding hematopoietic transcription factors, which lead to altered downstream expression of genes that regulate platelet formation and function.3–10 In 2013, Stockley et al. used next-generation sequencing (NGS) to analyze 13 unrelated patients suspected of having an inherited qualitative platelet defect in the UK Genotyping and Phenotyping of Platelets (UK-GAPP) study.7 The group reported two substitutions and a 4-bp frameshift deletion in the transcription factor gene FLI1. Two of the index cases also had mild thrombocytopenia, and one of them exhibited enlarged platelets. These findings highlight the role of FLI1 in megakaryopoiesis and platelet function.
To analyze cases of unexplained thrombocytopenia, 27 individuals from the patient cohort of the Bleeding and Thrombosis Exploration Center of the University Hospital of Marseille were recruited for a high-throughput gene sequencing investigation. In the study herein, we report the discovery of two novel FLI1 dominant variants linked to CMTP in two unrelated pedigrees. We investigated the pathogenesis of FLI1-associated thrombocytopenia by analyzing subcellular FLI1 localization and MK differentiation from hematopoietic progenitors derived from patients. We characterized the genotype-phenotype relationship and described the intraplatelet flow cytometry-based quantification of MYH10, a biomarker of FLI1 and RUNX1 alterations. Focused ion beam scanning electron microscopy (FIB-SEM) is an imaging approach based on the serial sectioning of entire platelets, which allows a 3D representation of the granules with respect to their shape, content and number. Using this method, we showed a severe dense granule deficiency in platelets of the FLI1 variant carriers.
Methods
Methods concerning high-throughput gene sequencing, structural model of FLI1-DNA interactions, platelet phenotyping, platelet-rich plasma (PRP) serotonin level, ATP secretion, mepacrine uptake and release, flow cytometric quantification of MYH10 expression (whole blood-based assay), western blot assay, site-directed mutagenesis, luciferase reporter assay, epifluorescence microscopy and in vitro MK differentiation and proplatelet formation are described in the Online Supplementary Material.
Recruitment of patients and genetic analysis strategy
Patients were recruited from the cohort of the Bleeding and Thrombosis Exploration Center (University Hospital of Marseille) after informed written consent was obtained, in accordance with protocols approved by the local Institutional Review Board and the Declaration of Helsinki. Two high-throughput sequencing methods were used to identify candidate variants: (A) Whole-exome sequencing performed at the Centre National de Génotypage (Evry, France), or (B) sequencing of a 308 gene panel (selected genes associated with platelet diseases; available on request).
Flow-cytometric quantification of MYH10 expression (PRP-based assay)
PRP was fixed in 1% paraformaldehyde phosphate buffered saline (PBS). Next, the fixed PRP was centrifuged at 1000 G for five min. The platelet pellet was suspended in permeabilization buffer (0.5% Triton X-100, 2mM Ethylenediaminetetraacetic acid, 0.5% bovine serum albumin (BSA) PBS) and labeled with rabbit anti-MYH10 antibody (Cell Signaling; #3404) for one hour. After a washing step, the platelets were incubated with goat anti-rabbit Alexa-488-labeled secondary antibody (Abcam; ab150077) for 30 min in permeabilization buffer. After another washing step, the data were acquired using Navios Cytometer (Beckman Coulter) and analyzed with FlowJo software (Tree Star, Inc.).
Electron microscopy
For ultrastructural analysis, platelets in citrated PRP were diluted and fixed in PBS pH 7.2 containing 1.25% glutaraldehyde for one hour. After centrifugation and two PBS washings, they were post-fixed in 150 mM cacodylate-hydrochloric acid (HCl) buffer containing 1% osmium tetroxide pH 7.4 for 30 min at 4°C. After dehydration in a graded alcohol, embedding in EPON was performed by polymerization at 60°C for 72 hours. Ultrathin sections (~70 nm thick) were mounted on 200 mesh copper grids, contrasted with uranyl acetate and lead citrate and examined using a JEOL JEM1400 transmission electron microscope equipped with a Gatan Orius 600 camera and Digital Micrograph software (Lyon Bio Image, Centre d’Imagerie Quantitative de Lyon Est, France). Morphometric measurements were done using ImageJ software (National Institutes of Health, USA). Preparations of platelet whole mounts were obtained after brief contact of formvar coated grids on small drops of PRP. Then, grids were rinsed rapidly with distilled water, dried with the edge of a filter paper, waved in the air and examined under the transmission electron microscope. Dense granules were identified and counted as previously described.11 FIB-SEM samples were processed as for transmission electron microscopy (TEM), and examined using a Helios NanoLab microscope (FEI). The 3D models were computed using Amira software.
Statistical analyses
Statistical significance was determined via a 2-tailed Mann-Whitney test unless otherwise specified. P<0.05 was considered statistically significant. Quantitative variables were presented as mean ± standard error of the mean. Analyses were performed using GraphPad Prism software.
Results
Identification of two novel FLI1 variants
Two high-throughput sequencing methods were used to identify candidate variants in 27 patients with suspected congenital thrombocytopenia. DNA samples from 12 individuals (three members of four unrelated families) with unexplained autosomal dominant macrothrombocytopenia were analyzed via whole-exome sequencing. In one family (Family F1), this analysis revealed a heterozygous single nucleotide change in FLI1. This missense variant, c.1010G>A, encodes an arginine to glutamine change (p.R337Q) in the highly conserved E twenty-six (ETS) DNA-binding domain of FLI1 (Figure 1A,B). The presence of the variant was confirmed using capillary sequencing. There was a segregation between the FLI1 variant and a history of thrombocytopenia in all cases for which DNA samples were available. In the three other families, no candidate variant was detected. Next, 15 additional individuals from 14 unrelated families were screened using a 308 gene panel NGS strategy. This screening led to the genetic diagnosis of four patients with macrothrombocytopenia. Aside from the identification of MYH9, ACTN1 and GP1BA variants in three unrelated individuals, one patient carried c.1033A>G heterozygous FLI1 variant, yielding p.K345E substitution (Family F2). In this family, the clinical and genetic status of the proband’s father (F2-I1) was unknown and the proband’s mother (F2-I2) displayed a normal platelet count, but the FLI1 gene was not sequenced. This second FLI1 variant also affected the ETS domain (Figure 1A,B). Sequence alignment of FLI1 orthologs and paralogs demonstrated that both variants affected amino acid residues in a highly conserved sequence (Figure 1C).
Figure 1.
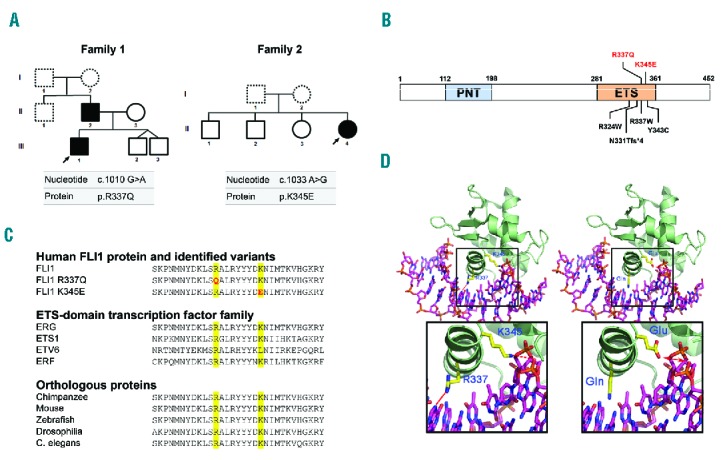
Identification of two novel FLI1 variants. (A) Pedigrees for the affected families. Squares denote males and circles denote females. Black filled symbols represent family members carrying heterozygous c.1010 G>A and c.1033 A>G FLI1 variants. Dotted line symbols represent non-tested members. Arrows indicate the probands. (B) Schematic diagram of the FLI1 protein. The functional N-terminal Pointed domain (PNT), and C-terminal ETS DNA-binding domain (ETS) are depicted. The positions of the alterations in FLI1 are indicated in red (alterations reported in this study) or black (previously reported alterations).7,8 (C) Sequence alignment of the FLI1 protein (variant NM_002017.3). The variants reported in this study are indicated in red (top). Alignments of various members of the ETS-domain transcription factor family (middle) and different species (bottom) are provided. (D) Diagram of the simulated interactions between FLI1 and double-stranded DNA (dsDNA). Left: Interaction of native FLI1 with dsDNA. The FLI1 dsDNA-interacting domain is represented as a green ribbon. The dsDNA is represented as a stick model (carbons: pink; nitrogen: blue; oxygen: red; phosphate: orange). The interactions of R337 with Guanine 5 atoms N7 and O6 as well as K345 with Adenine 15 atom OP2 (side chain carbons: yellow; nitrogen: blue; oxygen: red) are indicated in red. Right: model of FLI1 structure with mutated residues p.R337Q and p.K345E. An expanded view of the interaction between altered residues and DNA is shown at the bottom.
As these variants were located in the ETS domain, a simulation of the protein-DNA interactions was performed. Regarding the p.R337Q variant, glutamine 337 retained the ability to interact with DNA; however, the putative hydrogen (H)-bonds should be weaker than those established with the positively charged arginine guanidinium moiety. In the p.K345E variant, glutamic acid 345 is negatively charged and likely has a repelling effect on DNA binding (Figure 1D).
Description of the families
The affected members of the first family (F1-II2 and F1-III1) were both males, aged 46 and 19, respectively. They had not experienced significant bleeding (International Society on Thrombosis and Haemostasis Bleeding Assessment Tool (ISTH BAT) score: 1 for both), whereas the female proband in the second family (F2-II4), who was 52 years of age, had displayed excessive bleeding (ISTH BAT score: 16) with predominantly gynecological, obstetrical and oral cavity hemorrhaging. The three affected members did not display any extra hematologic abnormality. The first-line laboratory tests are reported in Table 1. All affected members presented with mild thrombocytopenia (mean value: 142 ± 7 × 10⁹/l). The mean platelet volume (MPV) was elevated (11.6 ± 1.2 fl; reference range 7.1 – 9.6 fl). In these families, coagulation, fibrinolysis and von Willebrand factor levels were normal (data not shown).
Table 1.
Platelet phenotyping in patients carrying the FLI1 variants.
Platelet receptor expression and platelet function evaluation
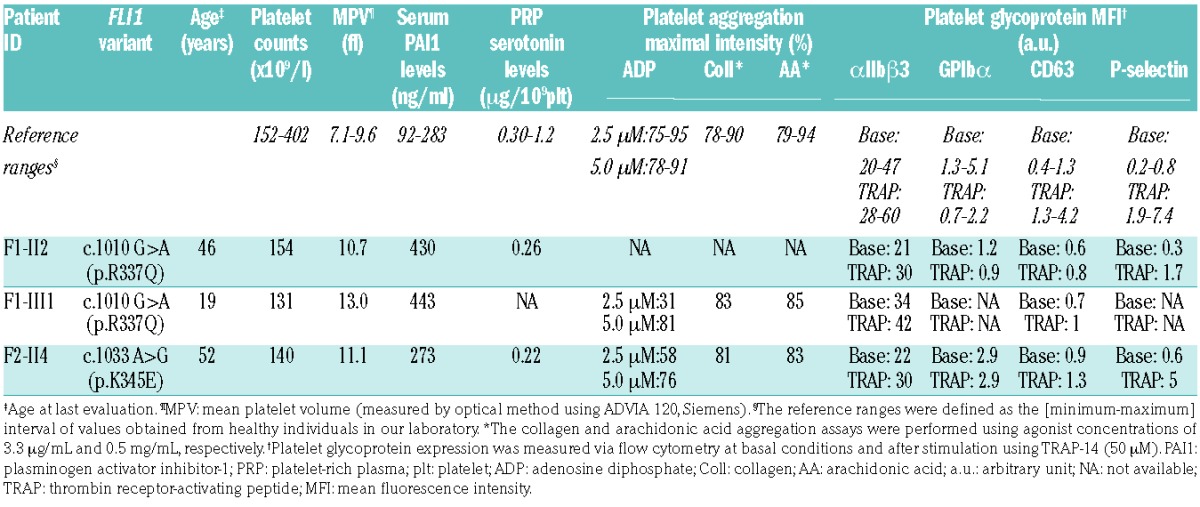
The CD63 expression did not increase significantly upon TRAP stimulation (Table 1). The basal expression of αIIbβ3 was in the normal range among FLI1 variant carriers (Table 1). The platelet light transmission aggregometry (Figure 2A and Table 1) revealed a significant aggregation defect upon stimulation with different agonists, when used at a low concentration (2 and 2.5 μM ADP, 2 μg/ml collagen, 10 μM TRAP-6). The use of higher concentrations of agonists (5 μM ADP, 10 μg/ml collagen, 50 μM TRAP-6) induced normal platelet aggregation. The ATP secretion upon TRAP-6 stimulation was 2.5-fold decreased in patients F1-II2 and F1-III1 as compared to controls (Figure 2B). The mepacrine uptake and release upon TRAP-14 stimulation was reduced (Figure 2C). Among FLI1 variant carriers, the platelet serotonin level was low but the serum plasminogen activator inhibitor-1 (PAI-1) antigen level (an α-granule biomarker) was normal or high (Table 1).
Figure 2.
Platelet function analysis. (A) Light transmission aggregometry upon ADP (2 μM), collagen (2 and 10 μg/ml) and TRAP-6 (10 and 50 μM) stimulation in a FLI1 variant carrier (F1-III1) and in a control who was representative of 20 controls investigated at the same period of time. The PRP platelet count was 268 ×109/l for the patient and 331 ×109/l for the control. (B) Luminometry-based ATP secretion assay. ATP secretion was measured in two FLI1 variant carriers (F1-II2 and F1-III1) and unrelated controls after 100 μM TRAP-6 stimulation in 100 μl of diluted PRP (107 platelet/ml). *P<0.05 vs. controls (Mann-Whitney test). (C) Flow cytometric mepacrine uptake and release assay in two FLI1 variant carriers (F1-II2 and F2-II4) and unrelated controls. The platelets were incubated with 1.1 or 2.4 μM mepacrine and stimulated with 40 μM TRAP-14 to evaluate the mepacrine release. The mepacrine uptake was defined as the MFI ratio of platelets incubated with mepacrine to platelets incubated without mepacrine, and the mepacrine release was defined as the MFI ratio of resting platelets to stimulated platelets. ADP: adenosine diphosphate; ATP: adenosine triphosphate; TRAP: thrombin receptor-activating peptide; Coll: collagen; MFI: mean fluorescence intensity.
Increased MYH10 expression in the platelets of affected members
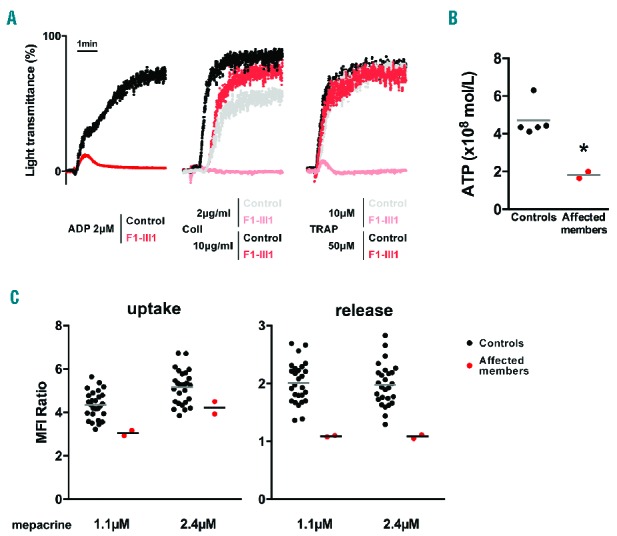
The expression of MYH10 in platelets has been recently proposed as a biomarker for RUNX1 and FLI1 alterations.7,8,12 Intraplatelet flow-cytometry showed an almost 4-fold overexpression of MYH10 among the FLI1 variant carriers as compared to controls, using a PRP-based and a whole blood-based experimental procedure (Figure 3A and Online Supplementary Figure S1, respectively). The MYH10 mean fluorescence intensity (MFI) was expressed as a function of MPV in 13 control individuals (MPV range 7.2 – 11.4 fl) and two FLI1 patients (MPV 10.7 and 13 fl), demonstrating that the increased MPV could not explain the specific increase in MYH10 MFI observed in the FLI1 patients (Online Supplementary Figure S1). Western blot analysis confirmed the increased expression of MYH10 in the platelet lysates of the FLI1 variant carriers (Figure 3B).
Figure 3.
Quantification of platelet MYH10 expression. (A) Flow cytometry-based quantitative detection of intraplatelet MYH10 expression (PRP-based assay). Left: representative overlay of histograms of intraplatelet MYH10 expression in an affected member (F1-II2) and a healthy control. The non-specific staining (irrelevant IgG) is only presented for the affected member, which can be superimposed for that of the control. Right: MYH10 mean fluorescence intensity (MYH10 MFI – irrelevant IgG MFI) in affected members (n=3) or unrelated controls (n=8) from three independent experiments. The results are expressed as fold change relative to corresponding controls; **P<0.01 vs. controls (Mann-Whitney test). (B) Left: representative western blot analysis of MYH10 expression in platelets from the affected members (F1-II2, F1-III1, F2-II4), one unaffected member (F1-II3) and two unrelated controls. GAPDH and actin were used as a protein loading control. Right: the results of densitometric analysis were normalized to actin and expressed as mean ± SEM; **P<0.01 vs. controls (Mann-Whitney test). Three independent experiments were performed. GAPDH: glyceraldehyde 3-phosphate dehydrogenase; IgG: immunoglobulin G; a.u.: arbitrary units.
Functional assessment of the FLI1 variants
Western blot analysis did not reveal an alteration in FLI1 protein expression in the platelets of affected members compared with healthy controls (Figure 4A). Accordingly, protein expression of wild-type (WT) and both FLI1 variants in transfected cells were equivalent, thereby suggesting that these variants do not influence protein expression or stability (Figure 4B). To investigate the effect of the p.R337Q and p.K345E variants on FLI1 transcriptional activity, we investigated the ability of the recombinant FLI1 variants to regulate transcriptional activity using a dual-luciferase reporter assay. Co-transfection of the reporter plasmid containing the ETS-binding site and a plasmid encoding WT FLI1 resulted in almost 70% inhibition of luciferase activity. There was a loss in the ability of the p.R337Q and p.K345E variants to repress luciferase activity compared with that of WT FLI1 (P<0.0001, Figure 4C). Reduced transcriptional activity was also observed in this model for the FLI1 p.R324Q variant previously reported by Stevenson et al.8 The co-transfection of WT and variant FLI1 led to normal transcriptional activity (Figure 4C).
Figure 4.
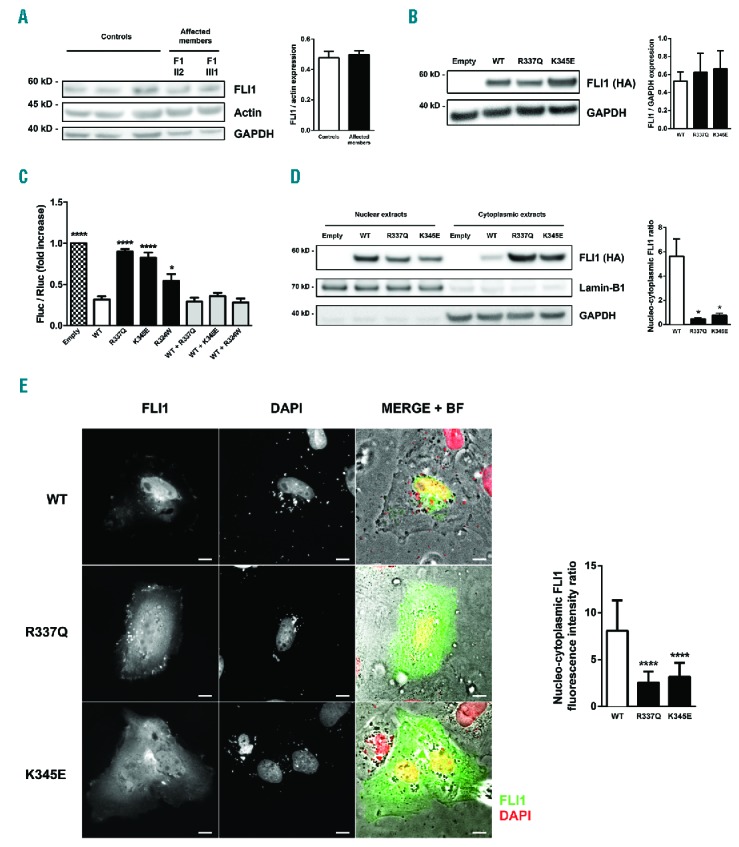
Functional characterization of the FLI1 variants. (A) Left: representative western blot analysis of FLI1 expression in platelets from the affected members (F1-II2, F1-III1) and three control individuals. GAPDH and actin were used as a protein loading control. Right: the results of the densitometric analysis were normalized to actin and expressed as mean ± SEM from three independent experiments. (B) Left: representative western blot analysis of FLI1 expression in GripTite 293 MSR cells transfected with an empty vector, wild-type (WT) or variant FLI1 constructs using an anti-HA antibody. GAPDH was used as a protein loading control. Right: the results of the densitometric analysis are expressed as mean ± SEM. Three independent experiments were performed. (C) GripTite 293 MSR cells were co-transfected with an empty vector, WT or variant FLI1 constructs including the c.970C.T FLI1 variant previously reported by Stevenson et al.8 (p.R324W) along with the luciferase reporter plasmid containing three tandem copies of the ETS-binding site upstream of the HSV tk promoter (E743tk80Luc) and pGL4.73 Renilla luciferase control vector. Firefly to renilla luminescence ratios (Fluc/Rluc) were calculated to compensate for transfection efficiency and expressed as fold change relative to empty vector. The data represent the mean ± SEM of three independent experiments; *P<0.05, ****P<0.0001 vs. WT (one-way ANOVA with Dunnett’s post hoc test). (D) Western blot analysis of WT and variant FLI1 subcellular localization. GripTite 293 MSR cells were transfected with an empty vector, WT or variant FLI1 constructs. The lamin-B1 and GAPDH expression were used as nuclear and cytoplasmic markers, respectively. The data are the mean ± SEM of four independent experiments; *P<0.05 vs. WT (Mann-Whitney test). (E) Left: representative immunofluorescence microscopy images of H9C2 cells transfected with WT or variant FLI1 constructs visualized using bright field illumination and immunofluorescence after FLI1 and DAPI staining; scale bar, 5 μm. Right: quantification of the nuclear and cytoplasmic integrated density of fluorescence. The data are expressed as mean ± SEM of the nucleo-cytoplasmic ratio of fluorescence integrated density from two independent experiments (≥ 30 total cells were assessed for each condition); ****P<0.0001 vs. WT (Mann-Whitney test). GAPDH: glyceraldehyde 3-phosphate dehydrogenase; HA: hemagglutinin; BF: bright field.
The R337 and K345 residues were predicted to be part of a nuclear localization signal sequence using several prediction tools (cNLS mapper and NLStradamus; data not shown). To examine whether the p.R337Q and p.K345E variants alter the subcellular localization of FLI1 protein, we performed cell fractionation assay and immunofluorescence staining of cells overexpressing WT or variant FLI1. Western blot analysis of subcellular fractions showed increased FLI1 protein level in the cytoplasmic fraction and decreased protein level in the nuclear fraction in cells expressing the p.R337Q and p.K345E FLI1 variants compared with cells expressing the WT protein (Figure 4D). Concordant with the western blot data, fluorescence microscopy showed that WT FLI1 concentrated primarily in cell nuclei. In contrast, both FLI1 variants exhibited predominant cytoplasmic localization (Figure 4E).
FLI1 variants are associated with reduced CD34+-derived megakaryocyte differentiation and proplatelet formation in vitro
We generated MKs from peripheral blood CD34+ cells in the presence of thrombopoietin (TPO) and stem cell factor (SCF) in liquid culture. At day 11, the percentage of mature CD41hiCD42ahi MKs was strikingly reduced, while the percentage of CD41lowCD42− and CD41−CD42− cells was increased in F1-II2 compared with the control (Figure 5A). The percentage of high-ploidy cells (≥8n) was reduced among FLI1 variant carriers at day 12 (11.9, 8.2 and 5.8% for the control, the F1-II2 and the F1-III1 affected members, respectively) and day 14 of maturation (11.3, 6.2 and 4.5% for the control, the F1-II2 and the F1-III1 affected members, respectively) (Figure 5B). At days 12–13, the percentage of proplatelet (PPT)-forming MKs was significantly reduced in the affected members F1-II2 and F2-II4 compared with three controls (16 ± 1% vs. 3 ± 1%, P<0.05, Figure 5C). MKs from patients were smaller and formed very few PPTs, which displayed reduced extensions and branching (Figure 5C).
Figure 5.
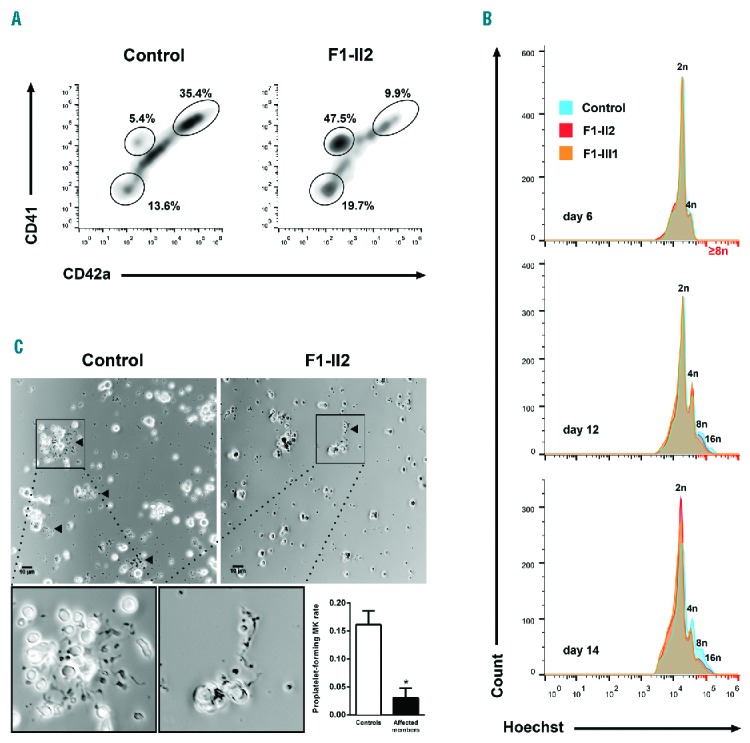
Megakaryocyte differentiation and proplatelet formation. Circulating CD34+ progenitors from affected members or controls were isolated and cultured in the presence of TPO and SCF to induce megakaryocytic commitment. (A) MK differentiation was monitored using flow cytometry. The density plots represent CD41 and CD42a expression in Hoechst+ cells from an affected member (F1-II2) and an unrelated control at day 11 of culture. The ellipse gates show the populations CD41−CD42a−, CD41lowCD42a− cells and mature CD41hiCD42ahi MKs. (B) Ploidy level was monitored by flow cytometry. The histograms represent frequency distribution of Hoechst levels among the CD34+-derived cells from two affected members (F1-II2 and F1-III1) and an unrelated control at day 6, 12 and 14 of culture. (C) Representative microscopic images of proplatelet (PPT) formation after 13 days of culture. An expanded view of PPT formation is shown at the bottom. PPT formation was quantified in two affected members (F1-II2 and F2-II4) and three unrelated controls at culture days 12 and 13 from three independent experiments. The PPT-forming MK are indicated with triangle markers; scale bar, 10 μm. The percentage of PPT-forming MKs was estimated by counting MKs harboring ≥ 1 cytoplasmic process with areas of constriction; ≥ 180 total cells were assessed for each individual. The results are expressed as mean ± SEM; *P<0.05 (Mann-Whitney test). MK: megakaryocyte.
Platelets from affected members exhibit giant α-granules and an absence of dense granules
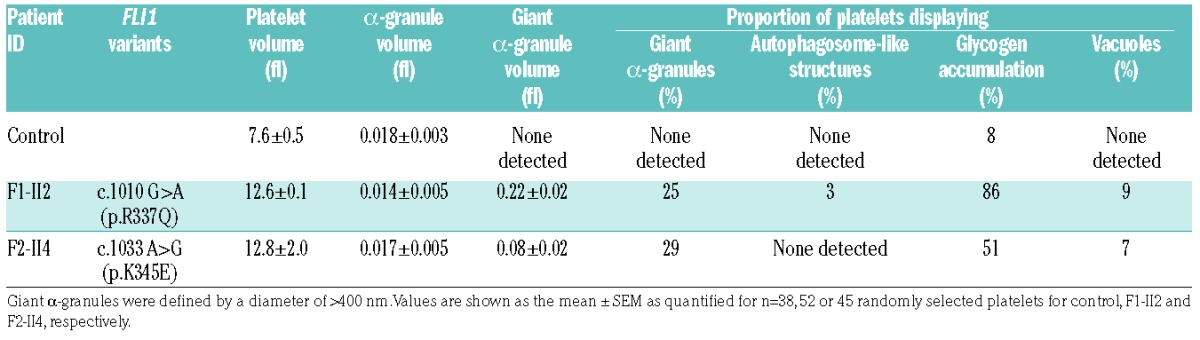
May-Grünwald-Giemsa staining of peripheral blood smears of patient F1-II2 revealed enlarged platelets with giant α-granules (Figure 6A). Accordingly, TEM analysis showed the presence of large fused α-granules in the carriers’ platelets (Figure 6B). The mean diameter of the α-granules was significantly increased (Figure 6C). The mean α-granule number per μm2 of platelet section was slightly reduced in the FLI1 p.R337Q variant carrier but not in the p.K345E variant carrier. We quantified the platelet surface on sections (Figure 6C), which confirmed the increased platelet size associated with FLI1 variants (Table 1). Whole mount electron microscopy, FIB-SEM and TEM was used to quantify the dense granules, which were nearly absent in carriers’ platelets (Figure 6B,C and Online Supplementary Figure S2), thereby indicating a dense granule storage pool deficiency. Precise platelet content analysis and 3D reconstruction of the α- and dense granules within platelets was performed using the FIB-SEM technique. Among affected members, the proportion of platelets displaying giant α-granules (diameter > 400nm) was 25–29% (Table 2). The giant α-granules had a mean volume of almost 8-fold that of normal α-granules. While dense granules were easily distinguished through their typical dark central core and spherical geometry in control platelets (8.6 ± 0.7 dense granules per platelet; n=12), they were almost absent within platelets of FLI1 variant carriers (1.1 ± 0.3, 1.1 ± 0.2 dense granules per platelet for F1-II2 and F2-II4 affected members, respectively; n=12) (Figure 6C). Empty dense granule membrane structures were rarely detected (3 ± 0.5, 1 ± 0.3 and 0.5 ± 0.2 copies for F1-II2, F2-II4 and control platelets, respectively; n=12; Figure 6C). Double membrane structures resembling autophagosomes were detected in 3% of the platelets from the affected member F1-II2 (Table 2; Figure 6D, left panel), while these were absent in the affected member F2-II4. Accumulation of glycogen was found in the cytoplasm of many platelets from the affected members (86% and 51% in F1-II2 and F2-II4 platelets, respectively; Table 2 and Figure 6D, middle right panel) and vacuoles containing glycogen were also observed in 9% and 7% of F1-II2 and F2-II4 platelets, respectively (Table 2 and Figure 6D, far right panel). FIB-SEM image stacks in F1-II2 and a control allowed the 3D observation of the platelet morphological defects associated with FLI1 variants (Online Supplementary Videos S1 and S2).
Figure 6.
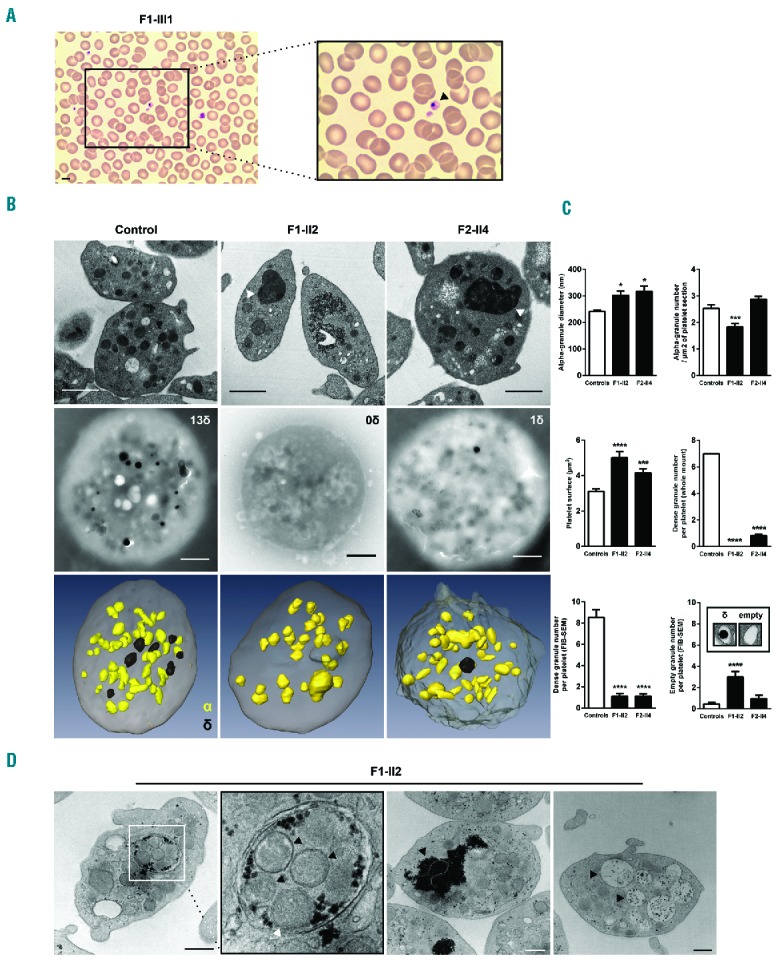
Platelet structure defects associated with FLI1 variants. (A) Representative May-Grünwald-Giemsa stained blood smears showing enlarged platelets with giant α-granules (patient F1-III3). Scale bar, 5 μm. (B) Platelet ultrastructural analysis from FLI1 variant carriers (F1-II2 and F2-II4) and an unrelated control. Representative electron microscopy images of platelets transmission electron microscopy (TEM) ultrathin sections (top) and whole mount (middle). 3D reconstruction of platelet α- and dense granules from focused ion beam scanning electron microscopy (FIB-SEM) images (bottom); Giant α-granules are indicated with triangle markers; δ: dense granule, α: alpha-granule; Scale bar, 1 μm. (C) Measurement of the α-granules diameter and number/μm2 of platelet section, platelet surface, number of dense granules and number of empty granules. Values are shown as the mean ± SEM as quantified for ≥100 randomly selected platelets for TEM and whole mount and 12 randomly selected platelets for FIB-SEM; *P<0.05, ***P<0.001, ****P<0.0001 vs. controls (Mann-Whitney test). (D) Representative ultrastructural image of double membrane structures resembling autophagosome (far left panel with enlarged view middle left panel; black triangle marker: α-granule; white triangle marker: mitochondrion), area of glycogen accumulation (middle right panel; black triangle marker: glycogen), and vacuoles (far right panel; black triangle marker: vacuole) in the platelet of the affected member F1-II2.
Table 2.
FIB-SEM analysis of platelet ultrastructure.
Discussion
In the present study, we identified two novel FLI1 variants in patients from two unrelated families displaying CMTP with marked bleeding diathesis in one of them. The reported FLI1 variants were associated with impaired megakaryocytic differentiation and PPT formation in vitro and with a defect in the protein subcellular localization, thereby providing further insights into the pathophysiology of FLI1-associated thrombocytopenia. Remarkably, we demonstrated that dense granules were nearly absent in the carriers’ platelets. In addition, we showed that intraplatelet flow cytometry efficiently detected the biomarker MYH10 in FLI1 variant carriers.
FLI1 belongs to the ETS-domain transcription factor family, in which members bind a specific DNA consensus sequence to control the expression of genes that are essential in the regulation of cellular proliferation, differentiation and programmed cell death.13 FLI1 is mainly expressed in hematopoietic and vascular endothelial cells and plays a role in the regulation of essential MK genes.7,8,14–23 In humans, a role for FLI1 in megakaryopoiesis was highlighted by studies of Paris-Trousseau syndrome (PTS)24–26 in which the FLI1 locus is hemizygously deleted, and more recently by two articles reporting FLI1 variants associated with congenital thrombocytopenia.7,8
The affected members carried heterozygous variants, with a dominant mode of inheritance in the F1 family. The thrombocytopenia associated with the FLI1 variants reported by Stockley et al.7 and the PTS24,25 were also shown to be transmitted in a dominant manner. Inversely, Stevenson et al. have described a family displaying inherited thrombocytopenia caused by a recessive FLI1 variant.8 We hypothesize that the mode of inheritance could rely on the degree of the protein functional impairment, as suggested by the moderately reduced transcriptional activity of the p.R324W variant, associated with the recessive inheritance pattern. Intriguingly, in mouse models of a targeted null Fli1 variant, the mice carrying a heterozygous deletion of Fli1 are phenotypically indistinguishable from the WT mice. We hypothesize that these mouse models do not undergo silencing of one FLI1 allele during the early stages of megakaryopoiesis, contrary to that observed in humans.26
The bleeding phenotype of F2-II4 was much more severe than that of the affected members of the family F1 (ISTH BAT score 16 vs. 1). An additional bleeding disorder (affecting coagulation, von Willebrand factor or fibrinolysis) was ruled out. A combination of genetic, environmental and lifestyle factors may interfere in the genotype-phenotype relationship. This difference is not likely to be directly related to platelet count or patient age; however, this could be explained in part by the sex of the patient. Indeed, the individual with a high bleeding score (F2-II4) predominantly suffered from gynecological and obstetrical bleeding. This may reflect the limitation of the ISTH BAT score to evaluate the bleeding risk in males who have not been challenged enough as compared to females.
In PTS, the platelet count seems to be as low as 20 × 109/l early in life and subsequently increases to near or low normal levels.25,27 Similar to that shown in a previous report of FLI1 variant carriers,7 the older patient in the F1 family exhibited a higher platelet count than the younger one. The platelet counts and the increased MPV of the affected members were consistent with that observed in most PTS cases and FLI1 variant-associated thrombocytopenia patients.7,25 As noted in some PTS patients, the bleeding phenotype of patient F2-II4 was more severe than that expected with a mild thrombocytopenia, thereby suggesting associated abnormal platelet function.25,27 In the present study, the affected members exhibited an aggregation defect upon low dose ADP, collagen, and TRAP-6 stimulation, which is a hallmark of dense granule storage pool deficiency. Data concerning aggregation assays has varied widely in the literature. Breton-Gorius et al. have reported normal aggregation curves in PTS patients.24 Regarding FLI1 variant-associated thrombocytopenia, Stevenson et al. have reported reduced aggregation to collagen and ADP.8 Finally, in a murine model expressing a C-terminal truncated Fli1 protein, aggregation tests revealed reduced ADP- and thrombin-induced aggregation.28 These discrepancies could be in part due to differences regarding agonist concentrations or sources. Furthermore, storage pool diseases are known to be associated with variable aggregation profiles.29
In the study herein, NGS-based techniques led to the identification of the FLI1 variants. These strategies require careful interpretation as they lead to the identification of a high number of non-pathogenic variants. However, clinical phenotype and screening laboratory tests are not specific and often fail to yield a specific diagnosis. Identifying biomarkers could facilitate the diagnostic process of inherited platelet disorders. In this regard, platelet-specific expression of MYH10, whose silencing is required for the switch from mitosis to endomitosis during MK maturation,30 has been shown to constitute a biomarker for the inherited platelet disorders associated with FLI1 and RUNX1 alterations.7,8,12 Platelet MYH10 expression is usually detected via western blot. This assay is complex and time-consuming, and the results must be carefully interpreted as control platelets exhibit low expression of MYH10. In this study, we developed a quantitative assay to detect MYH10 overexpression in FLI1 variant carriers’ platelets using intracellular flow cytometry. This test enabled rapid and accurate discrimination between the affected members and controls using only a small volume of PRP or whole blood.
α- and dense granule defects were identified as the main platelet defect in the affected members. It is important to study the mechanisms of this functional impairment, as bleeding diathesis may still occur in FLI1-associated thrombocytopenia patients with subnormal or normal platelet counts.27 We report that up to 29% of the patients’ platelets displayed giant α-granules, which is a characteristic feature of PTS24,25 and have been previously reported in FLI1 variant-associated thrombocytopenia,8 albeit in a much smaller proportion of platelets (4–15%). This discrepancy can be attributed to differences in the analysis methods. Contrary to classic TEM, FIB-SEM enables evaluation of the whole granule content of a platelet. In the present study, normal or even increased serum PAI-1 levels suggest normal α-granule content and release.31 Taken together, these results indicate that the vesicle trafficking or the α-granule proteins packaging but not the storage mechanisms may be impaired. Regarding dense granules, we demonstrated for the first time using electron microscopy (notably FIB-SEM), ATP secretion, mepacrine uptake and release, CD63 expression upon stimulation and serotonin measurement, that dense granules were nearly absent in the carriers’ platelets and that empty dense granule membrane structures were rarely detected. This suggests that the platelet dense granule deficiency is due to an impaired biogenesis. A previous study on Jacobsen syndrome, a variant of PTS, has reported a dense granule storage pool deficiency in six patients32 using whole mount electron microscopy, which only allows the evaluation of the electron opaque dense granules content. More recently, Stockley et al. showed that the platelet of FLI1 variants carriers exhibited an ATP secretion defect7 but have not evaluated the dense granule content. Interestingly, in a recent study reporting ChIP-seq data in murine MK,33 FLI1 was shown to interact with HPS4 and RAB27B genes, which are known regulators of dense granules biogenesis.34,35 Autophagosome-like structures were noted in 3% of platelets from one affected member. Autophagy is known to be important in both megakary-opoiesis36 and platelet function.37 This observation thus suggests that autophagy may play a role in the pathophysiology of FLI1-associated thrombocytopenia. Glycogen accumulations were noted in the platelets of most of the affected members. The significance of this abnormal feature is unclear, although it may suggest that FLI1 plays a role in the regulation of platelet intracellular metabolic processes.
The p.R337Q and p.K345E variants are located within the ETS-domain, similar to the previously reported variants.7,8 The pathogenic effect of these novel FLI1 variants was confirmed by the significant reduction in transcriptional activity, as with all other FLI1 variants reported in the literature.7,8 Furthermore, we show that both p.R337Q and p.K345E variants displayed significantly altered cellular localization with a reduced nuclear accumulation. In a previous study based on directed mutagenesis, these residues were found to be important for the DNA-bound conformation of FLI1 and its nuclear accumulation.38 Additionally, the p.R337A variant abolished ETS DNA-binding activity.38 Overall, these results suggest that both nuclear accumulation and DNA-binding capacity could interfere with FLI1 regulation of MK-specific genes. Other mechanisms may also cause this impairment, such as abnormal recruitment of co-regulators or altered activation of histone deacetylases or acetylases.39
In vitro, we noted a marked diminution of mature CD41hiCD42ahi MKs, along with an increase in CD41lowCD42a− and CD41−CD42− cells among FLI1 variant carriers. Even if we cannot formally exclude an impaired expression of CD41 and CD42a by FLI1 variants, the reduced percentage of high-ploidy cells (≥8n) confirmed the MK differentiation defect. Furthermore, the platelet from the FLI1 variant carriers displayed normal expression of CD42a (data not shown) and CD41. Consistent with our findings, data from PTS patients has shown that the MK transition from CD42a− to CD42a+ was especially sensitive to a reduction in FLI1 dosage.26 In a murine model with complete Fli1 deficiency, the authors reported that megakaryocytic progenitors displayed an early blockage in MK differentiation.40 Additionally, in a murine model expressing a truncated Fli1 protein lacking the C-terminal transcriptional activation domain, bone marrow cell analysis revealed a 2-fold increase in CD34+CD41+CD42− cells.28
The study herein provides new insights into the mechanisms that drive FLI1-associated thrombocytopenia and highlights its function in normal and pathologic megakaryopoiesis and in platelet granule biogenesis. TEM and FIB-SEM enabled a more detailed description of the ultrastructural features associated with this disease, demonstrating that dense granules were nearly absent in the carriers’ platelets. This work also shows that the increased expression of MYH10 in the platelets of FLI1 variant carriers was efficiently detected by flow cytometry.
Supplementary Material
Footnotes
Check the online version for the most updated information on this article, online supplements, and information on authorship & disclosures: www.haematologica.org/content/102/6/10006
Funding
The study was funded by the “Fondation pour la Recherche Médicale” (grant to PS: FDM20150633607). The authors acknowledge Christian Cambillau (Architecture et Fonction des Macromolécules Biologiques, UMR 7257, Centre National de la Recherche Scientifique, Marseille, France) for the structural modelling, the members of the French reference center on hereditary platelet disorders (CRPP) for clinical analysis of patients, Monique Verdier, Odile Georgelin and Jean-Yves Rinckel for experimental assistance, Marc Delépine and Céline Baulard for genetic study and Sandra Moore and Delphine Bastelica for revision of the paper. Bioinformatic analysis of the exome data were performed using the C2BIG computing cluster funded by the Region Ile de France, the Pierre and Marie Curie University and the ICAN Institute for Cardiometabolism and Nutrition (ANR-10-IAHU-05). The authors would also like to thank the patients and their families.
References
- 1.Lambert MP. Update on the inherited platelet disorders. Curr Opin Hematol. 2015;22(5):460466. [DOI] [PubMed] [Google Scholar]
- 2.Favier R, Raslova H. Progress in understanding the diagnosis and molecular genetics of macrothrombocytopenias. Br J Haematol. 2015;170(5):626–639. [DOI] [PubMed] [Google Scholar]
- 3.Songdej N, Rao AK. Inherited platelet dysfunction and hematopoietic transcription factor mutations. Platelets. 2017;28(1):20–26. [DOI] [PMC free article] [PubMed] [Google Scholar]
- 4.Nichols KE, Crispino JD, Poncz M, et al. Familial dyserythropoietic anaemia and thrombocytopenia due to an inherited mutation in GATA1. Nat Genet. 2000; 24(3):266–270. [DOI] [PMC free article] [PubMed] [Google Scholar]
- 5.Freson K, Devriendt K, Matthijs G, et al. Platelet characteristics in patients with X-linked macrothrombocytopenia because of a novel GATA1 mutation. Blood. 2001; 98(1):85–92. [DOI] [PubMed] [Google Scholar]
- 6.Kitamura K, Okuno Y, Yoshida K, et al. Functional characterization of a novel GFI1B mutation causing congenital macrothrombocytopenia. J Thromb Haemost. 2016;14(7):1462–1469. [DOI] [PubMed] [Google Scholar]
- 7.Stockley J, Morgan NV, Bem D, et al. Enrichment of FLI1 and RUNX1 mutations in families with excessive bleeding and platelet dense granule secretion defects. Blood. 2013;122(25):4090–4093. [DOI] [PMC free article] [PubMed] [Google Scholar]
- 8.Stevenson WS, Rabbolini DJ, Beutler L, et al. Paris-Trousseau thrombocytopenia is phenocopied by the autosomal recessive inheritance of a DNA-binding domain mutation in FLI1. Blood. 2015; 126(17):2027–2030. [DOI] [PubMed] [Google Scholar]
- 9.Stevenson WS, Morel-Kopp M-C, Chen Q, et al. GFI1B mutation causes a bleeding disorder with abnormal platelet function. J Thromb Haemost. 2013;11(11):2039–2047. [DOI] [PubMed] [Google Scholar]
- 10.Monteferrario D, Bolar NA, Marneth AE, et al. A dominant-negative GFI1B mutation in the gray platelet syndrome. N Engl J Med. 2014;370(3):245–253. [DOI] [PubMed] [Google Scholar]
- 11.White JG. Electron opaque structures in human platelets: which are or are not dense bodies? Platelets. 2008;19(6):455–466. [DOI] [PubMed] [Google Scholar]
- 12.Antony-Debré I, Bluteau D, Itzykson R, et al. MYH10 protein expression in platelets as a biomarker of RUNX1 and FLI1 alterations. Blood. 2012;120(13):2719–2722. [DOI] [PubMed] [Google Scholar]
- 13.Sharrocks AD. The ETS-domain transcription factor family. Nat Rev Mol Cell Biol. 2001;2(11):827–837. [DOI] [PubMed] [Google Scholar]
- 14.Lemarchandel V, Ghysdael J, Mignotte V, Rahuel C, Roméo PH. GATA and Ets cis-acting sequences mediate megakaryocyte-specific expression. Mol Cell Biol. 1993; 13(1):668–676. [DOI] [PMC free article] [PubMed] [Google Scholar]
- 15.Zhang L, Lemarchandel V, Romeo PH, Ben-David Y, Greer P, Bernstein A. The Fli-1 proto-oncogene, involved in erythroleukemia and Ewing’s sarcoma, encodes a transcriptional activator with DNA-binding specificities distinct from other Ets family members. Oncogene. 1993;8(6):1621–1630. [PubMed] [Google Scholar]
- 16.Wang X, Crispino JD, Letting DL, Nakazawa M, Poncz M, Blobel GA. Control of megakaryocyte-specific gene expression by GATA-1 and FOG-1: role of Ets transcription factors. EMBO J. 2002; 21(19):5225–5234. [DOI] [PMC free article] [PubMed] [Google Scholar]
- 17.Hashimoto Y, Ware J. Identification of essential GATA and Ets binding motifs within the promoter of the platelet glycoprotein Ib alpha gene. J Biol Chem. 1995;270(41):24532–24539. [DOI] [PubMed] [Google Scholar]
- 18.Bastian LS, Kwiatkowski BA, Breininger J, Danner S, Roth G. Regulation of the megakaryocytic glycoprotein IX promoter by the oncogenic Ets transcription factor Fli-1. Blood. 1999;93(8):2637–2644. [PubMed] [Google Scholar]
- 19.Deveaux S, Filipe A, Lemarchandel V, Ghysdael J, Roméo PH, Mignotte V. Analysis of the thrombopoietin receptor (MPL) promoter implicates GATA and Ets proteins in the coregulation of megakaryocyte-specific genes. Blood. 1996; 87(11):4678–4685. [PubMed] [Google Scholar]
- 20.Furihata K, Kunicki TJ. Characterization of human glycoprotein VI gene 5’ regulatory and promoter regions. Arterioscler Thromb Vasc Biol. 2002;22(10):1733–1739. [DOI] [PubMed] [Google Scholar]
- 21.Watson DK, Smyth FE, Thompson DM, et al. The ERGB/Fli-1 gene: isolation and characterization of a new member of the family of human ETS transcription factors. Cell Growth Differ. 1992;3(10):705–713. [PubMed] [Google Scholar]
- 22.Seth A, Robinson L, Thompson DM, Watson DK, Papas TS. Transactivation of GATA-1 promoter with ETS1, ETS2 and ERGB/Hu-FLI-1 proteins: stabilization of the ETS1 protein binding on GATA-1 promoter sequences by monoclonal antibody. Oncogene. 1993;8(7):1783–1790. [PubMed] [Google Scholar]
- 23.Pang L, Xue H-H, Szalai G, et al. Maturation stage-specific regulation of megakaryopoiesis by pointed-domain Ets proteins. Blood. 2006;108(7):2198–2206. [DOI] [PMC free article] [PubMed] [Google Scholar]
- 24.Breton-Gorius J, Favier R, Guichard J, et al. A new congenital dysmegakaryopoietic thrombocytopenia (Paris-Trousseau) associated with giant platelet alpha-granules and chromosome 11 deletion at 11q23. Blood. 1995;85(7):1805–1814. [PubMed] [Google Scholar]
- 25.Favier R, Jondeau K, Boutard P, et al. Paris-Trousseau syndrome: clinical, hematological, molecular data of ten new cases. Thromb Haemost. 2003;90(5):893–897. [DOI] [PubMed] [Google Scholar]
- 26.Raslova H, Komura E, Le Couédic JP, et al. FLI1 monoallelic expression combined with its hemizygous loss underlies Paris-Trousseau/Jacobsen thrombopenia. J Clin Invest. 2004;114(1):77–84. [DOI] [PMC free article] [PubMed] [Google Scholar]
- 27.Grossfeld PD, Mattina T, Lai Z, et al. The 11q terminal deletion disorder: a prospective study of 110 cases. Am J Med Genet A. 2004;129A(1):51–61. [DOI] [PubMed] [Google Scholar]
- 28.Moussa O, LaRue AC, Abangan RS, et al. Thrombocytopenia in mice lacking the carboxy-terminal regulatory domain of the Ets transcription factor Fli1. Mol Cell Biol. 2010;30(21):5194–5206. [DOI] [PMC free article] [PubMed] [Google Scholar]
- 29.Nieuwenhuis HK, Akkerman JW, Sixma JJ. Patients with a prolonged bleeding time and normal aggregation tests may have storage pool deficiency: studies on one hundred six patients. Blood. 1987; 70(3):620–623. [PubMed] [Google Scholar]
- 30.Lordier L, Bluteau D, Jalil A, et al. RUNX1-induced silencing of non-muscle myosin heavy chain IIB contributes to megakaryocyte polyploidization. Nat Commun. 2012;3:717. [DOI] [PubMed] [Google Scholar]
- 31.Booth NA, Simpson AJ, Croll A, Bennett B, MacGregor IR. Plasminogen activator inhibitor (PAI-1) in plasma and platelets. Br J Haematol. 1988;70(3):327–333. [DOI] [PubMed] [Google Scholar]
- 32.White JG. Platelet storage pool deficiency in Jacobsen syndrome. Platelets. 2007; 18(7):522–527. [DOI] [PubMed] [Google Scholar]
- 33.Zang C, Luyten A, Chen J, Liu XS, Shivdasani RA. NF-E2, FLI1 and RUNX1 collaborate at areas of dynamic chromatin to activate transcription in mature mouse megakaryocytes. Sci Rep. 2016;6:30255. [DOI] [PMC free article] [PubMed] [Google Scholar]
- 34.Suzuki T, Li W, Zhang Q, et al. Hermansky-Pudlak syndrome is caused by mutations in HPS4, the human homolog of the mouse light-ear gene. Nat Genet. 2002;30(3):321–324. [DOI] [PubMed] [Google Scholar]
- 35.Tolmachova T, Abrink M, Futter CE, Authi KS, Seabra MC. Rab27b regulates number and secretion of platelet dense granules. Proc Natl Acad Sci USA. 2007; 104(14):5872–5877. [DOI] [PMC free article] [PubMed] [Google Scholar]
- 36.Cao Y, Cai J, Zhang S, et al. Loss of autophagy leads to failure in megakaryopoiesis, megakaryocyte differentiation, and thrombopoiesis in mice. Exp Hematol. 2015;43(6):488–494. [DOI] [PubMed] [Google Scholar]
- 37.Feng W, Chang C, Luo D, et al. Dissection of autophagy in human platelets. Autophagy. 2014;10(4):642–651. [DOI] [PMC free article] [PubMed] [Google Scholar]
- 38.Hu W, Philips AS, Kwok JC, Eisbacher M, Chong BH. Identification of nuclear import and export signals within Fli-1: roles of the nuclear import signals in Fli-1-dependent activation of megakaryocyte-specific promoters. Mol Cell Biol. 2005;25(8):3087–3108. [DOI] [PMC free article] [PubMed] [Google Scholar]
- 39.Sakimura R, Tanaka K, Nakatani F, et al. Antitumor effects of histone deacetylase inhibitor on Ewing’s family tumors. Int J Cancer. 2005;116(5):784–792. [DOI] [PubMed] [Google Scholar]
- 40.Hart A, Melet F, Grossfeld P, et al. Fli-1 is required for murine vascular and megakaryocytic development and is hemizygously deleted in patients with thrombocytopenia. Immunity. 2000; 13(2):167–177. [DOI] [PubMed] [Google Scholar]
Associated Data
This section collects any data citations, data availability statements, or supplementary materials included in this article.