Figure 4.

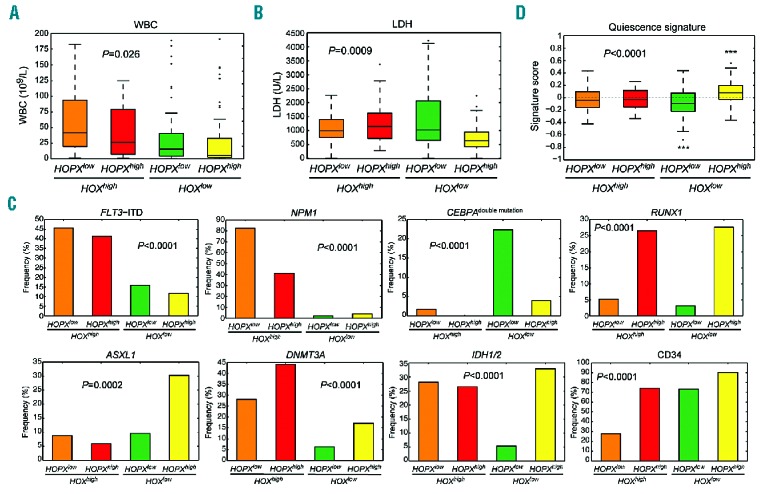
The distinct clinical and genetic features among acute myeloid leukemia (AML) patients stratified by expression of HOPX and HOX family genes. (A and B) Box plots of white blood cell (WBC) counts and serum lactate dehydrogenase (LDH) levels. There is a significant difference in both variables among the 4 clusters. The highest median of WBC count appears in HOXhigh/HOPXlow group, while that of HOXlow/HOPXhigh falls to the bottom of all clusters. Similar trends are seen in LDH levels. Statistical significance were tested by ANOVA tests. (C) The 4 clusters are associated with distinctive gene mutations. FLT3-ITD and mutations in NPM1 and DNMT3A are more common in HOXhigh patients regardless of HOPX expression levels; the RUNX1 mutation is more frequent in HOPXhigh regardless of HOX expression levels; the CEBPA double mutation is predominantly seen in HOXlow/HOPXlow patients; the ASXL1 mutation is mainly present in HOXlow/HOPXhigh subgroup; IDH1/2 mutations are particularly rare in HOXlow/HOPXlow patients. CD34+ blasts are low in HOXhigh/HOPXlow patients. (D) Association of quiescence HSC signature with expression of HOPX and HOX family genes. We employ a gene set enrichment scoring to quantify the overall activity of the gene signature in each sample; a positive/negative score represents a tendency toward quiescent/proliferative HSC state. Inter-group changes are tested by an ANOVA test. Asterisks denote significant differences from zero assessed by one-sample t-tests (***P<0.001).
