

Abstract
Biocrusts are model ecosystems of global change studies. However, light and non-rainfall water (NRW) were previously few considered. Different biocrust types further aggravated the inconsistence. So carbon-exchange of biocrusts (cyanobacteria crusts-AC1/AC2; cyanolichen crust-LC1; chlorolichen crust-LC2; moss crust-MC) utilizing NRW at various temperatures and light-intensities were determined under simulated and insitu mesocosm experiments. Carbon input of all biocrusts were negatively correlated with experimental temperature under all light-intensity with saturated water and stronger light with equivalent NRW, but positively correlated with temperature under weak light with equivalent NRW. LCPs and R/Pg of AC1 were lowest, followed in turn by AC2, LC2 and MC. Thus AC1 had most opportunities to use NRW, and 2.5 °C warming did cause significant changes of carbon exchange. Structural equation models further revealed that air-temperature was most important for carbon-exchange of ACs, but equally important as NRW for LC2 and MC; positive influence of warming on carbon-input in ACs was much stronger than the latter. Therefore, temperature effect on biocrust carbon-input depends on both moisture and light. Meanwhile, the role of NRW, transitional states between ACs, and obvious carbon-fixation differences between lichen crusts should be fully considered in the future study of biocrusts responding to climate change.
Introduction
Arid and semiarid regions account for 41% of global land area, while more than 70% soil surface of these regions is occupied by biocrusts mainly composed by cyanobacteria, fungi, lichen and moss. So biocrusts are the primary biological components of the soil carbon pool of these areas1, and play an important role in topsoil stabilization, texture improvement and fertilization enhancement1–4. Due to the location of the topmost soil surface, the sensitivity to environment, and their simple composition and easy manipulation, biocrusts are model ecosystems to study both land climate change5–9 and ecological restoration of drylands10, 11.
There have been many simulation studies on biocrust responses to climate, and the consistent trends include carbon emission increase, cyanobacteria increase, lichens decrease, succession retrogression9, 12–20, and nitrogen fixation was negatively affected21–23, even the community shift was similar to that of physical disturbance19. However, there were quite a few conflicting results. In terms of warming alone, some reflected that the coverage and abundance of lichens or/and mosses was reduced6, 9, 17–19, 24. Some reported that the coverage of lichens distinctly decreased but mosses increased slightly7, or community composition, the function and soil chemistry were only slightly affected or not affected13, 15, 16, 21, or lichens were less affected19. As to the effects of altered precipitation, the composition and function of biocrusts were not significantly influenced, or only negatively affected in certain areas or seasons5, 7, 9, 13, 17, 21, or completely contradictory in the same geographic profile25, 26. The above inconsistent results were partially ascribed to the diversities between regions, day and night, and seasons5, 9, 18, 27, 28, but we thought that the genetic differences from evolutionary positions19, and the complex interactions between temperature, water6, 9 and light intensity were both the fundamental and long standing questions. So the intrinsic characteristics of dominant communities in biocrusts should be specially considered, and the pattern of their carbon exchange responding to crucial environmental factors must be clarified.
Of all the environmental factors, water is most important. Without water other factors will not exert effect. Once moistened, the wetness degree, temperature and light intensity would all significantly affect biocrusts6, 7, 12, 29–31. However, the natural biocrusts are inactive in more than 90% time due to desiccation32. So the present detections of CO2 exchange in biocrusts were performed either under indoor simulation experiments that artificially added water33–38, or after rainfall39. Additionally, a striking advantage of biocrusts was their utilization of non-rainfall water (NRW), which occurred ca. 270 nights every year40, 41 and accounted for a high proportion of the total annual precipitation42, even was the only water source43–46. Some also suggested that NRW was of great importance in carbon balance of biocrusts9. However, by now there are few studies on the NRW utilization by biocrusts.
Light, as the necessary condition for the carbon fixation of cryptogams, is the driving energy of the earth’s temperature change. Either seasonal or diurnal carbon exchange at global scale influenced by temperature is actually driven by solar irradiation. Since photosynthesis of most plants mainly occurs in daytime with abundant sunlight, previous studies paid more attention to the effects of temperature and water rather than light5, 18, 47, thus the influence of light on carbon exchange of biocrusts is also poorly known.
NRW accumulation occurs in the period from nightfall to early morning, with variable temperature, light intensity and NRW amount, and this is an ideal natural opportunity to study the interactions between biocrusts carbon exchange and water, temperature and light. Therefore in this study, we selected 4 types of biocrusts that are highly dominated by variant cryptogams and possess different carbon assimilation mechanisms, namely 2 cyanobacteria crusts (AC1 and AC2), 1 lichen crust with cyanobacteria as photobiont (LC1), the other with green algae as photobiont (LC2) and 1 moss crust (MC). In order to obtain intrinsic potentiality and adaptation patterns of biocrustal carbon exchange responding to temperature, light and water, various light intensities and temperature conditions that were similar to the nights with abundant NRW, as well as two moisture gradients of saturated water (SW) and equivalent NRW (E-NRW) were firstly designed. The respiration rate (R), net photosynthesis rate (Pn), gross photosynthesis (Pg), and light compensation points (LCPs) of different biocrusts were measured, and the pattern of CO2 exchange were synchronously analyzed by multivariate nonlinear regression. The ratios of respiration to gross photosynthesis (R/Pg), which could reflect the biological differences of various biocrust types utilizing water, were also explored. Then, by in situ mesocosm experiments, CO2 exchanges of all chosen biocrusts were analyzed in NRW abundant seasons, the crucial factors and the patterns of CO2 exchange were determined by structural equation models, and the influencing degrees were quantifiably perceived by path coefficients. Finally, the community changes of biocrusts under the background of global climate change were predicted, and the suggestions for subsequent relative studies were proposed.
Results and Discussion
Dark respiration (R), net photosynthesis (Pn), light compensation points (LCPs), gross photosynthesis (Pg), and R/Pg under saturated water
R of all biocrusts increased as temperature increased (Fig. 1), but at the same temperature, the order from high to low was: MC > LC2 > LC1 > AC2 > AC1. Pn obviously increased with light intensity, but decreased with rising temperature for the same biocrusts, though no significant difference over different temperatures. LCPs also varied with temperature, specifically, the lower the temperature, the lower the LCP. At the same temperature, the LCP of AC1 was the lowest, and in turn followed by AC2, LC1, LC2, and MC (Fig. 2a). The pattern of Pg was similar to Pn, namely increased with light intensity and temperature, but the increasing amount was highest in ACs, followed by LCs, and MC was the lowest. At the same temperature and light intensity, the maximum Pg was in the order: MC > LC2 > LC1 > AC2 > AC1. And the difference of 2.5 °C in ACs resulted in quite different Pg.
Figure 1.
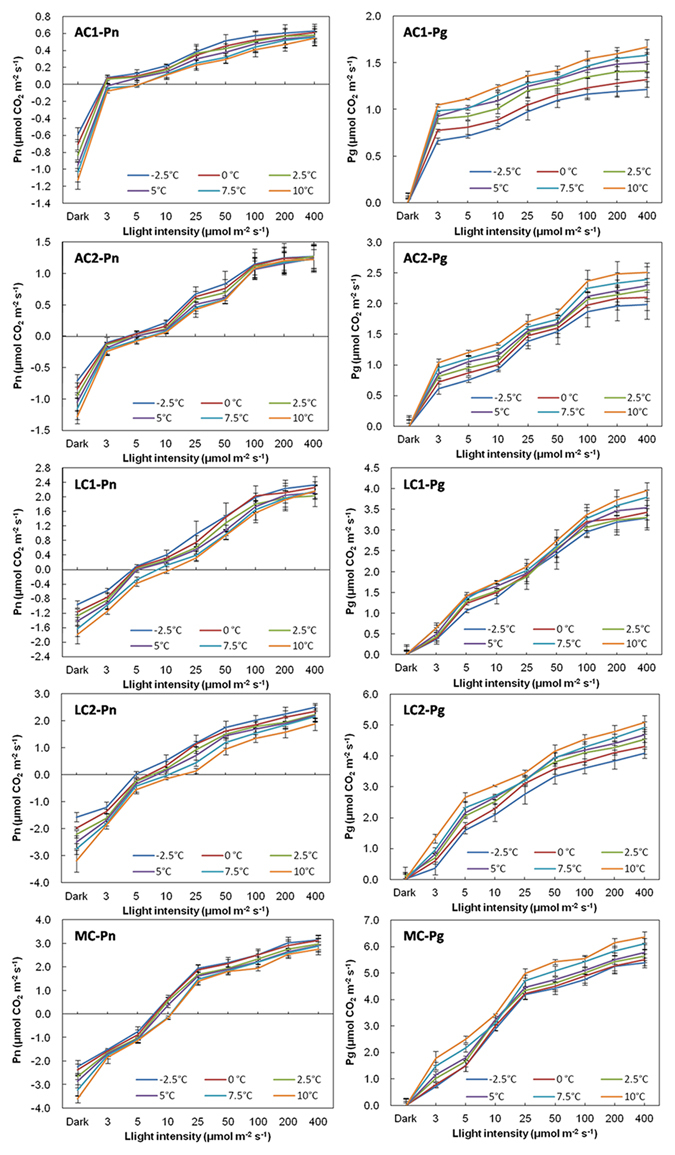
Dark respiration, Pn and Pg of biocrusts determined under different light and temperature conditions when water is saturated. Carbon exchange rate under dark condition represented respiration. Pg is calculated from R and Pn at the same temperature. (n = 3~5).
Figure 2.

Light compensation points of biocrusts under two water conditions (SW and E-NRW) and different temperature gradients.
For R/Pg (Fig. 3a), it exponentially declined with light intensity, but as temperature increased, the differences among biocrusts gradually decreased and became more similar, especially when light intensity was higher than 25 μmol m−2 s−1. At 3 μmol m−2 s−1, R/Pg of AC1 was lowest, followed by AC2, then LCs and MC. At 5 μmol m−2 s−1 of light intensiy, R/Pg of two ACs were still lowest, that of MC was highest; but under −2.5~5 °C, the order of two lichen crusts was LC1 < LC2, under 7.5~10 °C, LC2 < LC1. Under 10 μmol m−2 s−1 light, R/Pg of LC2 was highest from −2.5~7.5 °C, LC1 was second-highest from 2.5~7.5 °C, MC was second-highest at −2.5 °C. At 10 °C, the sequence was LC1 > LC2 > MC.
Figure 3.

The ratios of dark respiration to gross photosynthesis (R/Pg) for biocrusts at different range of light intensity (3~400 μmol m−2 s−1) and temperature gradients (−2.5~10 °C) under SW and E-NRW.
R, Pn, LCPs, Pg and R/Pg under E-NRW
R of all biocrusts under E-NRW also increased with temperature (Fig. 4), the sequence from high to low was MC > LC2 > LC1 > AC2 > AC1. For Pn and LCPs, both increased with temperature, but Pn (except LC1 was never detected) had no significant differences (P > 0.05) between temperature gradient of 2.5 °C. At the same temperature, LCP in AC1 was lowest, in turn followed by AC2, LC2 and MC (Fig. 2b). Under light intensity lower than LCPs, the time window of positive Pn and the increasing amplitude with decreasing temperature manifested in the order: AC1 > AC2 > LC2 (LC2 slightly above MC). But the order reversed under higher light intensity, the increasing amplitude with rising temperature was in the order of AC1 > AC2 > LC2 ≈ MC. The pattern of Pg was similar to that of SW except for LC1 (Fig. 4), Pg also increased with light intensity and temperature, and the increasing amplitude was also highest in ACs, and then in turn was LCs and MC (Fig. 4a). The magnitude under the same temperature and light intensity from highest to the lowest was MC, LC2, AC2, and AC1. When light intensities were higher than 25 μmol m−2 s−1, the warming of 2.5 °C in ACs also resulted in quite different Pg.
Figure 4.

Dark respiration, Pn and Pg of biocrusts determined under different light and temperature conditions when water content is equivalent to NRW. Carbon exchange rate under dark condition represented respiration. Pg is calculated from R and Pn at the same temperature. (n = 3~5).
The R/Pg decreased with the increase of light intensity. Along with the increase of temperature, the differences in R/Pg values among various biocrusts decreased gradually and approached each other under light higher than 25 μmol m−2 s−1. But at 3 μmol m−2 s−1, the R/Pg of AC1 was lowest at −2.5~10 °C, and that of AC2 only next to AC1 at −2.5~0 °C. From −2.5~5 °C, R/Pg of LC2 and MC were higher and MC > LC2. The gaps between AC2 and LC2 and MC decreased at 5 °C. At 10 °C, R/Pg of AC2 was highest. Under 5 μmol m−2 s−1, the R/Pg values were in the order of LC1 > MC > LC2 > AC2 > AC1, and LC1 > MC > AC2 > LC2 > AC1 under 10 μmol m−2 s−1.
Comparisons of R, Pn, LCPs, Pg, and R/Pg under SW and E-NRW
The largest difference was that Pn was not detected positive in LC1 under E-NRW (Figs 1 and 4). Small precipitation events are very important in arid and semiarid areas48, but the responses of different biocrusts were differently49–51. Based on our data, the different responses were mainly determined by their community traits because the low R/Pg meant approaching carbon balance. During NRW accumulation period, AC1 had strongest competitive advantage due to lowest R/Pg under weak light of all temperatures (highest Pn and lowest R). AC2 had advantage because its R/Pg at −2.5~0 °C was second only to that of AC1. Though LC2 could utilize vaporous water to activate photosynthesis and had relatively high assimilation efficiency52, its R/Pg at −2.5~5 °C was lower than that of MC. So its competition power just followed ACs. MC well adapt to water-deficit environments due to effectively allocation water53, 54, but was less competitive than LC2 due to the highest R/Pg (−2.5~5 °C) and relatively stronger depend on rainfall50. For LC1, although it possesses high resistance to light intensity55 and well adaption to a wide range of temperature (2~40 °C), but it always was at a loss status under NRW, so we thought it could not use NRW, because the maximum NRW (0.17 mm) could not meet its the minimum requirement (0.21 mm)52. This further confirmed that its growth might depend on high photosynthetic efficiency under high temperature and high light after rainfall52. Additionally, although MC also needed more water to activate photosynthesis, its higher roughness, larger contact area with atmosphere, and better cooling effect at night56 made it acquire the required NRW amount. Except the above cryptogams, dominant heterotrophic organisms might also had different or special traits, and further studies are needed.
Then under E-NRW, except for LC1, the relationships between temperature and Pn showed the opposite tendency before and after 10 μmol m−2 s−1. Namely, Pn decreased with temperature when light intensity was lower than 10 μmol m−2 s−1, but increased with temperature when light intensity was higher than 25 μmol m−2 s−1, while Pn under SW always decreased with the rising temperature. At the night with limited light, Pn is negatively related to temperature under both SW and E-NRW with light lower than 10 μmol m−2 s−1, which is similar to the pattern of vegetation growth responding to autumnal nocturnal temperature in arid areas of the north hemisphere and spring nighttime of the south hemisphere28. Under E-NRW with light intensity more than or equal to 25 μmol m−2 s−1, Pn is positively correlated with temperature, which also resembled the pattern of vegetation responding to vernal and aestival daytime temperature in arid areas of both north and south hemisphere28. This indicated that the relationships between Pn and light intensity and temperature were also regulated by soil moisture conditions57. The pattern of Pn was different in diverse moisture ranges due to the adjustment of soil humidity49. The negative correlation between Pn and temperature was mainly because the assimilation intensity of autotrophs was stronger than the dissimilation intensity of heterotrophs. The dark respiration of ACs under SW was not much higher than that under equivalent NRW, and the dark respiration of ACs did not increase with water content47. The positive correlation between Pn and temperature (light at least 25 μmol m−2 s−1) was because the assimilation intensity of autotrophs increased more quickly than the dissimilation intensity of heterotrophs with the rising temperature.
Thirdly, Pn under E-NRW was lower than that under SW for the same temperature and light intensity. We know that the carbon sequestration capacities of different stages of biocrusts are significantly different, and that of MC is the highest, followed in turn by LC and AC; or later stages are higher than earlier stages, light-colored biocrusts are lower than dark-colored ones6, 34, 39. We also confirmed these patterns both in Pn and Pg. But we thought this did not only depend on biomass of cryptogams, but also on their genetic characteristics. The RuBisCO activities of cyanobacteria are remarkable lower than that of green algae and mosses. Although the two ACs are both dominated by cyanobacteria, AC2 had a higher carbon fixation rate than AC1 under stronger light, because the abundant Scytonema of AC2 has advantages in solar radiation tolerance and nitrogen-fixing4, 55.
Fourthly, LCPs were significantly influenced by the water condition (Fig. 2a,b), under E-NRW the LCPs decreased and the values were lower than that of SW, except for AC1 at equal or lower than 2.5 °C. And the larger decreasing amplitude occurred at 7.5~10 °C. Under light condition, the CO2 exchange of wet biocrust is actually the result of the balance between the assimilation of autotrophic cryptogams and the dissimilation of heterotrophic microorganisms. Though moisture and temperature are most important environmental factors influencing soil carbon cycle5, 9, 12, 58, light intensity is the primary factor in the carbon balance between assimilation and dissimilation. The suitable conditions of assimilation and dissimilation are usually not synchronous, but adaptable plants just need low environmental conditions (low temperature, weak light and low water condition included) to activate assimilation59, 60. Our experiments showed that under either SW or E-NRW conditions, the light intensity that AC1 required to activate positive Pn was the lowest, followed by AC2 and LC1, and LC2 and MC needed the highest. This was mainly due to their genetic characteristics of dominant cryptogams. The photosynthetic organisms in the two ACs and LC1 are all cyanobacteria, containing abundant amounts of chlorophyll a and phycobilin, allowing them to capture low light that cannot be utilized by other plants. Cyanobacteria also possess CO2-concentrating mechanism (CCM), which allows them to absorb and store CO2 in carboxysomes when photosynthetic carbon fixation occurs61, and thus reduce CO2 release, resulting in lower LCPs.
LCP is relatively constant under a certain temperature and increases with temperature52. We found that LCPs under SW and E-NRW behaved very differently. The LCPs under E-NRW almost were all lower than that under SW in all experimental temperatures. The decreasing amplitude in the higher temperature range (5 °C~10 °C) was larger than that under temperature lower than 5 °C. This showed biocrusts could regulate LCPs to gain a maximum photosynthetic carbon fixation rate according to the water conditions. Additionally, biocrusts with lower LCPs were more competitive in utilization NRW. And free cyanobacteria possessed stronger CCM than other autotrophs under high water content6, 32, so ACs generally had lower LCPs.
Finally, the amplitude of R increasing with increased temperature under E-NRW was lower than that under SW. Dark respiration is an oxidation-reduction process in which soil communities absorb oxygen and release carbon dioxide in darkness. In biocrusts, it generally increases rapidly with the rising temperature5, 12, and the thermosensitivity also increases with soil moisture12. Our results of respiration were similar to the above patterns, but different biocrusts had disparate sensitivities to soil water and temperature. Specifically, R of AC1 was much more sensitive to water content than temperature, yet that of AC2 and MC, like Grote’s results6, were more sensitive to temperature than water content, while the sensitivities of two LCs to the two factors were similar. These differences were closely related to community composition (both autotrophs and heterotrophs), activity and labile organic matter62.
Relationships between CO2 exchange and water content, temperature, light intensity
Based on multivariate nonlinear regression analysis (Table 1), temperature, water content were both significant predictors of R (accounted for 83~98% of the total variance). R was positively related to temperature and water content, but the disparities of the explanatory degrees obviously existed among different biocrusts. For instance, 78% variances of R in AC1 was explained by water content, and temperature accounted for more variance (59%) of R in AC2. The predictive power of water content and temperature approached for two LCs, and 69% variance of R in MC was explained by temperature.
Table 1.
Multiple regression analyses of dark respiration (R) in response to water content (W) and temperature (T), and photosynthesis in response to temperature and light intensity (L).
| L | W R 2 | P | T R 2 | P | Total R 2 | Predicted model | ||
|---|---|---|---|---|---|---|---|---|
| AC1 | R | 0 | 0.7819 | <0.0001 | 0.1931 | <0.0001 | 0.9750 | −0.161 − 0.887W − 0.032T |
| AC2 | R | 0 | 0.3202 | <0.0001 | 0.5853 | <0.0001 | 0.9055 | −0.66 − 0.185W − 0.032T |
| LC1 | R | 0 | 0.4441 | <0.0001 | 0.4693 | <0.0001 | 0.9134 | −0.789 − 0.195W − 0.046T |
| LC2 | R | 0 | 0.4290 | 0.0011 | 0.3982 | 0.0014 | 0.8276 | −1.331 − 2.98W − 0.078T |
| MC | R | 0 | 0.1587 | 0.0138 | 0.6880 | <0.0001 | 0.8467 | −2.205 − 0.075W − 0.076T |
| SW | L | T R 2 | P | L R 2 | P | Total R 2 | Predicted model | |
| AC1 | Pn | 3–400 | 0.0231 | 0.1140 | 0.5212 | <0.0001 | 0.5444 | −0.107 − 0.015T + 0.05 |
| Pg | 0.0721 | 0.0053 | 0.4941 | <0.0001 | 0.5663 | 0.607 + 0.028T + 0.027 | ||
| AC2 | Pn | 0.0083 | 0.1921 | 0.7501 | <0.0001 | 0.7583 | −0.226 − 0.015T + 0.099 | |
| Pg | 0.0308 | 0.0129 | 0.7330 | <0.0001 | 0.7637 | 0.605 + 0.03T + 0.099 | ||
| LC1 | Pn | 0.0178 | 0.0319 | 0.7956 | <0.0001 | 0.8134 | −0.449 − 0.038T + 0.175 | |
| Pg | 0.0072 | 0.1716 | 0.8031 | <0.0001 | 0.8103 | 0.676 + 0.024T + 0.175 | ||
| LC2 | Pn | 0.0177 | 0.0917 | 0.6776 | <0.0001 | 0.6952 | −0.787 − 0.049T + 0.208 | |
| Pg | 0.0380 | 0.0141 | 0.6628 | <0.0001 | 0.7008 | 1.133 + 0.073T + 0.208 | ||
| MC | Pn | 0.0099 | 0.1897 | 0.7039 | <0.0001 | 0.7138 | −1.009 − 0.047T + 0.27 | |
| Pg | 0.0183 | 0.0758 | 0.6975 | <0.0001 | 0.7158 | 1.399 + 0.064T + 0.27 | ||
| E − NRW | L | T R 2 | P | L R 2 | P | Total R 2 | Predicted model | |
| AC1 | Pn | ≤10 | 0.0576 | 0.0032 | 0.8319 | <0.001 | 0.8896 | −0.298 − 0.011T + 0.148 |
| ≥25 | 0.4829 | <0.001 | 0.3916 | <0.001 | 0.8745 | 0.082 + 0.015T + 0.011 | ||
| Pg | ≤10 | 0.0564 | 0.0037 | 0.8319 | <0.001 | 0.8884 | −0.052 + 0.01T + 0.148 | |
| ≥25 | 0.8392 | <0.001 | 0.1209 | <0.001 | 0.9601 | 0.329 + 0.036T + 0.011 | ||
| AC2 | Pn | ≤10 | 0.0322 | 0.0478 | 0.8157 | <0.001 | 0.8477 | −0.778 − 0.017T + 0.315 |
| ≥25 | 0.4825 | <0.001 | 0.3968 | <0.001 | 0.8794 | 0.25 + 0.028T + 0.02 | ||
| Pg | ≤10 | 0.0005 | 0.7669 | 0.8419 | <0.001 | 0.8427 | −0.053 + 0.002T + 0.315 | |
| ≥25 | 0.7218 | <0.001 | 0.2088 | <0.001 | 0.9306 | 0.975 + 0.047T + 0.02 | ||
| LC1 | Pn | ≤10 | 0.0844 | <0.001 | 0.8693 | <0.001 | 0.9537 | −0.89 − 0.021T + 0.246 |
| ≥25 | 0.1792 | <0.001 | 0.6132 | <0.001 | 0.7925 | −0.18 − 0.006T + 0.009 | ||
| Pg | ≤10 | 0.0054 | 0.1477 | 0.9429 | <0.001 | 0.9483 | 0.002 + 0.005T + 0.246 | |
| ≥25 | 0.7028 | <0.001 | 0.2152 | <0.001 | 0.9180 | 0.712 + 0.02T + 0.009 | ||
| LC2 | Pn | ≤10 | 0.0101 | 0.1143 | 0.9120 | <0.001 | 0.9221 | −1.599 − 0.021T + 0.226L |
| ≥25 | 0.0999 | <0.001 | 0.7816 | <0.001 | 0.8815 | 0.637 + 0.025T + 0.057 | ||
| Pg | ≤10 | 0.0018 | 0.4993 | 0.9194 | <0.001 | 0.9212 | −0.029 + 0.008T + 0.226L | |
| ≥25 | 0.3350 | <0.001 | 0.5762 | <0.001 | 0.9110 | 2.207 + 0.054T + 0.057 | ||
| MC | Pn | ≤10 | 0.0023 | 0.473 | 0.9080 | <0.001 | 0.9103 | −1.638 − 0.009T + 0.199L |
| ≥25 | 0.0245 | 0.0037 | 0.9127 | <0.001 | 0.9372 | 0.193 + 0.018T + 0.089 | ||
| Pg | ≤10 | 0.0123 | 0.1028 | 0.8993 | <0.001 | 0.9116 | −0.037 + 0.02T + 0.199L | |
| ≥25 | 0.1396 | <0.001 | 0.8034 | <0.001 | 0.9431 | 1.794 + 0.047T + 0.089 |
SW = Saturated water. E-NRW = Equivalent non-rainfall water. Pn = Net photosynthesis, Pg = Gross photosynthesis. L = Light intensity (μmol m−2 s−1). Partial and total regression coefficients, and total predicted models for R, Pn and Pg are shown, respectively.
Under the two water conditions and the light intensity ranges, Pn and Pg were both positively related to light intensity. Under all combinations of experimental light intensity and SW, light intensity had more influence on Pn than temperature, and Pn was always negatively related to temperature. However, for Pn under equivalent NRW, light intensity had more predictive power than temperature only under light intensity less than 10 μmol m−2 s−1, and Pn was negatively related to temperature. But the predictive power of temperature was stronger than light intensity that was equal to or more than 25 μmol m−2 s−1, so Pn was positively related to temperature at this condition.
Regression models also showed that 54~81% variances of CO2 exchange were explained by temperature and light intensity under SW. Light intensity accounted for 52~79% variance of Pn and 49~80% variance of Pg. In general, the models had more predictive power for Pg than for Pn. For CO2 exchange under E-NRW, temperature and light intensity accounted for 79~96% of the total variance, and 82~94% of the variances were explained by light intensity at low light (≤10 μmol m−2 s−1). At higher light intensity (≥25 μmol m−2 s−1), temperature accounted for 48~84% variance of CO2 exchange in the two ACs; but its explanatory powers for the other three types of biocrusts were lower, although the explanations for Pg (14~70%) were still significant (<0.0001).
Other than genetic factors, the light intensity is very important to photosynthetic efficiency. Although AC2 also had carbon-fixation advantage under weak light, it had higher Pn and Pg than AC1 under higher light intensity. LC and MC also required a higher light intensity to release their higher photosynthetic productive potential. But compared to the daytime after raining, biocrusts under NRW were actually in a condition with limited light. Thus Pn and Pg of all biocrusts significantly positively correlated with light intensity, and light intensity explained 82~94% variances of carbon exchange under light lower than 10 μmol m−2 s−1, while 72~84% variances of Pg were explained by temperature under light of at least 25 μmol m−2 s−1 only for ACs. Variances of Pg were lower (14~70%) for other crusts, because free cyanobacteria had much more advantages over other cryptogams under weak light, and the determination of Pn needed to consider both respiration and assimilation6.
Temperature also significantly influences Pn and Pg, and generally Pn and Pg all increases with temperature below their optimum. However, respiration intensity often also increases with temperature when moisture is abundant12. To offset and exceed increased respiration consumption, biocrusts must produce higher Pg under the rising temperature. The questions are that the preference temperatures of assimilation and catabolism are not always the same. The increased temperature and decreased moisture all increase respiration, while carbon sequestration increase only when temperature reduction and rainfall enhancement49 were typical daytime pattern except for lichen crusts dominated by Collema and cyanobacteria crusts, because they had stronger positive response to rising temperature35, 52. This was consistent with that ACs was more sensitive to water than temperature6.
It is also worth mentioning that according to the present references, light-colored crusts are often cyanobacteria crusts dominated by Microcoleus, and their response patterns are basically the consistent, for example, Pg was positive with temperature and negatively with water content6. But dark-colored crusts include both cyanobacteria crusts dominated by Scytonema, Nostoc and Microcoleus 5, 6, 34 and lichen crusts dominated by cyanolichen6, 40, 59, 63, some even were mixed by cyanobacteria and lichens16–18, 20. So the present confusion mainly existed in dark-colored crusts. In our results, the relationships between Pn/Pg and temperature under saturated water and E-NRW with weak light (10 μmol m−2 s−1) were consistent with the present partial patterns6, 35, 63; only under the conditions with at least 25 μmol m−2 s−1 light and E-NRW, carbon exchange was positively related with temperature, just like light-colored crusts from cool desert. So biocrust carbon input under NRW is always positively correlated with light, while the effect of temperature depends upon both the range of water content and light intensity. Namely, when water is limited and light is relative abundant, the effect of temperature is positive; but when water is enough, it is negative, regardless of light intensity. So it is difficult to judge the effect of temperature on carbon flux just by dark-colored crusts or light-colored crusts6.
Relationships between carbon exchange and NRW, temperature and light intensity in the field
Structural equation models (SEM, Fig. 5) based on field data showed that the R 2 values of various biocrusts were at the 0.20~0.30. Variations of surface temperature (Ts), air temperature (Ta), and CO2 exchange (CE) were all directly driven by light intensity, and the driving force for Ts was the strongest, followed by Ta, for CE was the weakest. Ts had the strongest effect on NRW in two ACs (Fig. 5a,b). However, in LC2 and MC, light intensity directly affected NRW and also indirectly affected NRW via Ta (Fig. 5c,d). Therefore, CE was influenced by light intensity, Ta, Ts, and NRW together. For the CE of ACs, influence of Ta was the strongest, followed by Ts, then NRW, and that of light intensity was the minimum. For the CE of LC2 and MC, Ta and NRW both had strongest effect, followed by Ts, influence of light intensity was the weakest, but still higher than that of ACs.
Figure 5.

Effects of NRW amount, light intensity (LI) and temperature on carbon exchange (CE) of biocrusts during NRW accumulation period in natural environment. Ta = Temperature of air, Ts = Temperature of soil surface. The width of narrow is in accordance with path coefficient.
Prediction of climate change
Though the abilities of different biocrust types using NRW are different, the experimental biocrusts except for LC1 all could gain carbon input under NRW, and the carbon exchange patterns are clearly different from that in daytime6, 7, 28. Specifically, daytime warming often decreases photosynthesis and increases respiration18, while weak light in nighttime with warming increases photosynthesis more and increases respiration less. So the prediction for climate change from carbon balance should include both daytime and nighttime situations.
Although the direct effects of light intensity and temperature on carbon exchange of biocrusts are distinct under different moisture conditions, diurnal and seasonal carbon exchanges are fundamentally driven by solar irradiation. With the aggravation of global warming, more solar shortwave radiation pass through the atmosphere and arrive at the earth, which result in more aggravated changes in air temperature and soil surface temperature, and will further affect the responses of biocrusts to climate parameters. Based on the importance of soil moisture to climate change50, together with the negative correlationship between Pn and temperature under nocturnal weak light, we found that warming facilitated the cover of ACs more than that of LC2 and MC; AC2 more than AC1; and LC2 more than MC, and the decreased NRW amount caused by climate change would decrease the cover of LC2 and MC more than ACs. Whereas the coverage of ACs increased more or decreased less than that of lichens and mosses meant that the cover of LC2 and MC would decline on the whole pattern, and this is similar to most of the existing results9, 12–20, 59. For LC1, warming alone had little effect, but long-lasting rainfall or frequent NRW without precipitation were detrimental5, 64. LC2 has advantage in using vaporous water, so it should only enlarge at the environment with humid or foggy air, and any exsiccation is adverse. For MC, frequent small precipitation events have negative effects but a relative long-time rainfall is advantageous59. Overall, warming with frequent NRW (>0.08 mm) is beneficial to the expansion of ACs. So global warming was particularly in favor of enlarging biocrust coverage in Polar Regions65 and other arid-cold areas such as the Tibetan Plateau66.
In view of biological traits of biocrusts, the increase of coverage of ACs, which is able to tolerate various temperature, drought, salt stress6, 47, 67, drought68, 69, and disturbance19, might explain the most common influences resulting from various and adverse arid environments7, 13, 19. We thought the transition states between AC1 and AC2, and LC1 and LC2, and mixed biocrusts reduced the differences of various types16, 63, and that was the basic reason of the present confusing results5, 9, 18, 26, 28, 29.
Conclusion
The effect of temperature on biocrust carbon exchange was regulated by water content and light intensity together. Non-rainfall water and light intensity should be considered in the future associated study, and the carbon input in cloudy days after rainfall, at dusk and dawn all should be counted. Additionally, warming under NRW did increase more coverage of cyanobacteria crusts than lichen crusts and moss crusts. But the increased degrees for light-colored (Microcoleus dominated) and dark-colored cyanobacteria crusts (with abundant Scytonema and Nostoc) were distinguishing, the responses of cyanolichen crusts and chlorolichen crusts were even quite different. So the coverage of biocrusts could be applicable for monitoring early alterations caused by climatic changes. And it is greatly urgent to accurately determine biocrust types and community composition, particularly to differentiate the types of lichen crusts and dark-colored cyanobacteria crusts. The comparison of different biocrust types in the same successional stage also should be more accurate. That is, other than the aforementioned NRW and light intensity, the transitional states between ACs, and lichen crusts with obvious carbon-fixation differences all should be fully considered in the future study about biocrusts responding to climate change.
Material and Methods
Study areas
The ACs and MC used in our experiments were sampled from our Field Experiment Station (Hobq Desert, 40°21′N, 109°51′E). As a transitional zone of plateau desert and desert steppe, the region is a typical continental monsoon climate with an average elevation of 1040 m and an annual mean temperature of 6.1 °C (the lowest is −34.5 °C and the highest is 40.2 °C). The annual precipitation and potential evapotranspiration respectively is 293 mm and 2400 mm. The average wind velocity is 3.3 m s−1 and windy (>5 m s−1) day is more than 180 d y−1. The soil texture is aeolian sandy soil, and large areas are shifting sand dunes with an average relative height of 5 m. At present, there is an artificial vegetation area of nearly 5000 m2 formed by cyanobacterial inoculation, in which there are abundant biocrusts70.
Sampling
Samples of ACs and MC were all collected from Dalate sites, the two LCs from Shapotou Scientific Experimental Station of the Tengger Desert (37°32′N; 105°02′E), where is more drier and the environmental conditions are as Hu et al. described2. Biocrusts were sampled with a 5 cm-diameter metal ring sampler and transferred to 15 cm-diameter petri dishes at Dalate Site and Shapotou Site in September of 2014 and 2015, after no rainfall events for at least three days. Sampling positions were in open areas at least 0.2 m far away from shrubs and coverage of the same biocrusts type was determined to be basically the same. Biocrusts samples were transported to the laboratory as soon as possible to prepare for experiments. Natural thickness and completeness of biocrusts samples were ensured throughout the process of collection and transportation. The characteristics of the five types of biocrusts are shown in Table 2.
Table 2.
Characteristics of various biocrusts in different succession stages (mean ± s.e., n = 3).
| AC1 | AC2 | LC1 | LC2 | MC | |
|---|---|---|---|---|---|
| Colour | Grey | Black brown | Black | Brown | Green |
| Surface morphology | Flat, without algal filament | Bit rough, with algal filament | Very rough, rosulate of thallus | Rough, crustose of thallus | Bit rough, blanket of moss |
| Dominant species | Microcoleus vaginatus | Scytonema javanicum | Nostoc sp. | Apatococcus sp. | Byrum argenteum |
| Coverage (%, dry/moist) | >95/100 | >90/100 | >60/90 | >75/85 | >90/100 |
| Thickness (mm) | 4.65 ± 0.52a | 6.58 ± 0.54b | 9.70 ± 0.86c | 11.01 ± 0.78d | 13.63 ± 0.74e |
| Sand (%) | 94.24 ± 0.18a | 89.91 ± 0.39b | 63.33 ± 1.35c | 64.07 ± 0.23c | 58.19 ± 0.07d |
| Silt and clay (%) | 5.76 ± 0.16a | 10.09 ± 0.45b | 36.67 ± 1.34c | 35.93 ± 0.18c | 41.81 ± 0.08d |
| Porosity (%) | 32.37 ± 0.13a | 40.88 ± 1.48b | 53.07 ± 1.61c | 54.62 ± 0.75c | 57.75 ± 0.47d |
| OM (mg cm−2) | 6.63 ± 0.34a | 12.92 ± 0.69b | 41.42 ± 2.80c | 46.75 ± 1.92d | 80.52 ± 3.93e |
| Chl a (μg cm−2) | 8.37 ± 0.57a | 9.67 ± 0.98a | 29.26 ± 2.05b | 33.85 ± 3.81bc | 37.60 ± 3.67c |
| Total Biomass (μmol CO2 h−1cm−2) | 1.41 ± 0.16a | 1.88 ± 0.19b | 2.75 ± 0.09c | 3.30 ± 0.25d | 4.91 ± 0.09e |
The different superscript letters represent that the differences are significant (P < 0.05). EPS = Exopolysaccharides, OM = Organic matter.
Simulated experiments
The activities of biocrusts were reactivated three days before experiments. Samples in 5 cm-diameter lids were rehydrated with sterile distilled water and then put into a microclimate with a light intensity of 100 μmol m−2 s−1 and ambient temperature and CO2 concentration, until the weight of biocrusts dropped to the desiccation level. Each type of biocrusts was tested with 3~5 replications. The whole simulated experiments were completed within 3 months. During the experiments, SW and equivalent NRW in mm were separately added to biocrusts. The NRW amount was based on the actual values measured in the field in autumn, and it was added uniformly to the surface of biocrusts with a small atomizer. Next, the CO2 exchange rate of biocrusts at various temperatures (−2.5 °C, 0 °C, 2.5 °C, 5 °C, 7.5 °C, and 10 °C) and light intensities (dark to 400 μmol m−2 s−1, based on the field light irradiation from night to early morning) was measured using a soil carbon release rate determination device (Yaxinliyi Sci Technol Co. Ltd of China, resolution 0.01 μmol CO2 m−2 s−1). CO2 concentration was the ambient value. During measurements, biocrusts samples were put into a transparent chamber of 0.16 L that was connected to a measurement system. The temperature in the chamber was regulated with a water circulation system, light intensity was controlled with an external light source and light meter (Hansatech Instruments Ltd., UK), and the gas flow rate was controlled at 0.6 L min−1 by an internal mini air pump and flowmeter. The measurements were automatically converted into μmol CO2 m−2 s−1 by the host system. The carbon exchange rate in darkness represented the dark respiration of the biocrusts. The gross photosynthesis rate (Pg) was calculated from the CO2 exchange rate measured under darkness and light at a specific temperature.
Field mesocosm experiments
Mesocosm experiments were conducted in the Field Experiment Station of the Hobq Desert (40°21′N, 109°51′E) in September, 2014 and 2015. Newly collected samples were placed in open areas between sand dunes as soon as possible after harvesting, more than 2 m away from vascular plants. The bottoms of biocrust samples were adjoined the sands below and the upper surfaces of biocrusts were in the same horizontal plane with soil surface, just like under natural conditions. Each sample area was big enough to ensure real thermal conditions and temperature changes between night and day. Care was taken to maintain the natural thickness and completeness of samples during collection, transportation, and placement. The measurement interval was 1 h from 18:00 to 5:00 a.m., and was 0.5 h after that. At least 30 replicates were set up for each type of biocrust samples. Properties of biocrusts including thickness, coverage, roughness, and other feature, were kept as consistent as possible. All samples were measured at different time points until carbon exchange was no longer detected after sunrise. Samples were also set to monitor the real-time NRW amount at different time points. Microclimate parameters (including temperature, light intensity, and air relative humidity) were synchronously recorded by climate observatory and light meter.
Data analysis
Variances of CO2 exchange rate response to the combinations of different temperature and light intensity were analyzed by one-way ANOVA at the 95% confidence degree. The relationships between CO2 exchange rate and temperature and light intensity were analyzed by multiple regression analysis. All above analyses were performed by using SPSS 18.0 software. The influences of light intensity, temperature and real-time NRW amount on the carbon exchange rate of biocrusts were analyzed using structural equation models. Data modeling was conducted on Amos 17.0 software.
Acknowledgements
This work was financially supported by the National Natural Science Foundation of China (41573111, 31170464). Thanks for Qiaoning He to provide help in the field work.
Author Contributions
H.O. and C.H. conceived and designed the experiments together; H.O. performed the experiments and analysed the data. H.O. wrote the main manuscript text and C.H. reviewed the manuscript.
Competing Interests
The authors declare that they have no competing interests.
Footnotes
Publisher's note: Springer Nature remains neutral with regard to jurisdictional claims in published maps and institutional affiliations.
References
- 1.Belnap J. The world at your feet: desert biolbogical soil crusts. Front. Ecol. Environ. 2003;1:181–189. doi: 10.1890/1540-9295(2003)001[0181:TWAYFD]2.0.CO;2. [DOI] [Google Scholar]
- 2.Hu CX, Liu YD, Zhang DL, Huang ZB, Paulsen BS. Cementing mechanism of algal crusts from desert area. Chinese Sci. Bull. 2002;47:1361–1368. doi: 10.1360/02tb9301. [DOI] [Google Scholar]
- 3.Hu CX, Zhang DL, Liu YD. Research progress on algae of the microbial crusts in arid and semiarid regions. Prog. Nat. Sci. 2004;14:289–295. doi: 10.1080/10020070412331343501. [DOI] [Google Scholar]
- 4.Hu, C.X., Gao, K. & Whitton, B.A. Semi-arid regions and deserts, In Ecology of Cyanobacteria II: Their Diversity in Space and Time (ed. Whitton, B. A.) 345–369 (Springer Netherlands, 2012).
- 5.Belnap J, Phillips SL, Miller ME. Response of desert biological soil crusts to alterations in precipitation frequency. Oecologia. 2004;141:306–316. doi: 10.1007/s00442-003-1438-6. [DOI] [PubMed] [Google Scholar]
- 6.Grote EE, Belnap J, Housman DC, Sparks JP. Carbon exchange in biological soil crust communities under differential temperatures and soil water contents: implications for global change. Global Change Biol. 2010;16:2763–2774. doi: 10.1111/j.1365-2486.2010.02201.x. [DOI] [Google Scholar]
- 7.Escolar C, Martínez I, Bowker MA, Maestre FT. Warming reduces the growth and diversity of biological soil crusts in a semi-arid environment: implications for ecosystem structure and functioning. Philos. T. R. Soc. B. 2012;367:3087–3099. doi: 10.1098/rstb.2011.0344. [DOI] [PMC free article] [PubMed] [Google Scholar]
- 8.Escolar C, Maestre FT, Rey A. Biocrusts modulate warming and rainfall exclusion effects on soil respiration in a semi-arid grassland. Soil Biol. Biochem. 2015;80:9–17. doi: 10.1016/j.soilbio.2014.09.019. [DOI] [PMC free article] [PubMed] [Google Scholar]
- 9.de Guevara ML, et al. Simulated climate change reduced the capacity of lichen-dominated biocrusts to act as carbon sinks in two semi-arid Mediterranean ecosystems. Biodivers. Conserv. 2014;23:1787–1807. doi: 10.1007/s10531-014-0681-y. [DOI] [Google Scholar]
- 10.Bowker MA, Maestre FT, Escolar C. Biological crusts as a model system for examining the biodiversity-ecosystem function relationship in soils. Soil Biol. Biochem. 2010;42:405–417. doi: 10.1016/j.soilbio.2009.10.025. [DOI] [Google Scholar]
- 11.Bowker MA, et al. Biological soil crusts (biocrusts) as a model system in community, landscape and ecosystem ecology. Biodivers. Conserv. 2014;23:1619–1637. doi: 10.1007/s10531-014-0658-x. [DOI] [Google Scholar]
- 12.Thomas AD, Hoon SR, Dougill AJ. Soil respiration at five sites along the Kalahari Transect: effects of temperature, precipitation pulses and biological soil crust cover. Geoderma. 2011;167:284–294. doi: 10.1016/j.geoderma.2011.07.034. [DOI] [Google Scholar]
- 13.Johnson SL, et al. Increased temperature and altered summer precipitation have differential effects on biological soil crusts in a dryland ecosystem. Global Change Biol. 2012;18:2583–2593. doi: 10.1111/j.1365-2486.2012.02709.x. [DOI] [Google Scholar]
- 14.Maphangwa KW, Musil CF, Raitt L, Zedda L. Experimental climate warming decreases photosynthetic efficiency of lichens in an arid South African ecosystem. Oecologia. 2012;169:257–268. doi: 10.1007/s00442-011-2184-9. [DOI] [PubMed] [Google Scholar]
- 15.Reed SC, et al. Changes to dryland rainfall result in rapid moss mortality and altered soil fertility. Nat. Clim. Change. 2012;2:752–755. doi: 10.1038/nclimate1596. [DOI] [Google Scholar]
- 16.Zelikova TJ, Housman DC, Grote EE, Neher DA, Belnap J. Warming and increased precipitation frequency on the Colorado Plateau: implications for biological soil crusts and soil processes. Plant Soil. 2012;355:265–282. doi: 10.1007/s11104-011-1097-z. [DOI] [Google Scholar]
- 17.Maestre FT, et al. Changes in biocrust cover drive carbon cycle responses to climate change in drylands. Global Change Biol. 2013;19:3835–3847. doi: 10.1111/gcb.12306. [DOI] [PMC free article] [PubMed] [Google Scholar]
- 18.Darrouzet-Nardi A, Reed SC, Grote EE, Belnap J. Observations of net soil exchange of CO2 in a dryland show experimental warming increases carbon losses in biocrust soils. Biogeochemistry. 2015;126:363–378. doi: 10.1007/s10533-015-0163-7. [DOI] [Google Scholar]
- 19.Ferrenberg S, Reed SC, Belnap J. Climate change and physical disturbance cause similar community shifts in biological soil crusts. P. Natl. Acad. Sci. 2015;112:12116–12121. doi: 10.1073/pnas.1509150112. [DOI] [PMC free article] [PubMed] [Google Scholar]
- 20.Steven B, Kuske CR, Reed SC, Belnap J. Climate change and physical disturbance manipulations result in distinct biological soil crust communities. Appl. Environ. Microb. 2015;81:7448–7459. doi: 10.1128/AEM.01443-15. [DOI] [PMC free article] [PubMed] [Google Scholar]
- 21.Yeager CM, et al. Response of biological soil crust diazotrophs to season, altered summer precipitation, and year-round increased temperature in an arid grassland of the Colorado Plateau, USA. Front. Microbiol. 2012;3:358. doi: 10.3389/fmicb.2012.00358. [DOI] [PMC free article] [PubMed] [Google Scholar]
- 22.Delgado-Baquerizo M, Maestre FT, Rodríguez JG, Gallardo A. Biological soil crusts promote N accumulation in response to dew events in dryland soils. Soil Biol. Biochem. 2013;62:22–27. doi: 10.1016/j.soilbio.2013.02.015. [DOI] [Google Scholar]
- 23.Evans SE, Burke IC. Carbon and nitrogen decoupling under an 11-year drought in the shortgrass steppe. Ecosystems. 2013;16:20–33. doi: 10.1007/s10021-012-9593-4. [DOI] [Google Scholar]
- 24.Maestre, F. T. et al. Warming reduces the cover and diversity of biocrust-forming mosses and lichens, and increases the physiological stress of soil microbial communities in a semi-arid Pinus halepensis plantation. Front. Microbiol. 6 (2015). [DOI] [PMC free article] [PubMed]
- 25.Büdel B, et al. Southern African biological soil crusts are ubiquitous and highly diverse in drylands, being restricted by rainfall frequency. Microbial Ecol. 2009;57:229–247. doi: 10.1007/s00248-008-9449-9. [DOI] [PubMed] [Google Scholar]
- 26.Zedda L, et al. Distribution patterns of soil lichens across the principal biomes of southern Africa. J. Arid Environ. 2011;75:215–220. doi: 10.1016/j.jaridenv.2010.10.007. [DOI] [Google Scholar]
- 27.Piao, S. et al. Spatiotemporal patterns of terrestrial carbon cycle during the 20th century. Global Biogeochem. Cy. 23(4) (2009).
- 28.Tan J, et al. Seasonally different response of photosynthetic activity to daytime and night-time warming in the Northern Hemisphere. Global Change Biol. 2015;21:377–387. doi: 10.1111/gcb.12724. [DOI] [PubMed] [Google Scholar]
- 29.Conant RT, Klopatek JM, Klopatek CC. Environmental factors controlling soil respiration in three semiarid ecosystems. Soil Sci. Soc. Am. J. 2000;64:383–390. doi: 10.2136/sssaj2000.641383x. [DOI] [Google Scholar]
- 30.Castillo-Monroy AP, Maestre FT, Rey A, Soliveres S, García-Palacios P. Biological soil crust microsites are the main contributor to soil respiration in a semiarid ecosystem. Ecosystems. 2011;14:835–847. doi: 10.1007/s10021-011-9449-3. [DOI] [Google Scholar]
- 31.Maestre FT, et al. Ecology and functional roles of biological soil crusts in semi-arid ecosystems of Spain. J. Arid Environ. 2011;75:1282–1291. doi: 10.1016/j.jaridenv.2010.12.008. [DOI] [PMC free article] [PubMed] [Google Scholar]
- 32.Lange OL, Green TGA, Heber U. Hydration-dependent photosynthetic production of lichens: what do laboratory studies tell us about field performance? J. Exp. Bot. 2001;52:2033–2042. doi: 10.1093/jexbot/52.363.2033. [DOI] [PubMed] [Google Scholar]
- 33.Jeffries DL, Link SO, Klopatek JM. CO2 fluxes of cryptogamic crusts. New Phytol. 1993;125:163–173. doi: 10.1111/j.1469-8137.1993.tb03874.x. [DOI] [PubMed] [Google Scholar]
- 34.Zaady E, Kuhn U, Wilske B, Sandoval-Soto L, Kesselmeier J. Patterns of CO2 exchange in biological soil crusts of successional age. Soil Biol. Biochem. 2000;32:959–966. doi: 10.1016/S0038-0717(00)00004-3. [DOI] [Google Scholar]
- 35.Housman DC, Powers HH, Collins AD, Belnap J. Carbon and nitrogen fixation differ between successional stages of biological soil crusts in the Colorado Plateau and Chihuahuan Desert. J. Arid Environ. 2006;66:620–634. doi: 10.1016/j.jaridenv.2005.11.014. [DOI] [Google Scholar]
- 36.Su YG, Li XR, Qi PC, Chen YW. Carbon exchange responses of cyanobacterial-algal crusts to dehydration, air temperature, and CO2 concentration. Arid Land Res. Manag. 2012;26:44–58. doi: 10.1080/15324982.2011.631689. [DOI] [Google Scholar]
- 37.Su YG, Wu L, Zhou ZB, Liu YB, Zhang YM. Carbon flux in deserts depends on soil cover type: A case study in the Gurbantunggute desert, North China. Soil Biol. Biochem. 2013;58:332–340. doi: 10.1016/j.soilbio.2012.12.006. [DOI] [Google Scholar]
- 38.Huang L, Zhang ZS, Li XR. Carbon fixation and its influence factors of biological soil crusts in a revegetated area of the Tengger Desert, northern China. J. Arid Land. 2014;6:725–734. doi: 10.1007/s40333-014-0027-3. [DOI] [Google Scholar]
- 39.Li XR, Zhang P, Su YG, Jia RL. Carbon fixation by biological soil crusts following revegetation of sand dunes in arid desert regions of China: a four-year field study. Catena. 2012;97:119–126. doi: 10.1016/j.catena.2012.05.009. [DOI] [Google Scholar]
- 40.Veste, M. et al. Dew formation and activity of biological soil crusts In Arid Dune Ecosystems (eds Breckle, S.-W., Yair, A., Veste, M.) 305–318 (Springer Berlin Heidelberg, 2008).
- 41.Li XR, Zhang ZS, Huang L. Review of the ecohydrological processes and feedback mechanisms controlling sand-binding vegetation systems in sandy desert regions of China. Chinese Sci. Bull. 2013;58:1483–1496. doi: 10.1007/s11434-012-5662-5. [DOI] [Google Scholar]
- 42.Wang XP, Pan YX, Hu R, Zhang YF, Zhang H. Condensation of water vapour on moss-dominated biological soil crust, NW China. J. Earth Syst. Sci. 2014;123:297–305. doi: 10.1007/s12040-013-0397-5. [DOI] [Google Scholar]
- 43.Malek E, McCurdy G, Giles B. Dew contribution to the annual water balances in semi-arid desert valleys. J. Arid Environ. 1999;42:71–80. doi: 10.1006/jare.1999.0506. [DOI] [Google Scholar]
- 44.Richards K. Observation and simulation of dew in rural and urban environments. Prog. Phys. Geog. 2004;28:76–94. doi: 10.1191/0309133304pp402ra. [DOI] [Google Scholar]
- 45.Westbeld A, et al. Fog deposition to a Tillandsia carpet in the Atacama Desert. Ann. Geophys. 2009;27:3571–3576. doi: 10.5194/angeo-27-3571-2009. [DOI] [Google Scholar]
- 46.Kaseke KF, et al. Spatial variation of “non-rainfall” water input and the effect of mechanical soil crusts on input and evaporation. Pure Appl. Geophys. 2012;169:2217–2229. doi: 10.1007/s00024-012-0469-5. [DOI] [Google Scholar]
- 47.Feng W, Zhang Y, Wu B, Qin S, Lai Z. Influence of environmental factors on carbon dioxide exchange in biological soil crusts in desert areas. Arid Land Res. Manag. 2014;28:186–196. doi: 10.1080/15324982.2013.835006. [DOI] [Google Scholar]
- 48.Petrie MD, Collins SL, Litvak ME. The ecological role of small rainfall events in a desert grassland. Ecohydrology. 2015;8:1614–1622. doi: 10.1002/eco.1614. [DOI] [Google Scholar]
- 49.Anderson-Teixeira KJ, Delong JP, Fox AM, Brese DA, Litvak ME. Differential responses of production and respiration to temperature and moisture drive the carbon balance across a climatic gradient in New Mexico. Global Change Biol. 2011;17:410–424. doi: 10.1111/j.1365-2486.2010.02269.x. [DOI] [Google Scholar]
- 50.Coe KK, Belnap J, Sparks JP. Precipitation-driven carbon balance controls survivorship of desert biocrust mosses. Ecology. 2012;93:1626–1636. doi: 10.1890/11-2247.1. [DOI] [PubMed] [Google Scholar]
- 51.Parton W, et al. Impact of precipitation dynamics on net ecosystem productivity. Global Change Biol. 2012;18:915–927. doi: 10.1111/j.1365-2486.2011.02611.x. [DOI] [Google Scholar]
- 52.Lange OL, Belnap J, Reichenberger H. Photosynthesis of the Cyanobacterial soil-crust lichen Collema tenax from arid lands in southern Utah, USA: role of water content on light and temperature responses of CO2 exchange. Funct. Ecol. 1998;12:195–202. doi: 10.1046/j.1365-2435.1998.00192.x. [DOI] [Google Scholar]
- 53.Csintalan Z, Takacs Z, Proctor MCF, Nagy Z, Tuba Z. Early morning photosynthesis of the moss Tortula ruralis following summer dew fall in a Hungarian temperate dry sandy grassland. Plant Ecol. 2000;151:51–54. doi: 10.1023/A:1026590506740. [DOI] [Google Scholar]
- 54.Kidron GJ, Herrnstadt I, Barzilay E. The role of dew as a moisture source for sand microbiotic crusts in the Negev Desert, Israel. J. Arid Environ. 2002;52:517–533. doi: 10.1006/jare.2002.1014. [DOI] [Google Scholar]
- 55.Büdel B, Karsten U, Garcia-Pichel F. Ultraviolet-absorbing scytonemin and mycosporine-like amino acid derivatives in exposed, rock-inhabiting cyanobacterial lichens. Oecologia. 1997;112:165–172. doi: 10.1007/s004420050296. [DOI] [PubMed] [Google Scholar]
- 56.Liu LC, et al. Effects of microbiotic crusts on dew deposition in the restored vegetation area at Shapotou, northwest China. J Hydrol. 2006;328:331–337. doi: 10.1016/j.jhydrol.2005.12.004. [DOI] [Google Scholar]
- 57.Roux PC, Aalto J, Luoto M. Soil moisture’s underestimated role in climate change impact modelling in low-energy systems. Global Change Biol. 2013;19:2965–2975. doi: 10.1111/gcb.12286. [DOI] [PubMed] [Google Scholar]
- 58.Bowling, D. R., Grote, E. E. & Belnap, J. Rain pulse response of soil CO2 exchange by biological soil crusts and grasslands of the semiarid Colorado Plateau, United States. J. Geophys. Res. 116, 10.1029/2011JG001643 (2011).
- 59.Veste M, Littmann T, Friedrich H, Breckle SW. Microclimatic boundary conditions for activity of soil lichen crusts in sand dunes of the north-western Negev desert, Israel. Flora. 2001;196:465–476. doi: 10.1016/S0367-2530(17)30088-9. [DOI] [Google Scholar]
- 60.Maik V, Thomas L. Dewfall and its geo-ecological implication for biological surface crusts in desert sand dunes (north-western Negev, Israel) J. Arid Land Stud. 2006;16:139–147. [Google Scholar]
- 61.Price GD, Badger MR, Woodger FJ, Long BM. Advances in understanding the cyanobacterial CO2-concentrating-mechanism (CCM): functional components, Ci transporters, diversity, genetic regulation and prospects for engineering into plants. J. Exp. Bot. 2008;59:1441–1461. doi: 10.1093/jxb/erm112. [DOI] [PubMed] [Google Scholar]
- 62.Miralles I, Trasar-Cepeda C, Leirós MC, Gil-Sotres F. Labile carbon in biological soil crusts in the Tabernas desert, SE Spain. Soil Biol. Biochem. 2013;58:1–8. doi: 10.1016/j.soilbio.2012.11.010. [DOI] [Google Scholar]
- 63.Wilske B, et al. The CO2 exchange of biological soil crusts in a semiarid grass-shrubland at the northern transition zone of the Negev desert, Israel. Biogeosci. Dis. 2008;5(3):1969–2001. doi: 10.5194/bgd-5-1969-2008. [DOI] [Google Scholar]
- 64.Matos P, et al. Lichen traits responding to aridity. J. Ecol. 2015;103:451–458. doi: 10.1111/1365-2745.12364. [DOI] [Google Scholar]
- 65.Clark GF, et al. Light-driven tipping points in polar ecosystems. Global Change Biol. 2013;19:3749–3761. doi: 10.1111/gcb.12337. [DOI] [PubMed] [Google Scholar]
- 66.Yang YH, et al. Changes in topsoil carbon stock in the Tibetan grasslands between the 1980s and 2004. Global Change Biol. 2009;15(11):2723–2729. doi: 10.1111/j.1365-2486.2009.01924.x. [DOI] [Google Scholar]
- 67.Wu PP, et al. Physiological and ultrastructural characteristics of Scytonema javanicum under high temperature. Acta. Hydrobiol. Sin. 2012;36:735–743. [Google Scholar]
- 68.Lan SB, Wu L, Zhang DL, Hu CX. Composition of photosynthetic organisms and diurnal changes of photosynthetic efficiency in algae and moss crusts. Plant Soil. 2012;351:325–336. doi: 10.1007/s11104-011-0966-9. [DOI] [Google Scholar]
- 69.Wu L, Lan SB, Zhang DL, Hu CX. Functional reactivation of photosystem II in lichen soil crusts after long-term desiccation. Plant Soil. 2013;69:177–186. doi: 10.1007/s11104-012-1563-2. [DOI] [Google Scholar]
- 70.Lan SB, et al. Non-rainfall water sources in the topsoil and their changes during formation of man-made algal crusts at the eastern edge of Qubqi Desert, Inner Mongolia. Sci. China Life Sci. 2010;53:1135–1141. doi: 10.1007/s11427-010-4049-6. [DOI] [PubMed] [Google Scholar]