

Abstract
At present, 64Cu(II) labeled tracers including 64CuCl2 have been widely applied in the research of molecular imaging and therapy. Human copper transporter 1 (hCTR1) is the major high affinity copper influx transporter in mammalian cells, and specially responsible for the transportation of Cu(I) not Cu(II). Thus, we investigated the feasible application of 64Cu(I) for PET imaging. 64Cu(II) was reduced to 64Cu(I) with the existence of sodium L-ascorbate, DL-Dithiothreitol or cysteine. Cell uptake and efflux assay was investigated using B16F10 and A375 cell lines, respectively. Small animal PET and biodistribution studies were performed in both B16F10 and A375 tumor-bearing mice. Compared with 64Cu(II), 64Cu(I) exhibited higher cellular uptake by melanoma, which testified CTR1 specially influx of Cu(I). However, due to oxidation reaction in vivo, no significant difference between 64Cu(I) and 64Cu(II) was observed through PET images and biodistribution. Additionally, radiation absorbed doses for major tissues of human were calculated based on the mouse biodistribution. Radiodosimetry calculations for 64/67Cu(I) and 64/67Cu(II) were similar, which suggested that although melanoma were with high radiation absorbed doses, high radioactivity accumulation by liver and kidney should be noticed for the further application. Thus, 64Cu(I) should be further studied to evaluate it as a PET imaging radiotracer.
Introduction
Copper (Cu) is an essential micronutrient required for many biological processes in vivo, such as respiration, iron transport, oxidative stress protection, peptide hormone production, pigmentation, blood clotting, and normal cell growth and development1–4. Although Cu is not always abundant in the in vivo environment, cells have evolved a complex system of Cu transporters and chaperones that accumulate Cu3. Members of copper transporter (CTR) family have been reported to be the copper uptake machinery. Human copper transporter 1 (CTR1), a 190-amino acid protein of 28 kDa with three transmembrane domains, mainly acts as a copper transporter in mammal5, 6. Copper metabolism has also been known to be critical for cell proliferation, angiogenesis, and tumor growth7–9. CTR1 has been proven to be overexpressed in many types of cancer cells, including melanoma, prostate cancer, liver cancer, and non-small cell lung cancer (NSCLC)7, 10–12. Therefore, copper metabolism has been explored as an imaging biomarker for tumor detection10, 12, 13.
Copper radionuclides, including 60Cu, 61Cu, 62Cu, 64Cu, and 67Cu, offer versatile choices for applications in imaging and therapy14–16. The short-lived 60Cu (t1/2 = 23.4 min), 61Cu (t1/2 = 3.32 h) and 62Cu (t1/2 = 9.76 min) decay by electron capture and β+ emission, and they have been used as to prepare perfusion agents such as Cu-pyruvaldehyde bis(N4-methylthiosemicarbazone) (PTSM) and Cu-ethylglyoxal bis(thiosemicarbazone) ETS17, 18. The longer-lived 67Cu (t1/2 = 62.01 h) decays exclusively by β− emission and has been used to label monoclonal antibodies and antibody fragments for radioimmunotherapy16, 19. Interestingly, 64Cu has an intermediate half-life of 12.7 h and unique decay prolife (β+: 18%, β−: 38%, and electron capture: 44%), making it a favorable option for radiolabeling nanoparticles, antibodies, antibody fragments, peptides, and small molecules for PET imaging and radionuclide therapy20, 21.
Copper is redox-active, and both cupric (II) and cuprous (I) oxidation states are relevant in the biological systems. Of the different oxidation states, Cu(II) is the most common one presenting in 64Cu radiopharmaceuticals. 64CuCl2 has been reported as a promising PET probe for imaging liver cancer, prostate cancer, melanoma, etc.10, 12, 22. However, more recently, with the better understanding the role of CTR1 in tumor biology, CTR1 has been found to mainly and specifically transport Cu(I) instead of Cu(II)3, 23. Therefore, we hypothesize that 64Cu(I) could serve as a novel and promising probe for tumor PET imaging and therapy. In this study, 64Cu(I)Cl was prepared by reduction of 64Cu(II)Cl2, and it was then evaluated in vitro and in vivo in both B16F10 and A375 tumor models which are known for their high CTR1 expression levels12.
Results
Cell Uptake
As displayed in Fig. 1A, during 4 h incubation period at 37 °C, 64CuCl2 exhibited the steadily increasing accumulation by B16F10 cells over the observation period, and the maximum uptake was seen at 4 h within the follow up time. The B16F10 cell uptake values of 64CuCl2 at 0.5, 1, 2 and 4 h at 37 °C were 1.86 ± 0.09%, 3.13 ± 0.82%, 7.43 ± 0.36%, and 11.30 ± 0.91%, respectively. In comparison, the B16F10 cell uptake trend and performance of 64CuCl (prepared by 64CuCl2 with VitC or DTT) was similar to that of 64CuCl2 but with 1.5–2 folds increasing uptake of the radioactivity. The B16F10 cells uptake values of 64CuCl (prepared by 64CuCl2 with VitC) were 3.01 ± 0.36%, 4.52 ± 0.75%, 9.29 ± 1.13%, and 18.83 ± 0.56%, and of 64CuCl (prepared by 64CuCl2 with DTT) were 4.63 ± 0.43%, 9.06 ± 0.97%, 15.86 ± 2.24%, and 28.11 ± 0.23%, respectively. Interestingly, for the B16F10 cells incubation with 64CuCl prepared by 64CuCl2 with both DTT and cysteine the radioactivity uptake is much lower, and the values at 0.5, 1, 2 and 4 h were 0.37 ± 0.03%, 0.60 ± 0.08%, 1.75 ± 0.06%, and 2.22 ± 0.39%, respectively. There was significant difference among above four groups (P < 0.05).
Figure 1.

Cell uptake assay of 64Cu(II) and 64Cu(I) by B16F10 and A375M cells at 0.5, 1, 2, and 4 h, respectively.
The A375M cell uptake results of 64CuCl2 and 64CuCl were shown in Fig. 1B. 64CuCl2, 64CuCl prepared by 64CuCl2 with VitC, and 64CuCl prepared by 64CuCl2 with DTT exhibited rapid A375M cell accumulation at the first 30 min, followed by a steady increasing, and the highest uptake was also achieved at 4 h, reaching 3.37 ± 0.03%, 10.66 ± 0.37%, and 10.73 ± 0.04%, respectively. There was significant difference between 64CuCl2 and 64CuCl (P < 0.05). Similarly, for the A375M cells incubation with 64CuCl prepared by 64CuCl2 with both DTT and cysteine, the radioactivity accumulation is low, and the values at 0.5, 1, 2 and 4 h were only 0.39 ± 0.04%, 0.50 ± 0.06%, 0.70 ± 0.06%, and 0.68 ± 0.04%, respectively.
For the blocking experiments in either B16F10 or A375M cells, the uptake of 64CuCl2, 64CuCl prepared by 64CuCl2 with VitC, and 64CuCl prepared by 64CuCl2 with DTT, was significantly lower than the corresponding non-blocking groups at each time point (P < 0.05) (Fig. 1A and B). However, there was no significant difference between the blocking and non-blocking groups of 64CuCl prepared by 64CuCl2 with both DTT and cysteine.
Cell Efflux
The radioactivity of 64CuCl2 and 64CuCl prepared by 64CuCl2 with VitC groups was quickly cleared from both B16F10 and A375M cells. As displayed in Fig. 2A, over a 0.5 h incubation period, 42.36 ± 3.56% of 64CuCl2 and 38.72 ± 3.59% of 64CuCl presented in B16F10 cells, respectively. At 24 h, only 15.16 ± 3.04% of 64CuCl2 and 13.74 ± 1.74% of 64CuCl were remained (Fig. 2A). Similar to the cell efflux studies in B16F10 cells, 30.38 ± 3.93% of 64CuCl2 and 27.77 ± 2.91% of 64CuCl presented in A375M cells over a 0.5 h incubation period, respectively, indicating that the radioactivity was quickly cleared from cells for both 64CuCl2 and 64CuCl. And only 13.16 ± 1.32% of 64CuCl2 and 11.13 ± 0.40% of 64CuCl were remained in A375M cells at 24 h (Fig. 2B).
Figure 2.
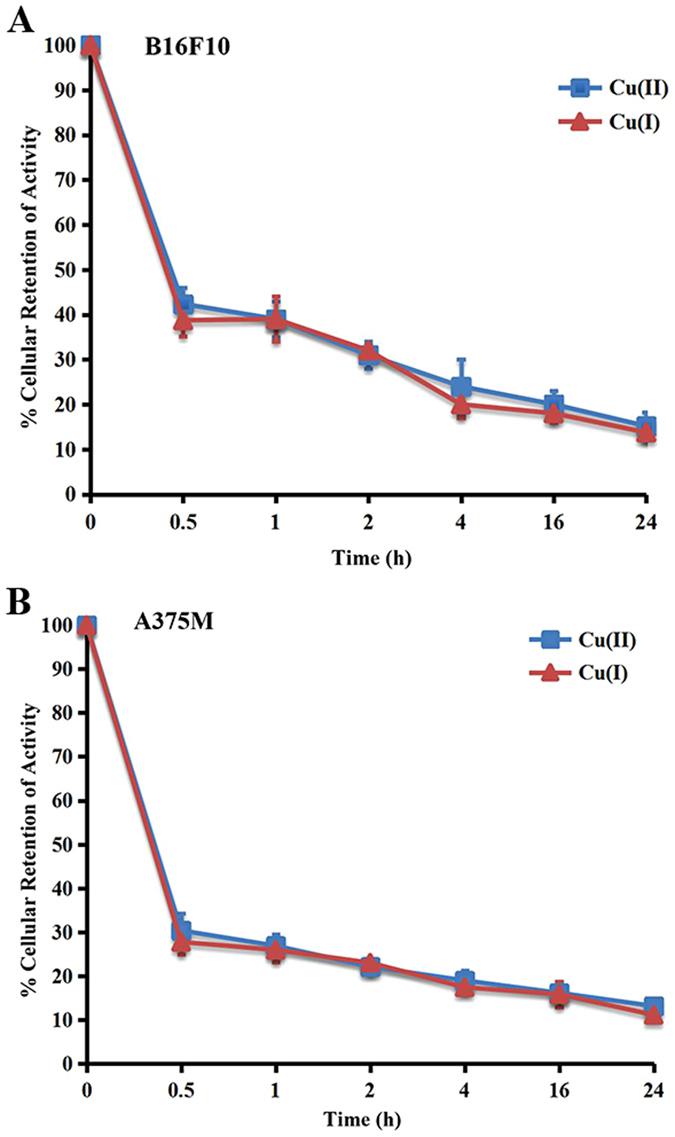
Cell efflux assay from B16F10 and A375M cells after 2 h incubation with 64Cu(II) and 64Cu(I) at 0.5, 1, 2, 4, 16 and 24 h, respectively.
Biodistribution Studies of Mice Bearing B16F10 Tumor
The in vivo biodistribution of 64CuCl2 and 64CuCl prepared by 64CuCl2 with VitC in mice bearing B16F10 tumors was determined at various time points after injection (Table 1). 64CuCl displayed similar in vivo biodistribution as 64CuCl2. 64CuCl2 and 64CuCl displayed rapid and similar level of accumulation in the tumor at the early time point (10.81 ± 0.22%ID/g and 11.21 ± 1.06%ID/g at 1 h p.i. for two probes, respectively, P > 0.05). At later time points, B16F10 tumor uptake of both 64CuCl2 and 64CuCl slightly increased and reached 12.80 ± 0.53%ID/g and 11.26 ± 1.76%ID/g at 4 h (P > 0.05), respectively. B16F10 tumor accumulation of 64CuCl2 and 64CuCl remained 3.14 ± 0.24%ID/g and 3.15 ± 0.23%ID/g, respectively, at 72 h p.i.
Table 1.
Biodistribution Results of 64Cu(II) and 64Cu(I) in B16F10 Tumor-Bearing Mice (n = 4).
| Organ (%ID/g) | 1 h | 2 h | 4 h | 24 h | 48 h | 72 h | ||||||
|---|---|---|---|---|---|---|---|---|---|---|---|---|
| Cu(II) | Cu(I) | Cu(II) | Cu(I) | Cu(II) | Cu(I) | Cu(II) | Cu(I) | Cu(II) | Cu(I) | Cu(II) | Cu(I) | |
| Tumor | 10.81 ± 0.22 | 11.21 ± 1.06 | 11.34 ± 1.79 | 10.95 ± 0.23 | 12.80 ± 0.53 | 11.26 ± 1.76 | 6.56 ± 0.61 | 5.95 ± 0.24 | 3.55 ± 0.14 | 3.69 ± 0.20 | 3.24 ± 0.24 | 3.15 ± 0.23 |
| Blood | 3.18 ± 0.16 | 3.08 ± 0.53 | 2.67 ± 0.48 | 2.72 ± 0.35 | 2.81 ± 0.13 | 2.53 ± 0.48 | 1.72 ± 0.16 | 1.56 ± 0.12 | 1.45 ± 0.05 | 1.84 ± 0.28 | 1.50 ± 0.29 | 1.49 ± 0.38 |
| Heart | 3.95 ± 0.30 | 3.63 ± 0.29 | 3.98 ± 0.50 | 4.50 ± 0.64 | 4.45 ± 0.65 | 3.95 ± 0.18 | 4.11 ± 0.23 | 4.02 ± 0.46 | 4.95 ± 0.20 | 4.96 ± 0.31 | 4.37 ± 0.61 | 4.29 ± 0.46 |
| Lungs | 12.12 ± 1.18 | 15.15 ± 0.39 | 14.50 ± 2.40 | 13.00 ± 1.25 | 15.54 ± 1.53 | 14.04 ± 2.50 | 9.19 ± 0.78 | 8.77 ± 0.72 | 7.52 ± 0.11 | 6.13 ± 0.10 | 6.44 ± 0.86 | 6.33 ± 0.38 |
| Liver | 31.66 ± 3.06 | 36.92 ± 2.47 | 29.21 ± 3.39 | 30.27 ± 4.90 | 29.19 ± 3.61 | 27.31 ± 4.11 | 17.88 ± 0.29 | 18.33 ± 0.98 | 14.43 ± 1.34 | 14.25 ± 1.19 | 13.06 ± 1.43 | 12.56 ± 1.03 |
| Spleen | 3.24 ± 0.78 | 4.9 ± 0.15 | 3.32 ± 0.49 | 5.05 ± 0.21 | 3.33 ± 1.45 | 4.98 ± 0.27 | 3.07 ± 0.24 | 3.51 ± 0.44 | 2.81 ± 0.00 | 3.23 ± 0.90 | 3.46 ± 0.42 | 3.36 ± 0.34 |
| Stomach | 11.52 ± 1.89 | 13.38 ± 1.72 | 14.33 ± 3.24 | 12.48 ± 2.53 | 13.90 ± 0.73 | 10.76 ± 0.99 | 6.18 ± 0.38 | 5.80 ± 0.70 | 4.52 ± 0.34 | 4.57 ± 0.77 | 4.02 ± 0.38 | 4.43 ± 0.25 |
| Pancreas | 3.64 ± 0.53 | 3.63 ± 0.18 | 5.44 ± 2.71 | 3.83 ± 0.86 | 4.09 ± 0.62 | 3.55 ± 0.40 | 2.70 ± 0.09 | 2.60 ± 0.13 | 2.88 ± 0.10 | 2.80 ± 0.17 | 2.46 ± 0.37 | 2.25 ± 1.30 |
| Intestine | 19.89 ± 1.99 | 24.54 ± 2.39 | 19.64 ± 3.76 | 19.63 ± 5.28 | 16.69 ± 0.60 | 16.82 ± 0.84 | 8.12 ± 0.34 | 7.13 ± 1.09 | 5.58 ± 0.53 | 5.24 ± 0.52 | 2.45 ± 0.19 | 2.99 ± 0.43 |
| Kidneys | 17.06 ± 1.42 | 17.95 ± 1.38 | 15.38 ± 0.96 | 14.37 ± 2.61 | 15.84 ± 1.85 | 12.75 ± 2.15 | 11.47 ± 0.73 | 10.56 ± 0.43 | 9.90 ± 1.21 | 8.77 ± 0.96 | 11.06 ± 0.86 | 10.00 ± 0.55 |
| Brain | 0.62 ± 0.10 | 0.68 ± 0.07 | 0.67 ± 0.08 | 0.61 ± 0.03 | 0.78 ± 0.08 | 0.66 ± 0.13 | 0.86 ± 0.04 | 0.77 ± 0.06 | 0.91 ± 0.04 | 0.90 ± 0.05 | 0.90 ± 0.09 | 0.92 ± 0.08 |
| Skin | 2.48 ± 0.46 | 2.21 ± 0.28 | 2.40 ± 0.30 | 2.09 ± 0.53 | 1.66 ± 0.22 | 1.21 ± 0.12 | 0.92 ± 0.08 | 0.89 ± 0.05 | 0.88 ± 0.07 | 0.94 ± 0.19 | 1.18 ± 0.65 | 1.14 ± 0.43 |
| Muscle | 1.30 ± 0.22 | 1.00 ± 0.05 | 1.15 ± 0.05 | 1.00 ± 0.07 | 1.09 ± 0.08 | 1.21 ± 0.65 | 0.89 ± 0.04 | 0.80 ± 0.07 | 1.01 ± 0.08 | 1.17 ± 0.02 | 1.03 ± 028 | 0.70 ± 0.13 |
| Bone | 3.13 ± 0.46 | 3.73 ± 0.86 | 3.43 ± 0.78 | 3.00 ± 0.67 | 2.55 ± 0.25 | 2.57 ± 0.20 | 2.30 ± 0.43 | 2.20 ± 0.05 | 1.71 ± 0.07 | 2.17 ± 0.23 | 1.46 ± 0.25 | 1.35 ± 0.14 |
Both 64CuCl2 and 64CuCl displayed rapid blood clearance, as determined by the radioactivity remaining in the blood from 1 h (3.18 ± 0.16%ID/g vs. 3.08 ± 0.53%ID/g, P > 0.05) to 24 h (1.72 ± 0.16%ID/g vs. 1.56 ± 0.12%ID/g, P > 0.05). Moreover, 64CuCl2 and 64CuCl also showed low muscle uptake of 1.30 ± 0.22%ID/g vs. 1.00 ± 0.05%ID/g at 1 h after injection, which further decreased to 0.89 ± 0.04%ID/g vs. 0.80 ± 0.07%ID/g at 24 h p.i. Relative high uptakes of 64CuCl2 and 64CuCl was found in several normal organs such as liver, kidney, lung, stomach and intestine (Table 1). Except the liver and kidney, the accumulation of 64CuCl2 and 64CuCl in other normal organs and tissues obviously decreased at 72 h p.i. The accumulation of 64CuCl2 and 64CuCl in the liver was observed with values of 31.66 ± 3.06%ID/g and 36.92 ± 2.47%ID/g at 1 h p.i. (P > 0.05), and decreased to 17.88 ± 0.29%ID/g and 18.33 ± 0.98%ID/g at 24 h p.i., respectively(P > 0.05). The accumulation of of 64CuCl2 and 64CuCl in kidneys was also high, with values of 17.06 ± 1.42%ID/g and 17.95 ± 1.38%ID/g at 1 h p.i. (P > 0.05), and decreased to 11.47 ± 0.73%ID/g vs. 10.56 ± 0.43%ID/g at 24 h p.i. (P > 0.05), respectively. These data indicated that 64CuCl2 and 64CuCl were excreted through both the liver and kidneys.
Both 64CuCl2 and 64CuCl displayed moderate to high tumor-to-blood and tumor-to-muscle ratios (Table 2). For example, at 4 h after injection, the tumor-to-blood ratios of 64CuCl2 and 64CuCl were 4.55 ± 0.02 and 4.48 ± 0.39 (P > 0.05), and the tumor-to-muscle ratios of 64CuCl2 and 64CuCl were 11.75 ± 0.84 and 10.46 ± 3.26 (P > 0.05), respectively.
Table 2.
Tumor-to-non tumor Ratios of 64Cu(II) and 64Cu(I) in B16F10 Tumor-Bearing Mice (n = 4).
| Ratio | 1 h | 2 h | 4 h | 24 h | 48 h | 72 h | ||||||
|---|---|---|---|---|---|---|---|---|---|---|---|---|
| Cu(II) | Cu(I) | Cu(II) | Cu(I) | Cu(II) | Cu(I) | Cu(II) | Cu(I) | Cu(II) | Cu(I) | Cu(II) | Cu(I) | |
| Tumor-to-blood | 3.40 ± 0.13 | 3.67 ± 0.32 | 4.28 ± 0.49 | 4.19 ± 0.39 | 4.55 ± 0.02 | 4.48 ± 0.39 | 3.85 ± 0.51 | 3.82 ± 0.41 | 2.44 ± 0.18 | 2.02 ± 0.20 | 2.79 ± 0.42 | 2.40 ± 0.29 |
| Tumor-to-lung | 0.90 ± 0.07 | 0.74 ± 0.05 | 0.79 ± 0.16 | 0.77 ± 0.06 | 0.83 ± 0.10 | 0.81 ± 0.10 | 0.72 ± 0.04 | 0.68 ± 0.07 | 0.47 ± 0.01 | 0.60 ± 0.02 | 0.63 ± 0.07 | 0.50 ± 0.01 |
| Tumor-to-liver | 0.34 ± 0.03 | 0.30 ± 0.02 | 0.39 ± 0.03 | 0.34 ± 0.06 | 0.44 ± 0.06 | 0.41 ± 0.01 | 0.37 ± 0.04 | 0.32 ± 0.01 | 0.25 ± 0.01 | 0.26 ± 0.01 | 0.30 ± 0.04 | 0.25 ± 0.02 |
| Tumor-to-muscle | 8.45 ± 1.36 | 11.22 ± 1.38 | 9.86 ± 1.31 | 9.99 ± 0.47 | 11.75 ± 0.84 | 10.46 ± 3.26 | 7.44 ± 1.05 | 7.43 ± 0.62 | 3.52 ± 0.40 | 3.14 ± 0.23 | 4.11 ± 0.07 | 4.60 ± 0.67 |
Biodistribution Studies of Mice Bearing A375M Tumor
The in vivo biodistribution of 64CuCl2 and 64CuCl in mice bearing A375 tumor was determined at 72 h after injection (Table 3). Similar to biodistribution data in mice bearing B16F10 tumor, 64CuCl2 and 64CuCl also showed similar in vivo performance. A375M tumor accumulation of 64CuCl2 and 64CuCl was 3.59 ± 0.36%ID/g and 3.44 ± 0.52%ID/g (P > 0.05), respectively, at 72 h p.i. The high accumulation of 64CuCl2 and 64CuCl by the liver and kidney was observed, with values of 13.37 ± 1.32%ID/g and 13.29 ± 2.51%ID/g (P > 0.05), and 10.34 ± 0.53%ID/g and 8.87 ± 0.60%ID/g (P > 0.05), respectively. These data also demonstrated that in mice bearing A375M tumor models, both 64CuCl2 and 64CuCl were cleared through hepatobiliary and renal systems. Moreover, both 64CuCl2 and 64CuCl displayed moderate tumor-to-muscle ratio at 72 h after injection (Table 3). The tumor-to-muscle ratios of 64CuCl2 and 64CuCl were 3.46 ± 1.25 and 2.79 ± 0.58 (P > 0.05), respectively.
Table 3.
Biodistribution Results and Tumor-to-non tumor Ratios of 64Cu(II) and 64Cu(I) in A375M Tumor-Bearing Mice (n = 4).
| Organ (%ID/g) | 72 h | |
|---|---|---|
| Cu(II) | Cu(I) | |
| Tumor | 3.59 ± 0.36 | 3.44 ± 0.52 |
| Blood | 1.94 ± 0.56 | 1.90 ± 0.50 |
| Heart | 5.86 ± 0.55 | 6.03 ± 0.48 |
| Lungs | 6.15 ± 0.83 | 5.78 ± 0.60 |
| Liver | 13.33 ± 1.27 | 13.29 ± 2.51 |
| Spleen | 3.49 ± 0.15 | 3.41 ± 0.36 |
| Stomach | 5.46 ± 0.76 | 4.78 ± 1.25 |
| Pancreas | 2.84 ± 0.60 | 2.98 ± 0.22 |
| Intestine | 3.82 ± 0.42 | 3.63 ± 0.65 |
| Kidneys | 9.45 ± 0.34 | 8.87 ± 0.60 |
| Brain | 1.00 ± 0.07 | 0.89 ± 0.14 |
| Skin | 1.95 ± 0.36 | 1.92 ± 0.45 |
| Muscle | 1.16 ± 0.30 | 1.01 ± 0.14 |
| Bone | 1.08 ± 0.22 | 1.04 ± 0.34 |
| Ratio | ||
| Tumor-to-blood | 1.85 ± 0.27 | 1.81 ± 0.16 |
| Tumor-to-lung | 0.58 ± 0.16 | 0.59 ± 0.08 |
| Tumor-to-liver | 0.27 ± 0.03 | 0.25 ± 0.10 |
| Tumor-to-muscle | 3.09 ± 1.46 | 2.79 ± 0.58 |
Small Animal PET of Mice Bearing B16F10 Tumor
Representative coronal and transverse small animal PET images of B16F10 tumor-bearing mice (n = 4) at different time points (1, 2, 4, 24, 48 and 72 h) after injection of 64CuCl2 or 64CuCl were displayed in Fig. 3A. For both probes, the tumors were clearly delineated at 1 h p.i., and persisted to 24 h after injection, which were no longer visible at 48 and 72 h p.i. High liver and kidney uptakes were observed at early time points and beyond, verifying the hepatobiliary and renal clearance route of the two probes. Moreover,other normal organs and tissues displayed relatively low accumulation of 64CuCl2 or 64CuCl at the early time points, and the radioactivity was further decreased after 24 h p.i.
Figure 3.
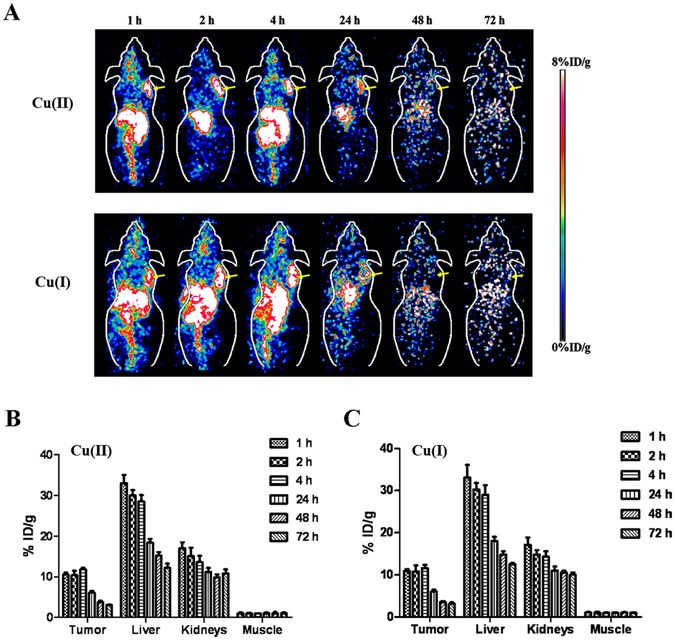
(A) Decay-corrected whole-body coronal small-animal PET images of B16F10 tumor-bearing mice at 1, 2, 4, 24, 48, and 72 h after intravenous injection of 64Cu(II) and 64Cu(I), respectively (Tumors are indicated by arrows). (B and C) Small-animal PET quantification of tumors and major organs (liver, kidney and muscle) at 1, 2, 4, 24, 48, and 72 h after injection of 64Cu(II) and 64Cu(I), respectively (n = 4).
Further quantification analysis (Fig. 3B and C) showed that the tumor uptake of 64CuCl2 and 64CuCl was 11.20 ± 2.18%ID/g and 11.35 ± 2.02%ID/g (P > 0.05), respectively, at 1 h p.i., of which values were 3.21 ± 1.72%ID/g and 3.69 ± 1.34%ID/g (P > 0.05), respectively, at 48 h p.i. The liver and kidney accumulation of 64CuCl2 was 35.96 ± 4.04%ID/g and 17.68 ± 3.02%ID/g, respectively, at 1 h p.i., and 11.96 ± 1.11%ID/g and 10.37 ± 1.21%ID/g, respectively, at 72 h p.i. The liver and kidney uptake of 64CuCl was similar to that of 64CuCl2 at various time points, and there was nosignificant difference (P > 0.05). Both 64CuCl2 and 64CuCl displayed low muscle uptake after the injection, which was 1.25 ± 0.15%ID/g and 1.05 ± 0.33%ID/g (P > 0.05), respectively, at 1 h p.i.
Small Animal PET Imaging of Mice Bearing A375M Tumor
Similarly, Fig. 4A showed representative coronal and transverse small animal PET images of A375M tumor-bearing mice (n = 4) at different time points (1, 2, 4, 24, 48 and 72 h) after injection of 64CuCl2 or 64CuCl. For both 64CuCl2 and 64CuCl, the tumor could be clearly imaged at 1 h p.i. and the high contrast was persisted to 24 h after injection. The tumor was no longer visualized at 48 and 72 h p.i. High liver and kidney uptakes were also observed at all the time points, again indicating the hepatobiliary and renal clearance routes. Moreover, most of the normal organs and tissues also displayed relatively low accumulation of radioactivity after the injection of 64CuCl2 or 64CuCl at the early time points.
Figure 4.
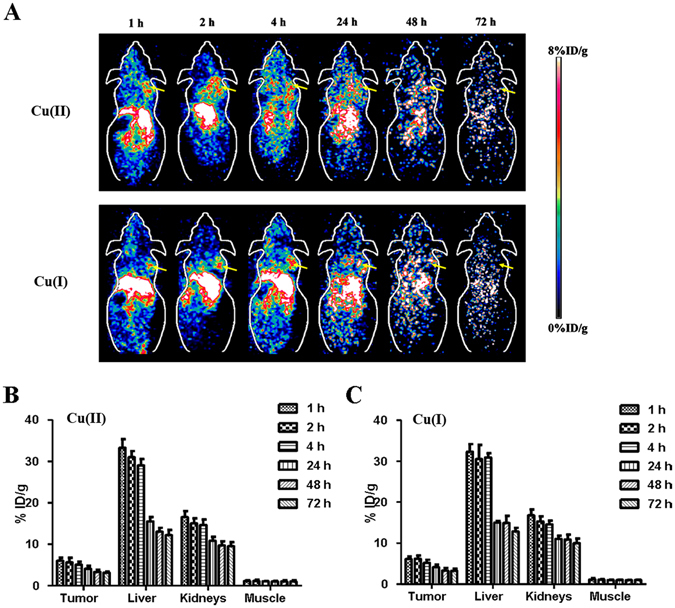
(A) Decay-corrected whole-body coronal small-animal PET images of A375M tumor-bearing mice at 1, 2, 4, 24, 48, and 72 h after intravenous injection of 64Cu(II) and 64Cu(I), respectively (Tumors are indicated by arrows). (B and C) Small-animal PET quantification of tumors and major organs (liver, kidney and muscle) at 1, 2, 4, 24, 48, and 72 h after injection of 64Cu(II) and 64Cu(I), respectively (n = 4).
The quantification results of small animal PET image analysis were shown in Fig. 4B and C. The tumor uptake of 64CuCl2 and 64CuCl was 6.12 ± 1.38%ID/g and 6.51 ± 1.62%ID/g (P > 0.05), respectively, at 1 h p.i., and 3.15 ± 1.22%ID/g and 3.13 ± 1.13%ID/g (P > 0.05), respectively, at 48 h p.i. The liver and kidney accumulation of 64CuCl2 was 32.59 ± 4.20%ID/g and 16.68 ± 2.95%ID/g,respectively, at 1 h p.i., and 12.16 ± 2.01%ID/g and 10.03 ± 1.67%ID/g, respectively, at 72 h p.i. The liver and kidney uptake of 64CuCl was similar to that of 64CuCl2 at 1, 2, 4, 24, 48 and 72 h, and there was no significant difference (P > 0.05). Moreover, both 64CuCl2 and 64CuCl displayed low and similarmuscle uptake after the injection, which was around 1%ID/g at 1 h p.i.
Radiation Absorbed Dose Distribution in Human
The calculated radiation absorbed dose distributions in major organs of a human adult male are shown in Table 4. For both 64CuCl2 and 64CuCl probe, the liver and kidneys showed the highest theoretical radiation absorbed doses; thus, the liver and kidneys would be the dose-limiting organ to carry out cancer-targeted radionuclide therapy. 64CuCl2 and 64CuCl had the similar tumor radiation absorbed dose (1.621 vs. 1.808 ID/g·h). They were anticipated to be promising agents for radionuclide therapy of tumors with CTR1 overexpression. Compared with 64Cu based probes, 67Cu-probes showed higher tumor doses, e.g. 67CuCl2 (2.695 ID/g·h) and 67CuCl (2.971 ID/g·h). However, the 67Cu-probes radiodose in normal organs and tissues were also higher than those of 64Cu based probes. For example: the radiation absorbed dose by liver for 67CuCl2 and 67CuCl was 1.03 and 0.947 cGy/mCi, respectively, whereas for 64CuCl2 and 64CuCl, it was 0.514 and 0.466 cGy/mCi, respectively.
Table 4.
Estimated radiation absorbed doses of 67/64Cu(II/I) in major organs of an adult male patient based on the biodistribution data obtained from B16F10 tumor-bearing mice.
| Target Organ (cGy/mCi) | 64Cu(II) | 67Cu(II) | 64Cu(I) | 67Cu(I) |
|---|---|---|---|---|
| Adrenals | 0.0388 | 0.0525 | 0.0387 | 0.0517 |
| Brain | 0.011 | 0.0259 | 0.0106 | 0.0241 |
| Gallbladder wall | 0.0576 | 0.0763 | 0.0553 | 0.0729 |
| Large Intestine Wall | 0.244 | 0.477 | 0.264 | 0.488 |
| Small Intestine Wall | 0.17 | 0.331 | 0.184 | 0.339 |
| Stomach Wall | 0.164 | 0.303 | 0.165 | 0.307 |
| Heart Wall | 0.0896 | 0.204 | 0.0891 | 0.207 |
| Kidneys | 0.573 | 1.3 | 0.66 | 1.46 |
| Liver | 0.514 | 1.03 | 0.466 | 0.947 |
| Lungs | 0.0872 | 0.175 | 0.0949 | 0.193 |
| Muscle | 0.0104 | 0.0127 | 0.0106 | 0.0128 |
| Pancreas | 0.174 | 0.38 | 0.197 | 0.397 |
| Red Marrow | 0.0164 | 0.0219 | 0.0172 | 0.0209 |
| Osteogenic Cells | 0.02 | 0.05 | 0.0216 | 0.0306 |
| Skin | 0.00818 | 0.0125 | 0.00865 | 0.0125 |
| Spleen | 0.121 | 0.251 | 0.0897 | 0.189 |
| Testes | 0.00687 | 0.0112 | 0.00764 | 0.0114 |
| Thymus | 0.0112 | 0.017 | 0.0117 | 0.017 |
| Thyroid | 0.00634 | 0.0111 | 0.00697 | 0.0112 |
| Bladder Wall | 0.0121 | 0.0178 | 0.0132 | 0.0181 |
| Uterus | 0.0185 | 0.0259 | 0.02 | 0.0263 |
| Total Body | 0.0329 | 0.0611 | 0.0329 | 0.06 |
| (ID/g·h) | 64 Cu(II) | 67 Cu(II) | 64 Cu(I) | 67 Cu(I) |
| Tumor | 1.621 | 2.695 | 1.808 | 2.971 |
Discussioin
Copper has many important biological roles in vivo, such as electron transfer, catalysis, and structural shaping2. Many copper-containing compounds are biologically active, and have anti-inflammatory and anti-proliferative properties24, 25. On the other hand, Cu can be toxic because of its ability to generate reactive dioxygen species by cycling between Cu(I) and Cu(II) under physiological conditions26. Therefore, Cu homeostasis is tightly regulated by the delicate and complex network in vivo of influx copper transporter (CTR1), efflux copper transporters (ATP7A and ATP7B), copper chaperons (ATOX1, Cox17, CCS), and other copper binding molecules27.
64Cu is a cyclotron-produced radionuclide with an intermediate half-life that decays by both β+ and β– emission, which makes it suitable for both PET imaging and radionuclide therapy of cancer28, 29. Traditionally, 64Cu(II) has been widely applied in radiolabeling small molecules, peptides, proteins, antibodies and nanoparticles through various biofunctional chelators, such as 1,4,7-triazacyclononane-1,4,7-triacetic acid (NOTA), 1,4,7,10-tetraazacyclododecane-N, N′, N″, N′″-tetraacetic acid (DOTA) and Triethylenetetramine (TETA), and AmBaSar, which have been proven to display in vivo good metabolism in animal models. Some of 64Cu(II) labeled probes have been translated into clinical applications, such as successfully using 64Cu-DOTATATE for imaging of human neuroendocrine tumors30. Recently, with the better understanding the role of CTR1 as a new biomarker for tumor, 64CuCl2 has been reported to be a novel and promising PET probe for imaging several types of cancers including melanoma, human head and neck cancer, and prostate cancer12, 22, 31, 32. However, previous reports indicate that CTR1 is the specific influx copper transporter for Cu(I)3, 23. In our previous study, melanoma cell lines B16F10 as well as A375M displayed high level of CTR1 expression, which could be clearly visible by 64CuCl2 PET imaging12. Thus, in this study, both B16F10 and A375M cell lines were continued to use for evaluation of 64Cu(I) probe.
It is reported that with the existence of antioxidants VitC or DTT, 64Cu(II) can be reduced to 64Cu(I)33–36. Compared with 64Cu(II) uptake by melanoma cell lines, both B16F10 and A375M showed significantly higher 64Cu(I) uptake (P < 0.05). Wang C et al. reported 64Cu(II) was also reduced to 64Cu(I) under the existence of both DTT and cysteine, which could help the cell uptake of 64Cu via CTR134. Interestingly, obvious decreasing cell uptake of copper radioactivity was observed in our study, which may be caused by different tumor cell lines used in different studies. The cell efflux of radioactive copper was further studied in our study. There was small difference of cellular retention of 64Cu between 64Cu(II) and 64Cu(I), and this observation could be attributed to that the cellular efflux of copper was mainly mediated by copper transporters (ATPases)27, 37, 38. ATPases, ATP7A and ATP7B, translocate to the cell membrane and function as efflux pumps to excrete copper from cytosol.
B16F10 tumor-bearing mice were well visualized by small animal PET at 1 h after the intravenous administration of 64Cu(II) or 64Cu(I) via tail vein. Although 64Cu was existed in the form of 64Cu(I) under the conditions mixed with VitC in vitro, the quick changing from unstable Cu(I) to stable Cu(II) could happen because of the dilution of VitC, and next oxidation reaction under physiological conditions in vivo 2, 5. Therefore, overall, the results of PET image quantitative analysis of 64Cu radioactivity in tumor and other normal tissues of 64Cu(I) were highly similar to those of 64Cu(II). In addition, the biodistribution data for both 64Cu(II) and 64Cu(I), in general, agreed well with the small animal PET quantification results. Moreover, for A375M tumor-bearing mice, the PET images and biodistribution results of 64Cu(II) and 64Cu(I) were similar.
Considering the combination therapy with imaging, the radiation absorbed dose distribution of 64Cu(I/II) and 67Cu(I/II) in a human adult male was analyzed in this study. For 64/67Cu(II/I), theoretical radiation absorbed dose distributions in major organs of a human adult male further suggest that the melanoma have high radiation absorbed dose. However, because of the high accumulation of copper in normal organs, such as liver and kidney, and high costs of this kind of radionuclide, 64/67Cu could not be recommended for melanoma therapy use unless targeted therapy can be great potentials if with good ideas. It also should be noted that this dose calculation does not mean the exactly same dose distribution results in patient studies. The real patient-specific dosimetry needs to be performed in patient studies.
In conclusion, compared with 64Cu(II), 64Cu(I) exhibited higher cellular uptake by melanoma, which further testified CTR1 specially influx of Cu(I). However, due to oxidation reaction in vivo, no significant difference between 64Cu(I) and 64Cu(II) was observed through PET images and biodistribution. The in vivo stability of 64Cu(I) should be further studied to evaluate it as a PET imaging radiotracer.
Materials and Methods
Reagents and Cell Culture
64CuCl2 was purchased from the Department of Medical Physics, University of Wisconsin at Madison (Madison, WI). The pH was adjusted to 7.0 and 64CuCl2 solution was diluted with phosphate-buffered saline (PBS) buffer (PBS, 0.01 M, pH 7.4). Sodium L-ascorbate (VitC), DL-dithiothreitol (DTT, >99%), cysteine, and copper(II) chloride (CuCl2) (97%) were purchased from Sigma-Aldrich (St. Louis, MO).
B16F10 murine melanoma cells and A375M human melanoma cells were obtained from American Type Culture Collection (Manassas, VA), and cultured in Dulbecco’s modified Eagle’s high-glucose medium (DMEM) supplemented with 10% fetal bovine serum (FBS) and 1% penicillin-streptomycin (P/S). The cells were maintained at 37 °C in a humidified 95% air and 5% CO2 incubator.
In Vitro Cell uptake and Efflux Studies
Cell uptake and efflux studies were performed on B16F10 and A375M cells, respectively. Briefly, melanoma cells (0.3 × 10⁶ per well, triplicate for each group) were plated in 12-well plates and incubated at 37 °C overnight. The cells were then incubated for various times (0.5, 1, 2 and 4 h) at 37 °C with 37 KBq (1 μCi) 64CuCl2, 37 KBq (1 μCi) 64CuCl [prepared by 64CuCl2 with VitC (2.5 mM)], 37 KBq (1 μCi) 64CuCl [prepared by 64CuCl2 with and DTT (2.5 mM)], and 37 KBq (1 μCi) 64CuCl [prepared by 64CuCl2 with DTT (2.5 mM) and cysteine (20 mM)] in serum-free medium, respectively. Due to much excess of VitC, DTT or cysteine, Cu(II) could be instantaneously reduced to Cu(I) at the moment of the mixed together and be maintained the reduction statement. Moreover, non-radioactive Cu(II/I) (20 nmol/mL, 0.5 mL per well) was added to block the uptake of 64Cu radioactivity in the blocking groups. At designated time points, radioactive medium was aspirated and cells were washed 3 times with ice-cold PBS and lysed with 0.1 M NaOH for 5 min at room temperature. The radioactivity of the cell lysates was counted by a Wallac 1480 automated γ-counter (PerkinElmer, Waltham, MA, USA).
For efflux studies, cells were initially incubated with 64CuCl2 or 64CuCl (prepared by reducing 64CuCl2 with VitC) for 2 h under the conditions described above, respectively. Then radioactive medium was aspirated and the cells were washed 3 times with PBS buffer. Fresh medium was added and cells were maintained at 37 °C. At different time points (0.5, 1, 2, 4, 16 and 24 h), the supernatant and cell lysate were collected separately and their radioactivity was counted. Cellular retention was calculated by dividing the radioactivity of the cells by the total radioactivity added into the cells at 0 h.
Subcutaneous Tumor Model
Female C57BL/6 mice and female athymic nude mice (nu/nu) were purchased from Charles River Laboratories (Boston, MA, USA) at 5–6 weeks old and kept under sterile conditions. About 3 × 10⁶ B16F10 and 1 × 10⁷ A375M cells suspended in 100 μL of PBS were implanted subcutaneously into the right shoulders of C57BL/6 mice and nude mice, respectively. Tumors were grown to a size of 0.5–1 cm in diameter (2–4 weeks). All animal experiments were performed under the approval of Stanford University’s Administrative Panel on Laboratory Animal Care (APLAC). All methods were carried out in accordance with relevant guidelines and regulations.
Small Animal PET Imaging
PET of tumor-bearing mice was performed using a small animal PET scanner (Siemens Invenon). B16F10 tumor-bearing mice (n = 4 for each group) were injected via the tail vein with 2.96–3.33 MBq (80–90 μCi) 64CuCl2 and 2.96–3.33 MBq (80–90 μCi) 64CuCl (prepared by 64CuCl2 with VitC (2.5 mM)], respectively. At 1, 2, 4, 24, 48 and 72 h post-injection (p.i.), mice were anesthetized with 2% isoflurane (5% for induction and 2% for maintenance in 100% O2) for imaging experiments. With the help of a laser beam attached to the scanner, the mice were placed in the prone position and near the center of the field of view of the scanner. Static scans at 24, 48 and 72 h after injection (scanning time, 10 min) and at other time points (scanning time, 5 min) were obtained. The images were reconstructed with two-dimensional ordered-subset expectation maximization (OSEM 2D) algorithm. The method for quantification analysis of small-animal PET images was the same as previously reported39. Small Animal PET Imaging and quantification analysis of mice bearing A375M tumors was similar to that of B16F10.
Biodistribution Studies
Anesthetized B16F10 tumor-bearing mice (n = 4 for each group) were injected with approximately 64CuCl2 (2.96–3.33 MBq [80–90 μCi]) and 64CuCl (prepared by adding 2.96–3.33 MBq [80–90 μCi] 64CuCl2 with VitC (2.5 mM)], respectively, via the tail vein and sacrificed at different time points from 1 to 72 h p.i. Tumor and normal tissues of interest (blood, muscle, heart, liver, lungs, kidneys, spleen, brain, intestine, skin, stomach, pancreas and so on) were removed and weighed, and their radioactivity levels were measured with a γ-counter. The radioactivity uptake in the tumor and normal tissues was expressed as a percentage of the injected radioactive dose per gram of tissue (%ID/g).
Similar to the biodistribution in B16F10 tumor-bearing mice, A375M tumor-bearing mice (n = 4 for each group) were injected with approximately 64CuCl2 (2.96–3.33 MBq [80–90 μCi]), and 64CuCl2 [prepared by adding 2.96–3.33 MBq [80–90 μCi] 64CuCl2 with Vit C (2.5 mM)], respectively, via the tail vein and sacrificed at 72 h p.i.
Radiation Absorbed Dose Calculation
To evaluate the possibly clinical application in future, radiation absorbed dose distribution of 64Cu(I/II) in a human adult male studied within a 48-h period was calculated based on mice models with B16F10 tumor, using OLINDA/EXM (RADAR, Vanderbilt University, Nashville, TN, USA) software code based on the same % injection dose (ID)/organ40. In brief, the accumulated activity in each organ (%ID × time) from 0 to 48 h was obtained by calculating the area under the %ID-time curve. Percent ID in each organ was decay-corrected before the application for accumulated activity calculation. The number of disintegrations in each major organ, (cumulated activity in %ID × h)/100, then was input into OLINDA/EXM software for radiation absorbed dose calculation. Moreover, the radiation absorbed dose distribution of 67Cu(I/II) in a human adult male was also analyzed on the basis of 64Cu(I/II) data.
Statistical Analysis
SPSS 18.0 software for Windows (SPSS Inc, Chicago) was used for statistical analysis. The quantitative data were expressed as mean ± SD, and analyzed and compared using the Student t test. The 95% confidence level was chosen to determine the significance between groups, with P < 0.05 indicating a significant difference.
Acknowledgements
This work was supported, in part, by the Office of Science (BER), U.S. Department of Energy (DE-SC0008397), NCI In Vivo Cellular Molecular Imaging Center (ICMIC) grant P50 CA114747, National Science Foundation for Scholars of China (Grant No. 81571703), and funding sponsored by Shanghai Pujiang Talent Program (Grant No. 2015PJD006) and Zhongshan Hospital Outstanding Youth Talent Program (Grant No. 2015ZSYXQN17).
Author Contributions
Lei Jiang, Yingfeng Tu, Xiang Hu, Hao Chen, Xiaowei Ma carried out experiments. Tim Doyle helped small animal PET experiment. Ande Bao did the calculation of radiation absorbed dose distribution in human. Lei Jiang wrote the manuscript. Zhen Cheng and Hongcheng Shi commented the manuscript.
Competing Interests
The authors declare that they have no competing interests.
Footnotes
Publisher's note: Springer Nature remains neutral with regard to jurisdictional claims in published maps and institutional affiliations.
Contributor Information
Hongcheng Shi, Email: shi.hongcheng@zs-hospital.sh.cn.
Zhen Cheng, Email: zcheng@stanford.edu.
References
- 1.Linder MC, Hazegh-Azam M. Copper biochemistry and molecular biology. The American journal of clinical nutrition. 1996;63:797S–811S. doi: 10.1093/ajcn/63.5.797. [DOI] [PubMed] [Google Scholar]
- 2.Puig S, Thiele DJ. Molecular mechanisms of copper uptake and distribution. Current opinion in chemical biology. 2002;6:171–180. doi: 10.1016/S1367-5931(02)00298-3. [DOI] [PubMed] [Google Scholar]
- 3.Tsigelny IF, et al. An all-atom model of the structure of human copper transporter 1. Cell biochemistry and biophysics. 2012;63:223–234. doi: 10.1007/s12013-012-9358-x. [DOI] [PMC free article] [PubMed] [Google Scholar]
- 4.Ruiz LM, et al. Non-cytotoxic copper overload boosts mitochondrial energy metabolism to modulate cell proliferation and differentiation in the human erythroleukemic cell line K562. Mitochondrion. 2016;29:18–30. doi: 10.1016/j.mito.2016.04.005. [DOI] [PubMed] [Google Scholar]
- 5.Sharp PA. Ctr1 and its role in body copper homeostasis. The international journal of biochemistry & cell biology. 2003;35:288–291. doi: 10.1016/S1357-2725(02)00134-6. [DOI] [PubMed] [Google Scholar]
- 6.Schwab S, Shearer J, Conklin SE, Alies B, Haas KL. Sequence proximity between Cu(II) and Cu(I) binding sites of human copper transporter 1 model peptides defines reactivity with ascorbate and O2. Journal of inorganic biochemistry. 2016;158:70–76. doi: 10.1016/j.jinorgbio.2015.12.021. [DOI] [PMC free article] [PubMed] [Google Scholar]
- 7.Theophanides T, Anastassopoulou J. Copper and carcinogenesis. Critical reviews in oncology/hematology. 2002;42:57–64. doi: 10.1016/S1040-8428(02)00007-0. [DOI] [PubMed] [Google Scholar]
- 8.Turski ML, Thiele DJ. New roles for copper metabolism in cell proliferation, signaling, and disease. The Journal of biological chemistry. 2009;284:717–721. doi: 10.1074/jbc.R800055200. [DOI] [PMC free article] [PubMed] [Google Scholar]
- 9.Zatulovskaia YA, Ilyechova EY, Puchkova LV. The Features of Copper Metabolism in the Rat Liver during Development. PloS one. 2015;10:e0140797. doi: 10.1371/journal.pone.0140797. [DOI] [PMC free article] [PubMed] [Google Scholar]
- 10.Cai H, et al. Reduced 64Cu uptake and tumor growth inhibition by knockdown of human copper transporter 1 in xenograft mouse model of prostate cancer. Journal of nuclear medicine: official publication, Society of Nuclear Medicine. 2014;55:622–628. doi: 10.2967/jnumed.113.126979. [DOI] [PMC free article] [PubMed] [Google Scholar]
- 11.Holzer AK, et al. Expression of the human copper influx transporter 1 in normal and malignant human tissues. The journal of histochemistry and cytochemistry: official journal of the Histochemistry Society. 2006;54:1041–1049. doi: 10.1369/jhc.6A6970.2006. [DOI] [PubMed] [Google Scholar]
- 12.Qin C, et al. Theranostics of malignant melanoma with 64CuCl2. Journal of nuclear medicine: official publication, Society of Nuclear Medicine. 2014;55:812–817. doi: 10.2967/jnumed.113.133850. [DOI] [PMC free article] [PubMed] [Google Scholar]
- 13.Wachsmann J, Peng F. Molecular imaging and therapy targeting copper metabolism in hepatocellular carcinoma. World journal of gastroenterology. 2016;22:221–231. doi: 10.3748/wjg.v22.i1.221. [DOI] [PMC free article] [PubMed] [Google Scholar]
- 14.Cai Z, Anderson CJ. Chelators for copper radionuclides in positron emission tomography radiopharmaceuticals. Journal of labelled compounds & radiopharmaceuticals. 2014;57:224–230. doi: 10.1002/jlcr.3165. [DOI] [PMC free article] [PubMed] [Google Scholar]
- 15.Williams HA, Robinson S, Julyan P, Zweit J, Hastings D. A comparison of PET imaging characteristics of various copper radioisotopes. European journal of nuclear medicine and molecular imaging. 2005;32:1473–1480. doi: 10.1007/s00259-005-1906-9. [DOI] [PubMed] [Google Scholar]
- 16.Novak-Hofer I, Schubiger PA. Copper-67 as a therapeutic nuclide for radioimmunotherapy. European journal of nuclear medicine and molecular imaging. 2002;29:821–830. doi: 10.1007/s00259-001-0724-y. [DOI] [PubMed] [Google Scholar]
- 17.Zhang T, et al. PET with 62Cu-ATSM and 62Cu-PTSM is a useful imaging tool for hypoxia and perfusion in pulmonary lesions. AJR. American journal of roentgenology. 2013;201:W698–706. doi: 10.2214/AJR.12.9698. [DOI] [PMC free article] [PubMed] [Google Scholar]
- 18.Wong TZ, et al. PET of hypoxia and perfusion with 62Cu-ATSM and 62Cu-PTSM using a 62Zn/62Cu generator. AJR. American journal of roentgenology. 2008;190:427–432. doi: 10.2214/AJR.07.2876. [DOI] [PMC free article] [PubMed] [Google Scholar]
- 19.Smith NA, Bowers DL, Ehst DA. The production, separation, and use of 67Cu for radioimmunotherapy: a review. Applied radiation and isotopes: including data, instrumentation and methods for use in agriculture, industry and medicine. 2012;70:2377–2383. doi: 10.1016/j.apradiso.2012.07.009. [DOI] [PubMed] [Google Scholar]
- 20.Qaim SM. Decay data and production yields of some non-standard positron emitters used in PET. Q J Nucl Med Mol Imaging. 2008;52:111–120. [PubMed] [Google Scholar]
- 21.Smith SV. Molecular imaging with copper-64 in the drug discovery and development arena. Expert opinion on drug discovery. 2007;2:659–672. doi: 10.1517/17460441.2.5.659. [DOI] [PubMed] [Google Scholar]
- 22.Zhang H, Cai H, Lu X, Muzik O, Peng F. Positron emission tomography of human hepatocellular carcinoma xenografts in mice using copper (II)-64 chloride as a tracer with copper (II)-64 chloride. Academic radiology. 2011;18:1561–1568. doi: 10.1016/j.acra.2011.08.006. [DOI] [PMC free article] [PubMed] [Google Scholar]
- 23.Lee J, Pena MM, Nose Y, Thiele DJ. Biochemical characterization of the human copper transporter Ctr1. The Journal of biological chemistry. 2002;277:4380–4387. doi: 10.1074/jbc.M104728200. [DOI] [PubMed] [Google Scholar]
- 24.Tardito S, Marchio L. Copper compounds in anticancer strategies. Current medicinal chemistry. 2009;16:1325–1348. doi: 10.2174/092986709787846532. [DOI] [PubMed] [Google Scholar]
- 25.Iakovidis I, Delimaris I, Piperakis SM. Copper and its complexes in medicine: a biochemical approach. Molecular biology international. 2011;2011:594529–13. doi: 10.4061/2011/594529. [DOI] [PMC free article] [PubMed] [Google Scholar]
- 26.Lutsenko S. Human copper homeostasis: a network of interconnected pathways. Current opinion in chemical biology. 2010;14:211–217. doi: 10.1016/j.cbpa.2010.01.003. [DOI] [PMC free article] [PubMed] [Google Scholar]
- 27.Bryan JN, et al. Comparative uptakes and biodistributions of internalizing vs. noninternalizing copper-64 radioimmunoconjugates in cell and animal models of colon cancer. Nuclear medicine and biology. 2005;32:851–858. doi: 10.1016/j.nucmedbio.2005.05.006. [DOI] [PubMed] [Google Scholar]
- 28.Cutler CS, et al. Labeling and in vivo evaluation of novel copper(II) dioxotetraazamacrocyclic complexes. Nuclear medicine and biology. 2000;27:375–380. doi: 10.1016/S0969-8051(00)00101-3. [DOI] [PubMed] [Google Scholar]
- 29.Pfeifer A, et al. Clinical PET of neuroendocrine tumors using 64Cu-DOTATATE: first-in-humans study. Journal of nuclear medicine: official publication, Society of Nuclear Medicine. 2012;53:1207–1215. doi: 10.2967/jnumed.111.101469. [DOI] [PubMed] [Google Scholar]
- 30.Wang H, Chen X. Visualization of copper metabolism by 64CuCl(2)-PET. Molecular imaging and biology: MIB: the official publication of the Academy of Molecular Imaging. 2012;14:14–16. doi: 10.1007/s11307-011-0483-5. [DOI] [PMC free article] [PubMed] [Google Scholar]
- 31.Peng F, Lu X, Janisse J, Muzik O, Shields AF. PET of human prostate cancer xenografts in mice with increased uptake of 64CuCl2. Journal of nuclear medicine: official publication, Society of Nuclear Medicine. 2006;47:1649–1652. [PubMed] [Google Scholar]
- 32.Li F, Jorgensen JT, Forman J, Hansen AE, Kjaer A. 64Cu-ATSM Reflects pO2 Levels in Human Head and Neck Cancer Xenografts but Not in Colorectal Cancer Xenografts: Comparison with 64CuCl2. Journal of nuclear medicine: official publication, Society of Nuclear Medicine. 2016;57:437–443. doi: 10.2967/jnumed.115.155663. [DOI] [PubMed] [Google Scholar]
- 33.Thiel K, Klamroth T, Strauch P, Taubert A. On the interaction of ascorbic acid and the tetrachlorocuprate ion [CuCl4]2- in CuCl nanoplatelet formation from an ionic liquid precursor (ILP) Physical chemistry chemical physics: PCCP. 2011;13:13537–13543. doi: 10.1039/c1cp20648f. [DOI] [PubMed] [Google Scholar]
- 34.Wang C, et al. Fluorescence sensor for Cu(II) in the serum sample based on click chemistry. The Analyst. 2014;139:656–659. doi: 10.1039/C3AN01262J. [DOI] [PubMed] [Google Scholar]
- 35.Peng F, Lutsenko S, Sun X, Muzik O. Positron emission tomography of copper metabolism in the Atp7b −/− knock-out mouse model of Wilson’s disease. Molecular imaging and biology: MIB: the official publication of the Academy of Molecular Imaging. 2012;14:70–78. doi: 10.1007/s11307-011-0476-4. [DOI] [PMC free article] [PubMed] [Google Scholar]
- 36.Glaser M, Arstad E. “Click labeling” with 2-[18f]fluoroethylazide for positron emission tomography. Bioconjugate chemistry. 2007;18:989–993. doi: 10.1021/bc060301j. [DOI] [PubMed] [Google Scholar]
- 37.Gonzalez-Guerrero M, Raimunda D, Cheng X, Arguello JM. Distinct functional roles of homologous Cu+ efflux ATPases in Pseudomonas aeruginosa. Molecular microbiology. 2010;78:1246–1258. doi: 10.1111/j.1365-2958.2010.07402.x. [DOI] [PubMed] [Google Scholar]
- 38.Hueting R. Radiocopper for the imaging of copper metabolism. Journal of labelled compounds & radiopharmaceuticals. 2014;57:231–238. doi: 10.1002/jlcr.3155. [DOI] [PubMed] [Google Scholar]
- 39.Jiang L, et al. Evaluation of a (64)Cu-labeled cystine-knot peptide based on agouti-related protein for PET of tumors expressing alphavbeta3 integrin. Journal of nuclear medicine: official publication, Society of Nuclear Medicine. 2010;51:251–258. doi: 10.2967/jnumed.109.069831. [DOI] [PMC free article] [PubMed] [Google Scholar]
- 40.Stabin MG, Sparks RB, Crowe E. OLINDA/EXM: the second-generation personal computer software for internal dose assessment in nuclear medicine. Journal of nuclear medicine: official publication, Society of Nuclear Medicine. 2005;46:1023–1027. [PubMed] [Google Scholar]