Intra- and intersubject variability are significant and different at various sites within the contractile pharynx. In addition, significant swallow-to-swallow and subject-to-subject variability exists in pharyngeal contractile integral. The range of intrasubject variability indicates the existence of broad operational range and reserve. Lastly, our variability studies informed Monte Carlo and power analyses, yielding estimates of sample size that would ensure accurate representation of pressure metric variability.
Keywords: high-resolution pharyngeal manometry, swallowing, dysphagia, estimated optimal sample size for pharyngeal pressure metrics
Abstract
The present understanding of pharyngeal motor function remains incomplete. Among the remaining gaps of knowledge in this regard is the magnitude of variability of pharyngeal peristaltic pressure amplitude. Although variability can pose difficulty in interpretation of manometric findings, its magnitude can inform the operational range and reserve of the pharyngeal contractile function. We aimed to define the intra- and intersubject and intersession variability of select pharyngeal manometric parameters and, using this information, determine the number of swallow repetitions for acquiring reliable pharyngeal manometric data. We recorded pharyngeal peristalsis in 10 healthy subjects (age: 50 ± 25 yr, 5 women) by high-resolution manometry during two separate sessions of 20 sequences of 0.5-ml water swallows. Two-way ANOVA showed significant variation in the mean peak peristaltic pressure value across sites (P < 0.0001) as well as within the data at each site (P < 0.0001). Similarly, the pharyngeal contractile integral exhibited significant inter- (P = 0.003) and intrasubject (P < 0.001) variability. The Shapiro-Wilk normality test showed mixed results, in that some sites showed normally distributed data, whereas others did not. A robust Monte Carlo simulation showed that the nominal sample size was different for various tested metrics. For a power of 0.8, commonly accepted as an adequate threshold for acceptable statistical power, the optimal sample size for various peristaltic parameters ranged between 3 and 15. There is significant intra- and intersubject variability in site-specific and integrated parameters of pharyngeal peristalsis. The observed variance indicates a significant operational range and reserve in pharyngeal contractile function while necessitating parameter-specific sample size for reliable results.
NEW & NOTEWORTHY Intra- and intersubject variability are significant and different at various sites within the contractile pharynx. In addition, significant swallow-to-swallow and subject-to-subject variability exists in pharyngeal contractile integral. The range of intrasubject variability indicates the existence of broad operational range and reserve. Lastly, our variability studies informed Monte Carlo and power analyses, yielding estimates of sample size that would ensure accurate representation of pressure metric variability.
understanding of pharyngeal motor function is still evolving. Normal pharyngeal motor function plays a crucial role in prevention of postdeglutitive residue and aspiration by adequately transporting the arriving oral bolus into the esophagus. Despite this important function, reports of manometric pharyngeal motility data in health and disease have remained sparse. The major reason for this shortcoming has been that, until recently, quantitative evaluation of pharyngeal peristalsis across the entire length of the pharynx by manometric techniques has been suboptimal because of limitations of pressure-measuring devices unable to reliably record the rapid, radially, and axially asymmetric pressure transients of the pharynx (3, 14). However, recent technological advances have overcome these shortcomings by providing circumferential recording ability, acceptable rise rate, and ease of catheter positioning and displaying sophisticated data from a large number of narrowly spaced sensors on the same catheter assembly capable of covering the entire length of the pharynx (2). These advances have renewed interest in quantitative, manometric evaluation of the pharynx and have spurred a limited number of studies using high-resolution manometry (HRM), which incorporate these new technological advances (5–7, 9, 11–13, 18, 19). Despite this progress, our understanding of pharyngeal deglutitive pressure phenomena remains incomplete. Among the remaining gaps of knowledge in this regard is the magnitude of variability of pharyngeal deglutitive contractions. Although variability of pharyngeal peristalsis can pose difficulty in interpretation of manometric findings, its magnitude can inform the operational range and reserve of the pharyngeal contractile function. This information not only adds to our understanding of the deglutitive physiology of the pharynx, but also it has clinical ramifications in terms of better understanding of tolerance of the negative impact of diseases affecting the pharyngeal function. For this reason, the aims of the present study were to define the intra- and intersubject and intersession variability of select pharyngeal manometric parameters and, using this information, determine the number of swallow repetitions for acquiring reliable pharyngeal manometric data.
METHODS
We studied 10 healthy subjects (age: 50 ± 25 yr, 5 women) by recording intraluminal pressure in the pharynx, upper esophageal sphincter (UES), and proximal esophagus during a total of 40 repetitions of 0.5-ml room temperature water swallows within each subject. Studies were approved by the internal review board of the Human Research Protection Program at the Medical College of Wisconsin, Milwaukee, Wisconsin. All participants gave written, informed consent before their studies.
Experimental procedures.
Pharyngeal pressure was monitored using a high-resolution (HR) manometric catheter positioned transnasally to traverse the pharynx, UES, and proximal esophagus. The HR probe and computerized recording and analysis system (ManoScan and ManoView Systems; Given Imaging, Duluth, GA) stores pressure data from 36 pressure sensors (1-cm sensor spacing) on the HR probe, displays the manometric information in topographic or line graph formats, and provides postacquisition analytic tools for parameterization of temporal and spatial pressure data.
All subjects were seated in an upright position for the duration of the study. The subjects were verbally cued to perform 20 consecutive swallows of 0.5 ml of room temperature water (session 1). We chose swallowing of 0.5 ml to prevent development of dry mouth known to negatively affect swallowing. We did not test other volumes to limit study duration, subject fatigue, and inability to complete the experiment. There was a 20-s interval between swallows wherein the subject refrained from swallowing. The water bolus was slowly injected into the oral cavity by a syringe, and the subject was then cued to swallow the water in a single swallow. After a 20-min rest period, another 20 swallows (session 2) with 20-s intervals between swallows were recorded. During the 20-min rest period, subjects remained seated with the manometric catheter in place and were told to relax and swallow ad libitum.
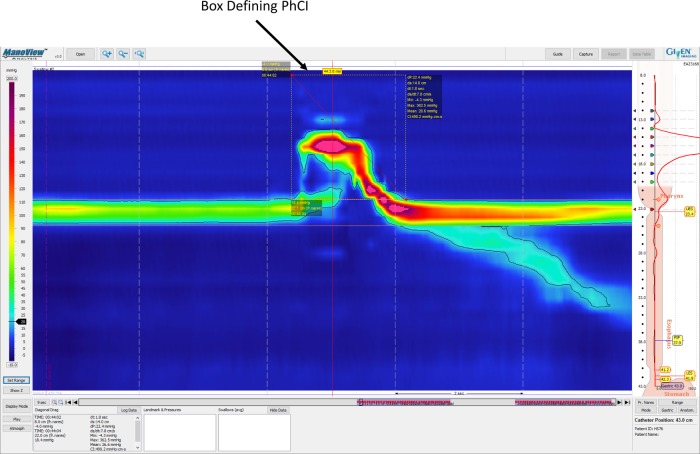
Several manometric parameters were measured and analyzed for each swallow. Peak deglutitive peristaltic wave pressures were measured at positions 2, 3, 4, 5, 6, 7, and 8 cm above the upper margin of the manometrically determined UES. Additionally, a parameter derived from the ManoView analysis software, the pharyngeal contractile integral (PhCI), was measured. The PhCI was calculated using the “SmartMouse” feature of the ManoView software. The contractile integral technique has been used in the distal esophagus as a metric of “contractile vigor” (10) by multiplying the mean pressure amplitude by the contraction duration by the length of the region of interest. In the ManoView software topographic display using the computer’s mouse, the contractile integral is calculated by scrolling out an area in the topographic display delineating a space-time box and logging the displayed contractile integral value (Fig. 1). For the purposes of our analysis, with the isobaric contour set at 20 mmHg, the PhCI was characterized by circumscribing a space-time box in the topographic ManoView display to surround the pharyngeal deglutitive pressure recording with the upper margin of the box at the most proximal probe sensor at a time just before deglutition-induced contraction and the distal margin of the box at the predetermined upper margin of the UES high-pressure zone (UESHPZ) at the time of return of the HPZ to its resting manometric profile.
Fig. 1.
Schematic showing the position of the contractile integral (CI) region outlined on a manometric isocontour map in the ManoView software display. The margins of the upper esophageal sphincter high-pressure zone (UESHPZ) are delineated by the 20-mmHg isobar and marked by the software-generated horizontal lines. Furthermore, the CI box has been drawn around the pharyngeal swallow-related manometric complex such that the upper border of the box is at level of the most orad pressure sensor and the lower border is at the level of the 20-mmHg isobar UESHPZ boundary. The left border of the CI box is just before the initial swallow-related pressure rise in the most orad pressure sensors, and the right border of the box is at the instant the 20-mmHg isobar crosses the upper margin of the UESHPZ after the pharyngeal swallow-related pressure complex is completed.
Statistical analyses.
Within- and between-subject effects were tested using ANOVA for parametric data sets and Friedman’s test for nonparametric data sets. The Shapiro-Wilk test was used to determine whether a set of sample data likely came from a normally distributed population. Analysis to determine the optimum sample size for various measured parameters was accomplished using Monte Carlo simulations that randomly sampled subsets of the acquired data sets and performing the F-test to determine whether the subsample had significantly different dispersion than the larger set of sampled data.
In addition to testing the difference in the mean or median of the sampled data, the dispersion of the collected data was also tested to determine potential differences in the variability of the sitewise and integrated pressure data. The metrics for dispersion were the standard deviation (SD) and the coefficient of variation (CV). The CV is defined as the ratio of the SD divided by the mean and is a dimensionless metric parameterizing the variability relative to the mean.
RESULTS
All subjects tolerated the experiment well, and there were no complaints or complications attributable to the study procedures. The UESHPZ upper margin was defined by the 20-mmHg isobar shown on the manometric contour plot on the orad side of the pharyngo-esophageal HPZ, and all recording sites were referenced to this landmark.
ANOVA testing the potential differences between sessions 1 and 2 data for the peak peristaltic pressures at 2, 3, 4, 5, 6, 7, and 8 cm above the upper margin of the UESHPZ showed no significant differences between sessions 1 and 2 data. There was no significant sitewise difference between sessions 1 and 2 data (P = 0.40, ANOVA) for the average peak peristaltic pressures across subjects. Similarly, the SD and CV were not significantly different between the sessions among the pressure sites across subjects (P = 0.84 and P = 0.46, respectively). Because the two sessions showed no significant differences, in all subsequent analysis, we considered all 40 samples from each subject.
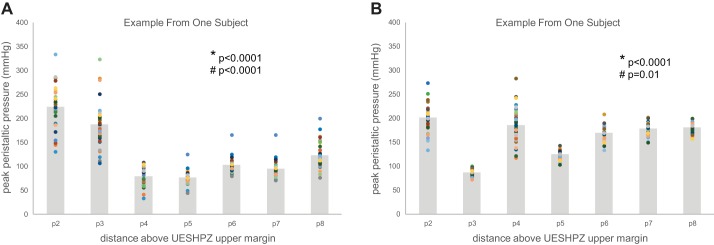
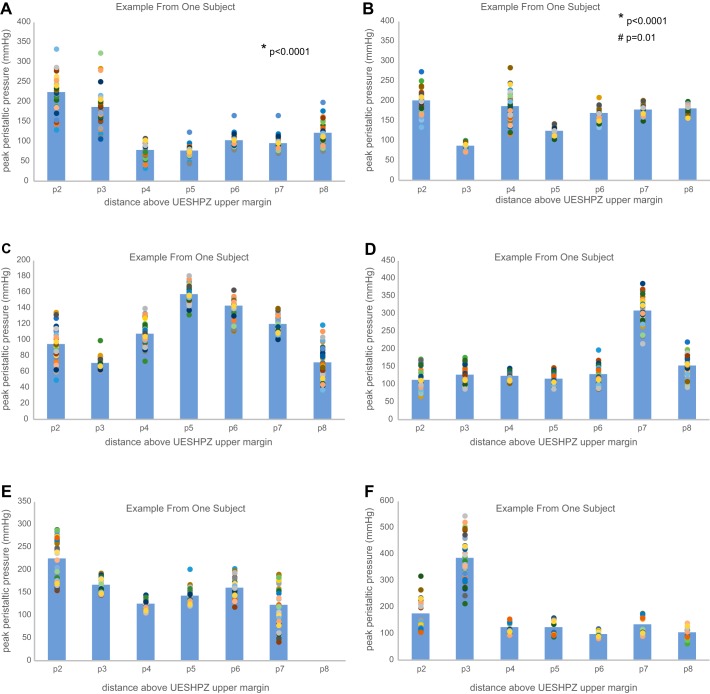
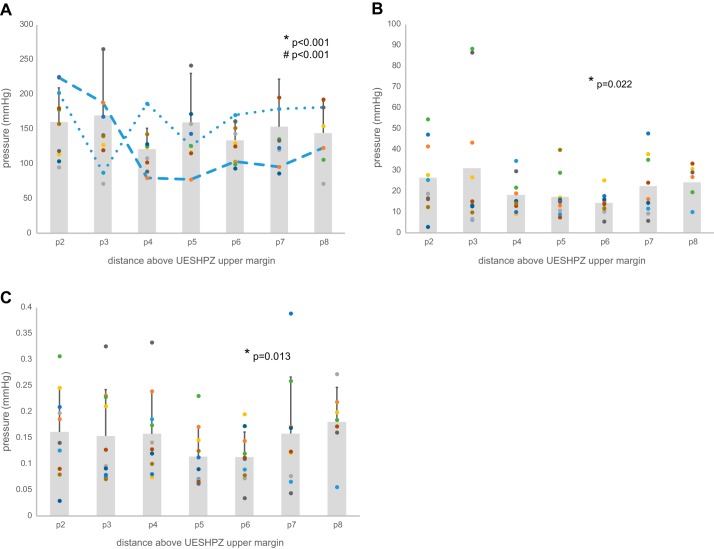
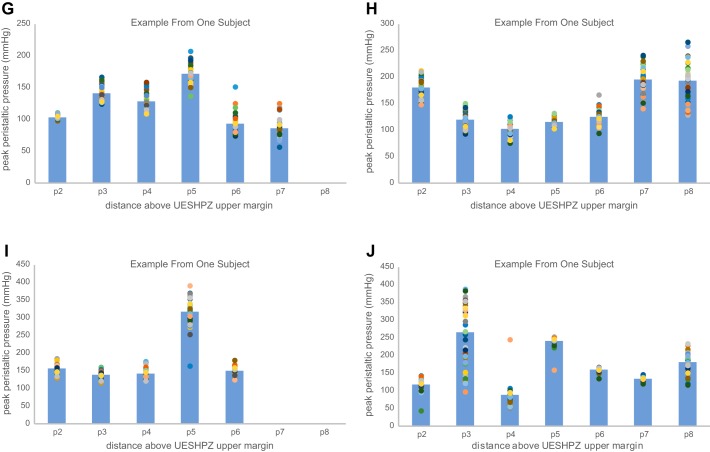
The effect of manometric site location proximal to the upper margin of UES on peak peristaltic wave pressure showed significant variability across all sites (2, 3, 4, 5, 6, 7, and 8 cm above the UES upper margin). As seen in an example from one subject in Fig. 2A, two-way variability analysis showed that there was significant variation in the mean peak peristaltic pressure value across the sites (*P < 0.0001) as well as significant variability within the data at each site (#P < 0.0001). Multiple sitewise comparisons showed that sites p4 and p5 were consistently different than all other peak pressure site measurements. Similar variability analysis in another subjects likewise showed significant differences across and within sites; however, the pattern of sitewise pressure was not consistent across subjects. Figure 2B shows an example peak pressure profile from a different subject wherein significant differences among sites are driven by much lower peak peristaltic pressures at site 3 and higher pressures almost everywhere else above the UES upper margin, whereas within-site variability was smaller at many sites. Additional individual subject examples are shown in Fig. 3, A–J, for all tested subjects. As a result of the variability within and between subjects as well as within and between sites, groupwise analysis showed significant differences in sitewise variation of the peak peristaltic pressure data (P < 0.001); however, the group average peak pressure profile data do not show a profound minimum peak pressure site because the location of that site may shift from subject to subject. As seen in Fig. 4A, combined data across all subjects showed a significant sitewise effect (*P < 0.001) as well as between-subject effect (#P < 0.001). (The dashed lines in the figure show the examples illustrated in Fig. 2 above.) The data in Fig. 4A also show potential differences in the degree of variability as a function of site; that is, the lengths of the SD error bars are not completely homogeneous (i.e., the same length) from site to site.
Fig. 2.
A: scattergram of site-specific peak peristaltic pressure at 2–8 cm proximal to the UESHPZ during swallowing 0.5 ml of water in a single subject. Scattergram points represent sitewise peak pressure in 40 swallows, and shaded bars represent the sitewise mean for all 40 swallows. There was significant variation in the mean peak peristaltic pressure value across the sites (*P < 0.0001) as well as significant variability within the data at each site (#P < 0.0001). Multiple sitewise comparisons showed that sites p4 and p5 were consistently different than all other peak pressure site measurements. B: scattergram of site-specific peak peristaltic pressure at 2–8 cm proximal to the UESHPZ during swallowing 0.5ml of water in a single subject. Scattergram points represent site-wise peak pressure in 40 swallows and gray boxes represent the site-wise mean for all 40 swallows. There was significant variation in the mean peak peristaltic pressure value across the sites (*P < 0.0001) as well as significant variability within the data at each site (#P < 0.01). Multiple sitewise comparisons showed that site p3 was consistently different than all other peak pressure site measurements. Also, within-site variability was inconsistent across sites.
Fig. 3.
A–J: scattergram of site-specific peak peristaltic pressure at 2–8 cm proximal to the UESHPZ during swallowing of 0.5 ml of water in each tested subject. Scattergram points represent sitewise peak pressure in 40 swallows, and shaded bars represent the sitewise mean for all 40 swallows.
Fig. 4.
A: as a result of the variability within and between subjects as well as within and between sites, groupwise analysis showed significant differences in sitewise variation of the peak peristaltic pressure data (P < 0.001); however, the group average peak pressure profile data do not show a profound minimum peak pressure site because the location of that site may shift from subject to subject. As seen, combined data across all subjects showed a significant sitewise effect (*P < 0.001) as well as between-subject effect (#P < 0.001). (The dashed lines in the figure show the examples illustrated in Fig. 2, A and B). B: there were significant differences in the standard deviation wherein between-site differences (*P = 0.022, Conover’s test) reveal greater variability very near (2 and 3 cm above the upper margin of the UESHPZ) and far away (7 and 8 cm from the UESHPZ) from the UES and lesser variability elsewhere. Scattergram points represent sitewise standard deviation of 40 swallows for each subject, and shaded bars represent the sitewise mean across all subjects. C: there were significant differences in the coefficient of variation wherein between-site differences (*P = 0.013, Conover’s test) reveal that the variability relative to the mean was greater near and further from the UES and lesser in the middle pressure measurement sites (sites p5 and p6). Scattergram points represent sitewise standard deviation of 40 swallows for each subject, and shaded bars represent the sitewise mean across all subjects.
Fig. 3.
Continued.
As stated above, the metrics for determining the dispersion of the data are the SD and the CV. There were significant differences in the SD, as seen in Fig. 4B, wherein between-site differences (P = 0.022, Conover’s test) reveal greater variability very near (2 and 3 cm above the upper margin of the UESHPZ) and far away (7 and 8 cm from the UESHPZ) from the UES and lesser variability elsewhere. Similar significant differences (P = 0.013) were seen for the CV data. As seen in Fig. 4C, the variability relative to the mean was greater near and further from the UES and lesser in the middle pressure measurement sites (sites p5 and p6).
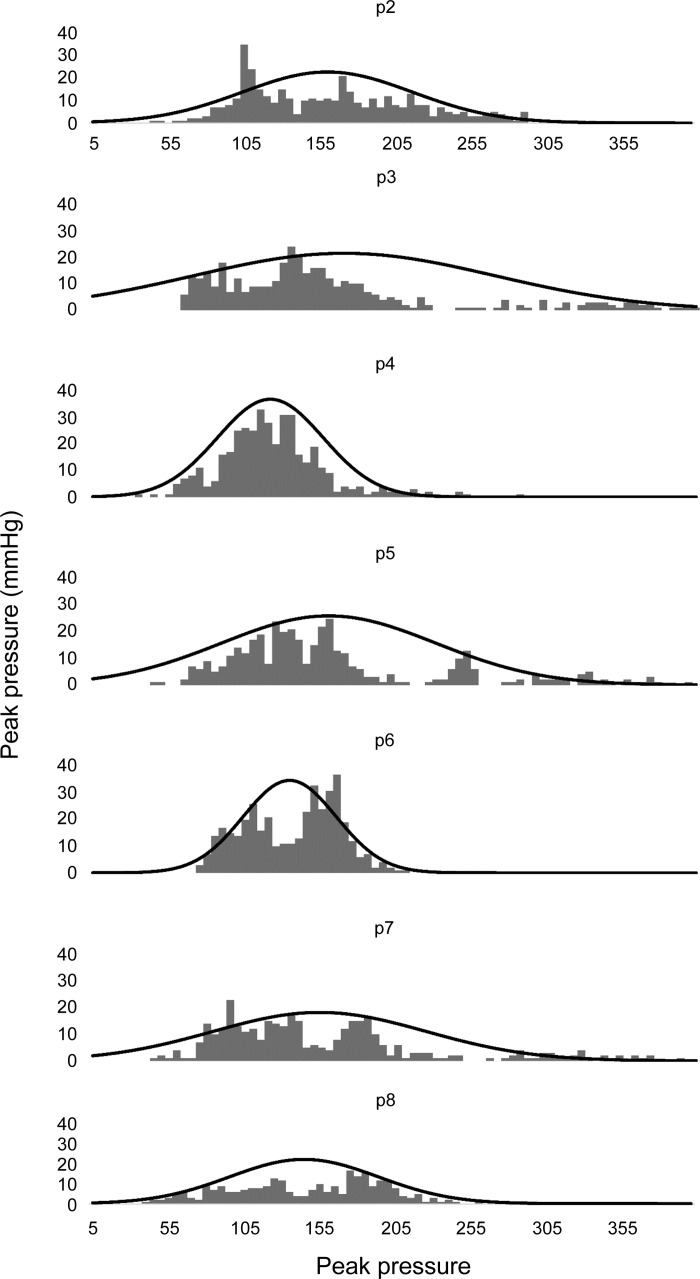
The use of metrics like SD and CV inherently assumes that the population of mean data are normally (or very nearly normally) distributed. This tacit assumption was tested using the Shapiro-Wilk test of normality, which showed mixed results in that some sites showed normally distributed data, whereas others did not. Table 1 shows a breakdown of peak pressure measurements that were normally distributed (“+”) compared with those that were likely not normally distributed (“−”). Although there was little consistent pattern across subjects for sites, which overwhelmingly showed nonnormality, sites p5 and p6 had the lowest percentage of normally distributed data, whereas site 8 showed consistently normal distributions of peak peristaltic pressure data within each tested subject. To further characterize the distribution and variability of the peak pressure data, Fig. 5 shows frequency histograms for all data in all subjects at each pressure site location above the UES. Superimposed on each frequency histograms in Fig 6 is the theoretical normal distribution with the same mean and SD as the histogram data.
Table 1.
Normal (+) or nonnormal (−) data distributions for pressure metrics in each subject
| Subject | p2 | p3 | p4 | p5 | p6 | p7 | p8 |
|---|---|---|---|---|---|---|---|
| 1 | + | + | + | + | + | + | + |
| 2 | + | − | + | − | − | − | + |
| 3 | + | − | + | + | − | + | + |
| 4 | − | + | + | − | + | + | + |
| 5 | − | + | + | − | + | − | |
| 6 | − | + | − | − | − | − | + |
| 7 | + | − | − | + | − | − | |
| 8 | + | + | + | + | + | + | + |
| 9 | − | − | − | − | − | + | + |
| 10 | + | + | + | − | + | ||
| %Subjects normally distributed | 60 | 60 | 70 | 40 | 50 | 56 | 100 |
Fig. 5.
Frequency histograms for all data in all subjects at each pressure site location above the UES. Superimposed on each frequency histograms are the theoretical normal distributions with the same mean and standard deviation as the histogram data. Given the disparate means and variances among subjects, the appearance of nonnormally distributed group data for some of the peak pressure sites is not entirely unexpected. For those sites showing groupwise nonnormal distributions, all are markedly skewed right; that is, these distributions show a significant number of observations with high peak peristaltic pressure measurements within and among healthy subjects.
Fig. 6.
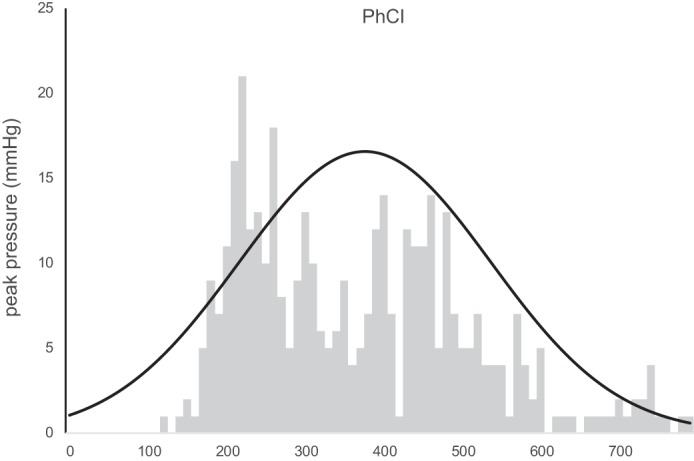
Distribution of the pharyngeal contractile integral (PhCI) data for 400 swallows in all subjects. These data showed normal distributions within 80% of subjects; however, the groupwise frequency plot shows a nonnormal distribution that is markedly skewed right, indicating the chance of measuring high values for PhCI within and among healthy subjects.
As an alternative to reporting multiple peak peristaltic pressure activity at individual sites above the UES, a single integrated space-time-pressure value was also recorded for each swallow (12, 18). The PhCI measurements showed no significant differences between sessions 1 and 2 values (P = 0.05); however, significant inter- (P = 0.003) and intrasubject (P < 0.001) variability was shown. Figure 6 shows the cumulative group distribution of the PhCI data for 400 swallows in all subjects. These data showed normal distributions within 80% of subjects; however, the groupwise frequency plot shows a nonnormal distribution that is markedly skewed right, indicating the chance of measuring high values for PhCI within and among healthy subjects.
DISCUSSION
In this study, using 40 swallows of the same volume across 10 individuals in 2 sessions, we systematically addressed some of the important issues regarding pharyngeal motor function, including the normal ranges of the pharyngeal peristaltic parameters and the typical variability of these parameters.
Study findings indicate that there is an inherent significant variability of peak pharyngeal peristaltic pressure waves at various locations within the contractile pharynx. Given the disparate means and variances among subjects, the appearance of nonnormally distributed group data for some of the peak pressure sites is not entirely unexpected. For those sites showing groupwise nonnormal distributions, all are markedly skewed right; that is, these distributions show a significant number of observations with high peak peristaltic pressure measurements within and among healthy subjects. Thus high peak pressures, taken as the only feature characterizing pharyngeal peristaltic pressure phenomena, may not be a good distinguishing factor for identifying “abnormal” pharyngeal pressure activity. This dispersion of pressure across sites and across 40 swallows ranges between 34 and 545 mmHg. This finding reveals the wide range of pressures that the pharyngeal constrictors are capable of generating during swallowing under normal conditions and suggests the existence of a significant operational reserve. Considering the wide range of pressures documented in this study, it is reasonable to assume that the pharynx can tolerate the negative impact of various disorders, allowing the deglutitive pharyngeal motor function to remain within the normal limit. In addition, study findings show that for each site, the magnitude of variability differences from one individual to another is significant, as evidenced by CV ranging from 3 to 39%. Anticipating that the use of a combined metric such as the PhCI might reduce the variability inherent in the peak pressure data, we determined the dispersion of PhCI within and between individuals. Study findings indicate that although PhCI subsumes the site-specific variability of the pharyngeal peristaltic pressure waves, it does not markedly reduce the level of intrasubject and intersubject variability. The wide range of PhCI within and among healthy individuals (117-638 mmHg·cm−1·s−1) can pose significant difficulty in interpreting pressure data obtained to diagnose pathological conditions but as stated above also indicate the existence of significant functional reserve capable of tolerating the negative impact of deleterious conditions.
Comparison of a given set of acquired data with the normal values can be viewed from two perspectives, compatibility of measures of centrality like the mean or median values or similarity of measures of dispersion like variance or range. Although both points of view provide valuable information, measures of centrality have been prevalently used in clinical settings. The present study provides information regarding both points of view in a group of healthy individuals performing large numbers of swallow repetitions. Although this study design provides robust information regarding the effect of swallow repetition within subjects, information influenced by the number of study subjects needs confirmation by studies of larger numbers of individuals.
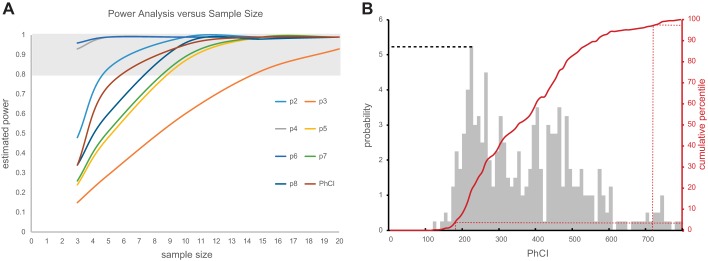
Having shown significant variability in the pressure metrics reported in our study, there is a concern that undersampling these metrics may not give an accurate estimate of centrality (i.e., mean or median) and dispersion (SD, CV, or maximum and minimum values) characterizing the population of likely measurements. Using all the sampled values from our data set, a robust Monte Carlo simulation was performed by repeatedly sampling each subject’s data using sample sizes of 3, 5, 10, and 20 random values. These random samples were repeated 100 times for each subject with the resulting data sets averaged for each metric across subjects. The variance of the simulated data was then compared with the variance of our 400-sample data sets using an F-statistic to test whether the simulated variance was different from the actual variance of our group data. In this way, a significant F would indicate differences between the simulated data sampled using a smaller sample size compared with the variance represented by the larger sample size of 40 samples per subject from our experiment, thereby suggesting that the smaller sample size was inadequate for fairly representing the possible outcomes for the tested metrics. As seen in Table 2, the nominal sample size was different for the tested metrics. A simulated sample size of 3 was sufficient to fairly parameterize variability in the p5, p6, p7, p8, and PhCI data sets; however, samples sizes of between 5 and 10 samples would likely be best for p2, p3, and p4 metrics. Whereas the Monte Carlo simulation tested the effect of sample size on objectively estimating the dispersion of pressure metrics, another way to estimate sample size is to consider the statistical power of comparing the mean peak pressure data using the mean and SD data from our 400-sample-per-site data set. Because power estimates are theoretical functions of mean, SD, and sample size, a comparison of predicted power for comparison of means is possible using the mean and SD values from our experimental data pool and various choices of sample size. Figure 7A shows the results of such a power analysis. As seen for each metric, there is an associated curve relating sample size to estimated statistical power. Because a value of 0.8 is commonly accepted as an adequate threshold for acceptable statistical power, the shaded region of the graph delineates the point on each curve where adequate power is achieved. For example, adequate power for comparing means for p2 data would require at least 4 or 5 samples, whereas p3 data comparisons would require sample sizes of at least 14 or 15 samples.
Table 2.
Estimates of sample size for pressure metric variance models
| Sample Sizes | p2 | p3 | p4 | p5 | p6 | p7 | p8 | PhCI |
|---|---|---|---|---|---|---|---|---|
| 3 | 0.030 | 0.020 | 0.007 | 0.130 | 0.060 | 0.130 | 0.140 | 0.140 |
| 5 | 0.060 | 0.060 | 0.007 | 0.470 | 0.190 | 0.380 | 0.250 | 0.350 |
| 10 | 0.220 | 0.340 | 0.100 | 0.720 | 0.700 | 0.630 | 0.450 | 0.470 |
| 20 | 0.850 | 0.450 | 0.280 | 0.990 | 0.860 | 0.630 | 0.670 | 0.570 |
PhCI, pharyngeal contractile integral.
Fig. 7.
A: power analysis showing the relationship between sample size and power for sitewise peak peristaltic pressure and PhCI metrics. As seen for each metric, there is an associated curve relating sample size to estimated statistical power. Because a value of 0.8 is commonly accepted as an adequate threshold for acceptable statistical power, the shaded region of the graph delineates the point on each curve where adequate power is achieved. For example, adequate power for comparing means for p2 data would require at least 4 or 5 samples, whereas p3 data comparisons would require sample sizes of at least 14 or 15 samples. B: probability histogram and cumulative distribution are shown for all our PhCI data. The PhCI ranges are shown on the x-axis, and the probabilities are scaled on the left y-axis; for example, the probability of observing a PhCI of 220 is 5.25% as shown by the dashed line. The cumulative distribution function (CDF) is scaled by the right y-axis and red line. The CDF approach is useful in determining the overall probability of observing PhCI values less than, greater than, or within a range of PhCI values. For example, if one wanted to know the 95% confidence interval of the data collection, all the observations on the CDF between 2.5 and 97.5% of the population would indicate the values of PhCI between which 95% of the observations were seen. From B, this is shown as PhCI values between 170 and 720 as indicated by the dashed red lines.
Another potentially valuable use of our robust collection of pharyngeal pressure metrics is estimation of probability features of the population of data, such as determining 95% confidence intervals and probability of measuring particular ranges of metrics. A probability histogram and cumulative distribution are shown in Fig. 7B for all of our PhCI data. As seen, the PhCI ranges are shown on the x-axis and the probabilities are scaled on the left y-axis; for example, the probability of observing a PhCI of 220 is 5.25% as shown by the dashed line in Fig. 7B. The cumulative distribution function (CDF) is scaled by the right y-axis and red line in Fig. 7B. The CDF approach is useful in determining the overall probability of observing PhCI values less than, greater than, or within a range of PhCI values. For example, if one wanted to know the 95% confidence interval of the data collection, all the observations on the CDF between 2.5 and 97.5% of the population would indicate the values of PhCI between which 95% of the observations were seen. From Fig. 7B, this is shown as PhCI values between 170 and 720 as indicated by the dashed red lines. A truncated table of the CDF graph values is shown in Table 3, further illustrating these kinds of probability range calculations. The 95% confidence interval example discussed above is also well depicted in this table; that is, 97.5 – 2.5% = 95% of the data lies between PhCI values of 720 and 170. Other ways to use a CDF table would be to answer questions like, Up to what values of PhCI does 50% of the data occur?, wherein Table 3 shows that value to be 354, or What is the probability of measuring PhCI between 354 and 200?, where Table 3 shows that probability to be 50 – 10% = 40%.
Table 3.
CDF for PhCI data
| PhCI | CDF, % |
|---|---|
| 170 | 2.5 |
| 200 | 10.0 |
| 240 | 25.0 |
| 354 | 50.0 |
| 460 | 75.0 |
| 560 | 90.0 |
| 720 | 97.5 |
CDF, cumulative distribution function.
The two perspectives for parameterizing pharyngeal pressure data discussed above offer insight into analytical methods to estimate the sample size required to fairly represent the population of possible pressure measurements. Estimates of sample size using models of statistical power in mean value comparisons as seen in Fig. 4A of the present study show that smaller sample sizes for some parameters likely provide fair representation of these average pressure metrics, but other metrics require much larger sample sizes to adequately represent the population of possible values. For example, reliable mean values for peak peristaltic pressures at sites 2 and 4 cm above the upper margin of the UESHPZ showed adequate sample sizes of three samples; however, parameters like peak pressures further from the UES or PhCI require from 5 to 15 samples to establish adequate (80%) power for comparison of mean values within or across subjects. Available published studies have used different numbers of repetitions ranging from 3 to 10 (6, 12, 19). On the basis of the findings of the present study, a minimum number of 10 swallows per subject for a given condition is required to obtain reliable results for nearly all studied pressure parameters. Our study findings also inform the required number of repetitions for understanding the dispersion of the manometric data and stress the importance of adequate sample size both in terms of number of studied individuals as well as number of swallows per individual. Although our findings demonstrate different magnitudes of variability in pharyngeal peristaltic parameters, as shown in Table 2, sample sizes as low as three or four repetitions are adequate for fairly representing the variance for the peak peristaltic pressure across pharyngeal sites as well as the variance of PhCI. By the maintaining of a sample size of 10 repetitions as suggested above, the requirements for both understanding the centrality as well as the dispersion of the data will be met.
Earlier studies using three swallow repetitions in over 30 healthy volunteers reported significant variability of pharyngeal peristaltic parameters (1). The findings of the present study are in substantial agreement with that study and confirm that the reported range of variability is reproducible even when significantly larger numbers of swallow repetitions are used.
Normal pharyngeal motor function plays a crucial role in prevention of postdeglutitive residue and aspiration by adequately transporting the arriving oral bolus into the esophagus. Pharyngeal motor function constitutes the contractions of semicircular pharyngeal constrictors, the velum, and longitudinal muscles of the pharynx (4, 18), complemented by the posterior tongue thrust, collectively generating a peristaltic pressure wave temporally coordinated with the lingual peristalsis proximally and opening and closure of the UES distally (16, 17). This recognition of the multifactorial nature of pharyngeal peristalsis is important and can play a significant role in better defining the contribution of specific muscle groups to inadequate pharyngeal motor function and inform rehabilitative approaches and management.
Our data indicated that not all the obtained pressure measurements are normally distributed. These nonnormally distributed data are skewed right, which means there is a chance of seeing very high peak pressure or PhCI data within and among healthy subjects; thus high peak pressures and/or PhCI may not be a good distinguishing factor for identifying abnormal pharyngeal pressure activity in patient populations.
A potential shortcoming of the present study is related to available manometric technology in that the presently available recording catheters may not provide the necessary spatial resolution to adequately measure the nuances of pharyngeal peristaltic pressure phenomena. It is possible that, with the design/availability of recording devices with greater spatial resolution, the presently known pharyngeal pressure tilde (1, 7) could become spatially resolved enough to reveal clinically useful specific abnormal pressure patterns induced by abnormalities of specific pharyngeal muscles.
Another significant shortcoming of the present study is the lack of data for various swallow volumes. Because of the large number of swallows necessary for our study design, inclusion of other volumes was avoided because rapid, repeated swallows of larger boluses may have negatively affected the quality of the data by increasing the duration of the experiments to levels intolerable to many subjects. Furthermore, repeated swallows of larger boluses may also have induced subject fatigue and promoted the inability of subjects to complete the experiment. Although the data provided by 0.5-ml swallows obtained in this study are informative, the dispersion and centrality of the data for other swallow volumes may be different and merit further investigation.
The thermal pressure drift reported by multiple investigators for the Given Image HRM probes may have influenced our findings. As an estimation of the amount of drift from these publications (8, 15) over the 40 min of our study protocol, the median drift across all channels would be between 4 and 5 mmHg. Given that our principal pressure metrics of interest were based on peak peristaltic pressures that range from 50 to 350 mmHg in our study, a 4.5-mmHg discrepancy in pressure attributable to drift would be manifest as a 0.1– 9.0% effect on measured peak pressures. Our findings have shown that the error inherent in the peak pressure data across the pharynx ranges from 10–17% of the mean peak pressure; thus the variance introduced by the drift effect is less than the inherent error in the data, thereby greatly limiting the influence of error introduced by drift in affecting the findings of our study. To further explore the effects of drift on our findings, all HRM data were reanalyzed with and without using the thermal compensation guidelines in the ManoView analysis software. These two sets of findings were compared using intrasubject correlation coefficient analysis to test the level of concordance between the two compensation conditions. For all measured peak peristaltic pressure and PhCI values, there was excellent agreement. As seen in Fig. 8 for PhCI measurements and summarized in the Table 4, intraclass correlation showed significant agreement between the conditions, thereby making drift correction (at least in the manner used in the ManoView software) inconsequential in terms of affecting our findings.
Fig. 8.
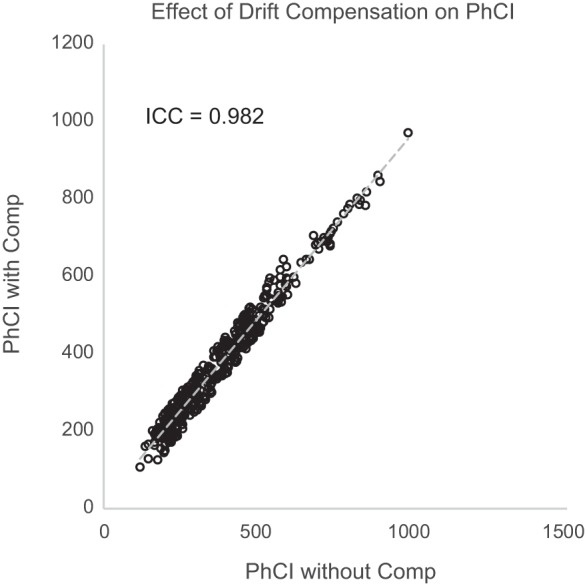
Correlation plot of PhCI values measured across all subjects with and without thermal compensation. As seen, there was significant correlation of PhCI values [intraclass correlation coefficient (ICC) of 0.98], indicating little effect of thermal drift compensation on PhCI metrics.
Table 4.
ICCs for pressure comparing values with and without temperature compensation
| Metric | ICC |
|---|---|
| p2 | 0.994 |
| p3 | 0.998 |
| p4 | 0.986 |
| p5 | 0.996 |
| p6 | 0.981 |
| p7 | 0.996 |
| p8 | 0.993 |
| PhCI | 0.982 |
ICC, intraclass correlation coefficient.
In summary, peak pharyngeal peristaltic pressure profile and PhCI exhibit significant variability among individuals and between swallows. The observed variance indicates a significant operational range and functional reserve in pharyngeal contractile function while necessitating parameter-specific sample size for reliable results. An estimated 10 repetitions seem to overcome this difficulty for many pharyngeal pressure metrics.
GRANTS
This project was supported in part by National Institutes of Health Grants P01DK068051, R01DK025731, T32DK061923, and UL1TR001436.
DISCLOSURES
No conflicts of interest, financial or otherwise, are declared by the authors.
AUTHOR CONTRIBUTIONS
M.K.K. and R.S. conceived and designed research; M.K.K., G.B., P.S., D.A., and A.W. performed experiments; M.K.K., G.B., P.S., and D.A. analyzed data; M.K.K., G.B., P.S., D.A., and R.S. interpreted results of experiments; M.K.K. prepared figures; M.K.K. and R.S. drafted manuscript; M.K.K. and R.S. edited and revised manuscript; R.S. approved final version of manuscript.
REFERENCES
- 1.Balasubramanian G, Kern M, Mei L, Manderle R, Babaei A, Shaker R. Variability of pharyngeal peristaltic pressure parameters measured by high resolution manometry (HRM); a study of over 900 pressure signatures. Gastroenterology 148: S-167, 2015. doi: 10.1016/S0016-5085(15)30558-8. [DOI] [Google Scholar]
- 2.Clouse RE, Parks T, Haroian L, Zakko SF. Development and clinical validation of a solid-state high-resolution pressure measurement system for simplified and consistent esophageal manometry. Am J Gastroenterol 98: S32–S33, 2003. doi: 10.1111/j.1572-0241.2003.07830.x. [DOI] [Google Scholar]
- 3.Dodds WJ, Hogan WJ, Lydon SB, Stewart ET, Stef JJ, Arndorfer RC. Quantitation of pharyngeal motor function in normal human subjects. J Appl Physiol 39: 692–696, 1975. [DOI] [PubMed] [Google Scholar]
- 4.Drake RL, Vogl W, Mitchell AWM. Gray's Anatomy for Students (3rd ed). Edinburgh, UK: Churchill Livingstone, 2015. [Google Scholar]
- 5.Hoffman MR, Jones CA, Geng Z, Abelhalim SM, Walczak CC, Mitchell AR, Jiang JJ, McCulloch TM. Classification of high-resolution manometry data according to videofluoroscopic parameters using pattern recognition. Otolaryngol Head Neck Surg 149: 126–133, 2013. doi: 10.1177/0194599813489506. [DOI] [PMC free article] [PubMed] [Google Scholar]
- 6.Hoffman MR, Mielens JD, Ciucci MR, Jones CA, Jiang JJ, McCulloch TM. High-resolution manometry of pharyngeal swallow pressure events associated with effortful swallow and the Mendelsohn maneuver. Dysphagia 27: 418–426, 2012. doi: 10.1007/s00455-011-9385-6. [DOI] [PMC free article] [PubMed] [Google Scholar]
- 7.Jiao H, Mei L, Sharma T, Kern M, Sanvanson P, Shaker R. A human model of restricted upper esophageal sphincter opening and its pharyngeal and UES deglutitive pressure phenomena. Am J Physiol Gastrointest Liver Physiol 311: G84–G90, 2016. doi: 10.1152/ajpgi.00145.2016. [DOI] [PMC free article] [PubMed] [Google Scholar]
- 8.Lamvik K, Guiu Hernandez E, Jones R, Huckabee ML. Characterization and correction of pressure drift in the ManoScan(™) high-resolution manometry system: in vitro and in vivo. Neurogastroenterol Motil 28: 732–742, 2016. doi: 10.1111/nmo.12770. [DOI] [PubMed] [Google Scholar]
- 9.Lan Y, Xu GQ, Yu F, Lin T, Jiang LS, Liu F. The effect of bolus consistency on swallowing function measured by high-resolution manometry in healthy volunteers. Laryngoscope 127: 173–178, 2017. doi: 10.1002/lary.26085. [DOI] [PubMed] [Google Scholar]
- 10.Lin Z, Roman S, Pandolfino JE, Kahrilas PJ. Automated calculation of the distal contractile integral in esophageal pressure topography with a region-growing algorithm. Neurogastroenterol Motil 24: e4–e10, 2012. doi: 10.1111/j.1365-2982.2011.01795.x. [DOI] [PMC free article] [PubMed] [Google Scholar]
- 11.McCulloch TM, Hoffman MR, Ciucci MR. High-resolution manometry of pharyngeal swallow pressure events associated with head turn and chin tuck. Ann Otol Rhinol Laryngol 119: 369–376, 2010. [DOI] [PMC free article] [PubMed] [Google Scholar]
- 12.Nativ-Zeltzer N, Logemann JA, Zecker SG, Kahrilas PJ. Pressure topography metrics for high-resolution pharyngeal-esophageal manofluorography-a normative study of younger and older adults. Neurogastroenterol Motil 28: 721–731, 2016. doi: 10.1111/nmo.12769. [DOI] [PMC free article] [PubMed] [Google Scholar]
- 13.Omari TI, Dejaeger E, Van Beckevoort D, Goeleven A, De Cock P, Hoffman I, Smet MH, Davidson GP, Tack J, Rommel N. A novel method for the nonradiological assessment of ineffective swallowing. Am J Gastroenterol 106: 1796–1802, 2011. doi: 10.1038/ajg.2011.143. [DOI] [PubMed] [Google Scholar]
- 14.Orlowski J, Dodds WJ, Linehan JH, Dent J, Hogan WJ, Arndorfer RC. Requirements for accurate manometric recording of pharyngeal and esophageal peristaltic pressure waves. Invest Radiol 17: 567–572, 1982. doi: 10.1097/00004424-198211000-00008. [DOI] [PubMed] [Google Scholar]
- 15.Roberston EV, Lee YY, Derakhshan MH, Wirz AA, Whiting JR, Seenan JP, Connolly P, McColl KE. High-resolution esophageal manometry: addressing thermal drift of the manoscan system. Neurogastroenterol Motil 24: 61–64, 2012. doi: 10.1111/j.1365-2982.2011.01817.x. [DOI] [PubMed] [Google Scholar]
- 16.Shaker R, Ren J, Podvrsan B, Dodds WJ, Hogan WJ, Kern M, Hoffmann R, Hintz J. Effect of aging and bolus variables on pharyngeal and upper esophageal sphincter motor function. Am J Physiol Gastrointest Liver Physiol 264: G427–G432, 1993. [DOI] [PubMed] [Google Scholar]
- 17.Shaker R, Ren J, Zamir Z, Sarna A, Liu J, Sui Z. Effect of aging, position, and temperature on the threshold volume triggering pharyngeal swallows. Gastroenterology 107: 396–402, 1994. doi: 10.1016/0016-5085(94)90164-3. [DOI] [PubMed] [Google Scholar]
- 18.Shaker R, Sanvanson P, Balasubramanian G, Kern M, Wuerl A, Hyngstrom A. Effects of laryngeal restriction on pharyngeal peristalsis and biomechanics: clinical implications. Am J Physiol Gastrointest Liver Physiol 310: G1036–G1043, 2016. doi: 10.1152/ajpgi.00010.2016. [DOI] [PMC free article] [PubMed] [Google Scholar]
- 19.Walczak CC, Jones CA, McCulloch TM. Pharyngeal pressure and timing during bolus transit. Dysphagia 32: 104-114, 2017. doi: 10.1007/s00455-016-9743-5. [DOI] [PMC free article] [PubMed] [Google Scholar]


