Abstract
Carnitine palmitoyltransferase 1 (CPT1) is essential for the transport of long-chain fatty acids into the mitochondria for oxidation. Recently, it was reported that decreased CPT1b mRNA in adipose tissue was a contributing factor for obesity in rats. We therefore closely examined the expression level of Cpt1 in adipose tissue from mice, rats, and humans. Cpt1a is the predominate isoform in adipose tissue from all three species. Rat white adipose tissue has a moderate amount of Cpt1b mRNA, but it is very minor compared with Cpt1b expression in muscle. Total CPT1 activity in adipose tissue is also minor relative to other tissues. Both Cpt1a and Cpt1b mRNA were increased in gonadal fat but not inguinal fat by diet-induced obesity in mice. We also measured CPT1a and CPT1b expression in subcutaneous adipose tissue from human subjects with a wide range of body mass indexes (BMIs). Interestingly, CPT1a expression positively correlated with BMI (R = 0.46), but there was no correlation with CPT1b (R = 0.04). Our findings indicate that white adipose tissue fatty acid oxidation capacity is minor compared with that of metabolically active tissues. Furthermore, given the already low abundance of Cpt1b in white adipose tissue, it is unlikely that decreases in its expression can quantitatively decrease whole body energy expenditure enough to contribute to an obese phenotype.
Keywords: Cpt1a; Cpt1b; adipose tissue; lipid oxidation, obesity
carnitine palmitoyl transferase 1 (CPT1) catalyzes the rate-limiting step of fatty acid oxidation by shuttling long-chain fatty acids across the mitochondrial membrane and has been a target for new avenues of treatment for type 2 diabetes and obesity. To date, three isoforms of CPT1 have been identified that are differentially expressed depending on tissue (reviewed in Ref. 2). CPT1a is also known as the liver isoform (20), and is expressed in brain, intestine, kidney, lung, ovary, pancreas, and spleen. CPT1b is often called the muscle isoform, and is found in high abundance in skeletal muscle, heart, and brown adipose tissue (BAT) (7). The third isoform, CPT1c, is predominately expressed in brain. Its exact role is uncertain, and it has been shown to be localized to the endoplasmic reticulum rather than to the mitochondria (11, 15).
With growing interest in CPT1 as a pivotal player in the development of metabolic dysfunction, an accurate characterization of its isoform distribution is of interest. Recent work by Ratner et al. (12) implicated changes in Cpt1b mRNA levels from adipose tissue as being responsible for corresponding changes in whole body energy expenditure. The basis for that conclusion is about a 30% decrease in Cpt1b mRNA in epididymal fat with no differences in Cpt1b mRNA levels in subcutaneous fat or in muscle. Also, CPT1b protein or CPT1 activity levels were not measured.
A review of the literature shows contradicting expression of the Cpt1 isoforms a and b in white adipose tissue (WAT) among mice, rats, and humans, primarily with data collected from nonquantitative Northern blots and cultured adipocytes (3, 4, 7). In this paper, we closely examine the expression patterns of Cpt1 isoforms with modern quantitative PCR on WAT from these three species and measure CPT1 activity in several rat tissues. Our results do indeed indicate that the isoform distribution of Cpt1 changes depending upon the species, and that CPT1 activity is readily observable in metabolic tissues such as liver, skeletal muscle, and BAT, whereas it is very low in WAT.
MATERIALS AND METHODS
Animal procedures.
Animal studies were conducted at the Pennington Biomedical Research Center AALAC-approved facility (Baton Rouge, LA). All experiments were performed in compliance with the Guide for the Care and Use of Laboratory Animals (Washington, DC: National Research Council), and approved by the Louisiana State University Institutional Animal Care and Use Committee. Sprague-Dawley rats (6–10 wk old) were obtained from Charles River, and specified tissues were collected. For age studies, 24-wk-old rats were compared with the 6- to 10-wk-old group. Male rats (24 wk old) were used for assay of CPT activity as described below. C57BL/6 mice (8–10 wk old) were used for collection of the same tissues obtained from the rats. Rats were single-housed, whereas mice were multihoused, and all were exposed daily to a 12:12-h light-dark cycle. Unless otherwise noted, all animals were euthanized in the fed state on a standard chow diet, composed of 20% (kcal) protein, 25% (kcal) fat, and 55% (kcal) carbohydrate (Purina Rodent Chow 5015; Purina Mills). For diet-induced obesity studies, starting at 4 wk of age mice were fed either a low-fat diet composed of 20% (kcal) protein, 10% (kcal) fat, and 70% (kcal) carbohydrate (D12450; Research Diets); or a high-fat diet composed of 20% (kcal) protein, 45% (kcal) fat, and 35% (kcal) carbohydrate (D12451; Research Diets) for ~40 wk. All reported body composition was measured using a Bruker NMR Minispec (Bruker).
Human samples.
Human WAT samples from 3 men and 3 women were selected from clinical trials conducted at Pennington Biomedical Research Center on obese individuals preparing for bariatric surgery. The inclusion criteria including the metabolic phenotypes of participants in the study from which these samples were taken have been cited elsewhere (16). Biopsies of fat tissue were taken via Mercedes liposuction needles from subcutaneous WAT of patients who had fasted overnight. The protocols of this study were approved by the Institutional Review Board of Pennington Biomedical Research Center, and all volunteers gave written informed consent. Additional human samples for eight women from which subcutaneous fat was removed during liposuction procedures were obtained from LaCell LLC (New Orleans, LA) and were collected anonymously from patients with informed written consent through a protocol reviewed and approved by WIRB (Puyallup, WA). Age and body mass index (BMI) data for the samples analyzed herein are presented in Table 1.
Table 1.
Human samples used for this study
| Sex | Body Mass Index | Age | Collection Type |
|---|---|---|---|
| Female | 24.7 | 48 | Liposuction |
| Female | 19.9 | 63 | Liposuction |
| Female | 27.8 | 26 | Liposuction |
| Female | 30.1 | 29 | Liposuction |
| Female | 21.2 | 38 | Liposuction |
| Female | 25.3 | 35 | Liposuction |
| Female | 22.0 | 47 | Liposuction |
| Female | 33.1 | 55 | Liposuction |
| Female | 71.5 | 40 | Biopsy |
| Female | 53.8 | 62 | Biopsy |
| Female | 55.4 | 37 | Biopsy |
| Male | 60.8 | 25 | Biopsy |
| Male | 44.5 | 24 | Biopsy |
| Male | 62.2 | 42 | Biopsy |
Quantitative RT-PCR.
RT-PCR was conducted and analyzed using the ΔΔCT procedure described previously (18). Quantification of the mouse, rat, and human cyclophilin B (ppib) transcript was used in all experiments as a control for normalization of gene expression. Primer details are provided in Table 2.
Table 2.
Primers used for this study
| Primer | Sequence (5′-3′) |
|---|---|
| Mouse ppib forward | TCCATCGTGTCATCAAGGACTT |
| Mouse ppib reverse | CTCATCTGGGAAGCGCTCA |
| Mouse Cpt1a forward | CATGATTGCAAAGATCAATCGG |
| Mouse Cpt1a reverse | CTTGACATGCGGCCAGTG |
| Mouse Cpt1b forward | CCCGAGCAGTGCCGGGAAGC |
| Mouse Cpt1b reverse | GAAATGAGCCAGCTGTAGGG |
| Mouse Cpt1c forward | CGCCCAGTATGAGAGGATGT |
| Mouse Cpt1c reverse | GTGTCGGCTGTCTTGAAGGT |
| Rat ppib forward | GCAAAGTTCTGGAAGGCATGGAT |
| Rat ppib reverse | GTCTACAATGATCACATCCTTCAGG |
| Rat Cpt1a forward | GCACCAAGATCTGGATGGCTATGG |
| Rat Cpt1a reverse | TACCTGCTCACAGTATCTTTGAC |
| Rat Cpt1b forward | CATTTCCGGGACAAAGGCAAGT |
| Rat Cpt1b reverse | CGTGGACTCGCTAGTACAGGAA |
| Rat Cpt1c forward | CGAGGCTCTTCAGCTTTCAACG |
| Rat Cpt1c reverse | CGCATGGACTCTAGGTACTTG |
| Human ppib forward | ATGATCCAGGGCGGAGACT |
| Human ppib reverse | CAGGCCCGTAGTGCTTCAG |
| Human Cpt1a forward | CGATGTTACGACAGGTGGTTTGACA |
| Human Cpt1a reverse | AGTGCCCATCCTCCGCATAG |
| Human Cpt1b forward | GAGCAGCACCCCAATCAC |
| Human Cpt1b reverse | TCTCGCCTGCAATCATGTAG |
| Human Cpt1c forward | TGATCGCTGGTTTGACAAATCCTT |
| Human Cpt1c reverse | AGCATTCTGTAGCCAGAGTGAACTC |
CPT activity assays.
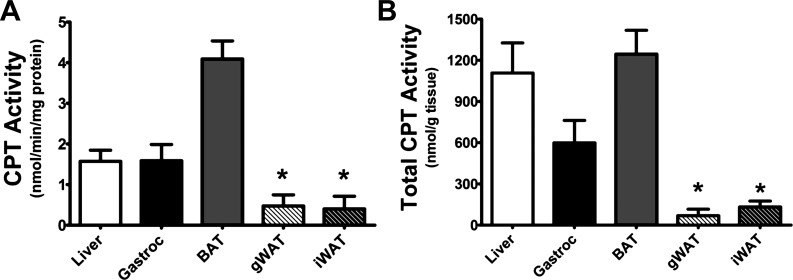
CPT activity was assayed using tissue homogenates following the guidelines described by Bieber et al. (1). Briefly, 200 mg of razor-minced tissue homogenates were incubated in 5 ml of 0.05% wt/vol trypsin solution containing 67 mM sucrose, 50 mM KCl, 10 mM EDTA, 2 mg/ml BSA, and 50 mM Tris·HCl at pH 7.4 for 30 min on ice. Tissues were then filter-drained and homogenized via 10 passes with a Thomas homogenizer rotating at 125 revolutions per min in 2 ml of the above buffer but without trypsin. Protein concentration was determined using bicinchoninic acid (BCA), and 120 μg of protein was used per assay well. Duplicate assays were run for each of six rats and were averaged together for final analysis. To determine the amount of product produced per milligram of tissue, the absorbance after 10 min of continuous reaction was used, multiplied by the total protein in the homogenate, and then divided by the initial 200 mg of tissue used (see Fig. 4B).
Fig. 4.
Carnitine palmitoyl transferase (CPT) activity levels in various rat tissues. A: results after 10 min of enzymatic activity assay for CPT1 in the following tissues: liver (white), gastrocnemius (black), brown adipose tissue (BAT) (gray), gonadal WAT (white with stripes), and inguinal WAT (black with stripes). B: amount of product potentially produced per gram of tissue for the various tissues tested. Rats were 24 wk old; n = 6 for all tissues. Values are means ± SE. *Both fat pads show significantly lower activity than liver, gastrocnemius, and BAT; P < 0.05.
Statistical analysis.
Data values are expressed as means ± SE. Two-tailed Student’s t-tests were used to determine P values. All values of P < 0.05 were considered significant. Statistical correlations were calculated using a linear regression with JMP software from SAS.
RESULTS
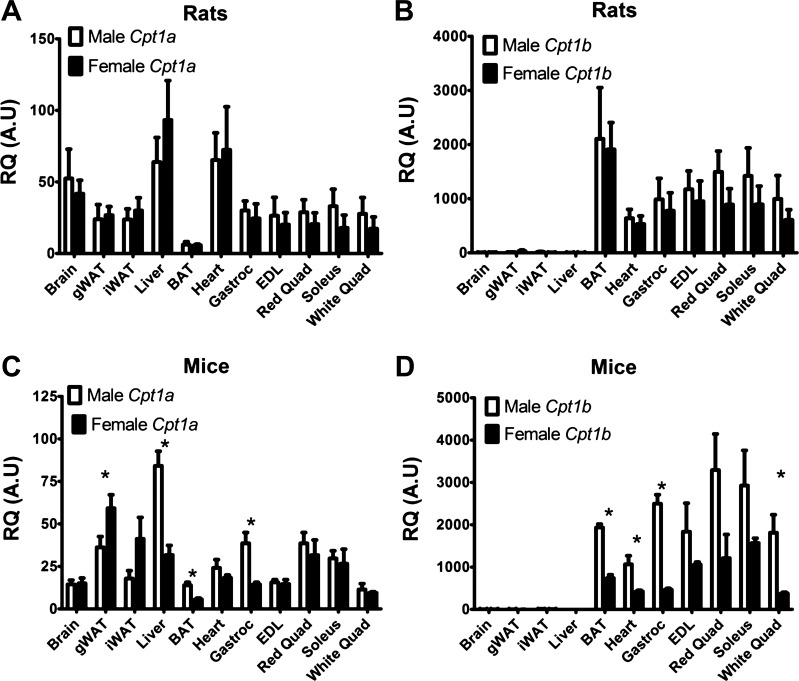
Various tissues were collected from 6- to 10-wk-old male and female Sprague-Dawley rats or C57BL/6J mice and were analyzed using quantitative PCR to check Cpt1a and Cpt1b mRNA expression levels. As previously reported (6, 13), Cpt1a expression is highest in liver and present in most other tissues (Fig. 1 A, and C). Cpt1b is highest in BAT and muscle and much lower in other tissues (Fig. 1, B and D) as has been previously indicated (7). We did note that some mouse tissues showed differing levels of either Cpt1 isoform in males versus females (Fig. 1 C, and D). Levels of the brain isoform, Cpt1c, were virtually undetectable in all tissues except brain, and these data are therefore not shown here.
Fig. 1.
Quantitative PCR results showing relative mRNA expression of Cpt1a and Cpt1b. A and C: relative expression of Cpt1a in male and female mouse and rat tissues. B and D: relative expression of Cpt1b in male and female mouse and rat tissues. WAT, white adipose tissue; gWAT, gonadal WAT; iWAT, inguinal WAT. Animals were 6–10 wk of age, 6 animals/group. Values are means ± SE; *P < 0.05 between male and female groups.
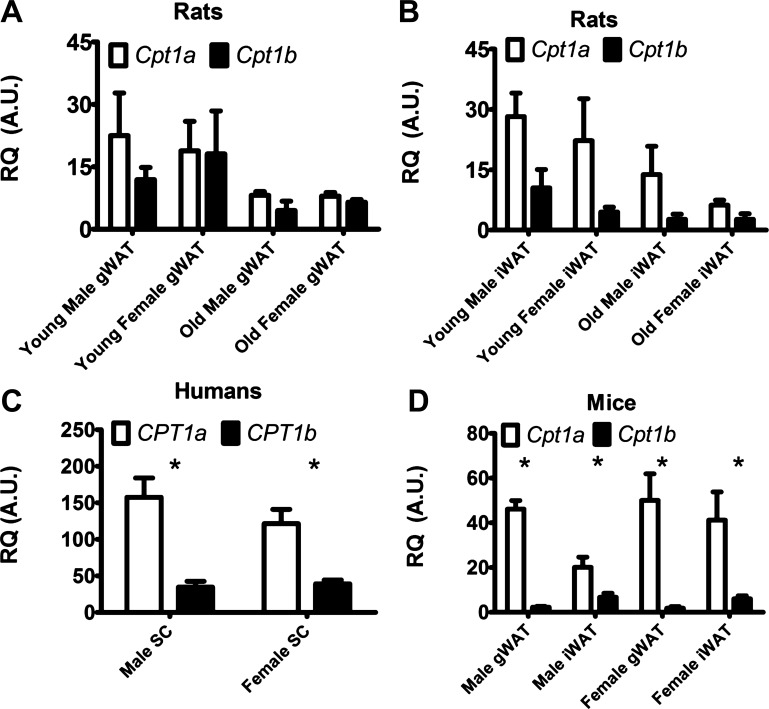
We more closely examined the expression levels of Cpt1a and Cpt1b in WAT. Sprague-Dawley rats have slightly higher Cpt1a over Cpt1b in young and old male and female rats in various WAT depots (Fig. 2, A and B), but we do not report a statistical significance for this difference in any of the depots examined. There is also a trend toward lower expression of both Cpt1 isoforms in WAT from the older rats relative to the younger, but this trend does not reach statistical significance either.
Fig. 2.
Quantitative PCR results showing relative mRNA expression of Cpt1a (white bars), and Cpt1b (black bars). A: relative expression of Cpt1 isoforms in rat gWAT. B: relative expression of Cpt1 isoforms in rat iWAT. Young rats were 8–10 wk of age, old rats were 24 wk of age. C: relative expression of CPT1 isoforms in human subcutaneous fat. D: relative expression of Cpt1 isoforms in 8- to 10-wk-old mouse WAT depots. SC, subcutaneous for humans; gWAT, gonadal WAT; iWAT, inguinal WAT; n = 6 for all mice and rat data; n = 3 men and n = 11 women. Values are means ± SE; *P < 0.05.
C57BL/6J mice and humans were next examined to determine whether patterns hold consistent for each species. Human subcutaneous WAT samples were selected from participants in clinical studies conducted at Pennington Biomedical Research Center or they were purchased through commercial sources from patients who underwent liposuction (see materials and methods and Table 1 for details). Unlike Sprague-Dawley rats, Cpt1a expression is clearly higher in WAT of both mice and humans, showing significantly higher expression levels in all tissues (Fig. 2, C and D). The relative expression of Cpt1a to Cpt1b on average in WAT is roughly 3.8-fold in humans and 11.1-fold in mice.
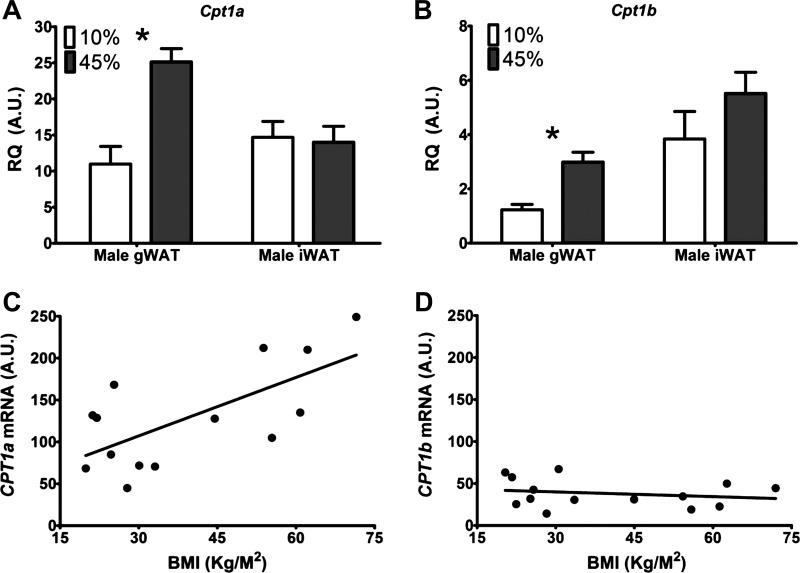
To determine the effects of diet-induced obesity on expression levels of Cpt1, we used C57BL/6J male mice that had been fed either a low- or high-fat diet (Fig. 3, A and B) for ~40 wk. The average fat mass determined by NMR was 4.8 ± 0.9 g and 10.3 ± 0.8 g, for mice fed a low-fat and high-fat diet, respectively, P < 0.001. Raising the fat content of the diet results in a significant increase in the expression levels of both Cpt1a and Cpt1b in male gonadal WAT, but not inguinal WAT. However, these levels are still at least 50-fold lower than the levels we report in muscle tissues.
Fig. 3.
Change in Cpt1 mRNA expression levels with diet and body mass index (BMI). Cpt1a (A) and Cpt1b (B) expression levels in WAT depots of mice fed a diet with 10% (white) or 45% (gray) fat for ~40 wk. Values are means ± SE; *P < 0.05 between Cpt1 isoform expression levels. n = 7 animals given low-fat diet, n = 11 animals given high-fat diet. C: correlation between CPT1a levels in human adipose tissue and BMI (R = 0.46). D: correlation between CPT1b levels in human adipose tissue and BMI (R = 0.04).
We also tested for correlations between BMI and CPT1 isoform expression in the human samples used herein. In the 14 human samples examined, a positive correlation was found between BMI and expression of CPT1a. This same correlation did not hold true, however, for expression of CPT1b (Fig. 3, C and D).
To confirm that Cpt1 mRNA levels correlate with CPT1 activity, we also measured total CPT1 activity (CPT1a and CPT1b) in whole rat tissue homogenates from BAT, muscle, liver, and adipose tissues (Fig. 4, A and B). CPT1 activity in WAT was extremely low compared with activity in liver, gastrocnemius, and BAT, which is in accordance with Cpt1 mRNA levels.
DISCUSSION
In the original paper discussing Cpt1 isoform levels in BAT and heart (7), Cpt1a is shown to be the dominant isoform in whole WAT extracts from rats, but both isoforms are expressed at much lower levels in isolated adipocytes, and there is a signal from Cpt1b with Northern blot analysis in female human white adipocytes. That same group of researchers subsequently published a paper showing expression of Cpt1b in rat and human adipocytes, but there was many-fold less Cpt1b in adipocytes/adipose tissue relative to heart (3). The next year, McGarry and Brown (10) published a review with a summary table of the relative expression of Cpt1a and Cpt1b in various tissues now showing equal levels of Cpt1b in heart, and white adipocytes with essentially no published data to support this conclusion (see Table 1 in Ref. 10). This summary table was later reproduced in a review by Ceccarelli et al. (5). This review of a review is now cited as indicating that Cpt1b has high levels of expression in adipose tissue (14). Our data using quantitative RT-PCR (Fig. 1) clearly show that Cpt1b expression in adipose tissue is negligible compared with expression in muscle, heart, and BAT in rats. Furthermore, total CPT1 activity is extremely low in adipose tissue. We also show here that in WAT of both mice and humans, Cpt1a is more abundant than Cpt1b and that the levels of both enzymes are low in WAT relative to other tissues. Although the above-mentioned rat and human studies rely only on mRNA levels, we demonstrate a direct relationship between mRNA levels in rat tissues and CPT1 activity.
Several studies have demonstrated that CPT1b inhibition leads to decreases in adiposity and body weight (8, 9, 14, 17, 19). For example, whole body Cpt1b heterozygous mice show prolonged decreases in adiposity and body weight, as well as temporary improvement in insulin sensitivity (8, 9). Moreover, skeletal muscle-specific Cpt1b knockout mice demonstrate long-term inhibition of CPT1b and maintain resistance to obesity and enhanced glucose disposal (17, 19). Finally, Sepa-Kishi et al. (14) show that administration of the CPT1b inhibitor oxfenicine leads to a reduction in lipogenesis specifically in adipose tissue of Sprague-Dawley rats, resulting in a decrease in both body weight and fat pad mass. These studies serve to reinforce the importance of CPT1b inhibition in decreasing overall adiposity.
Perspectives and Significance
This major goal of this paper is to clarify information on CPT1 in WAT using quantitative techniques to accurately measure Cpt1a and Cpt1b mRNA. Our results indicate that, contrary to what is commonly cited (5, 13, 14), Cpt1b mRNA is not highly expressed in WAT from any of the species examined here, nor is it the predominant CPT1 isoform in WAT. Furthermore, we show that WAT has total CPT1 activity levels that are barely detectable. It is unlikely that a decrease in the already very low CPT1 activity in WAT affects whole body energy expenditure enough to cause obesity.
GRANTS
Support for this work was provided by National Institute of Diabetes and Digestive and Kidney Diseases Fellowship T32DK-6458413 to J. D. Warfel, Grant R01DK-089641 to R. L. Mynatt, and Grant K01DK-106307 to C. M. Elks. This work used the PBRC facilities of the Transgenic, Comparative Biology, Genomics Core and Clinical Research Laboratory supported in part by COBRE (National Institute of General Medical Sciences Grant 8P20GM-103528) and the Nutrition Obesity Research Centers (National Institute of Diabetes and Digestive and Kidney Diseases Grant 2P30-DK-072476-11A1).
DISCLOSURES
No conflicts of interest, financial or otherwise, are declared by the authors.
AUTHOR CONTRIBUTIONS
J.D.W., C.M.E., and R.L.M conceived and designed research; J.D.W., B.V., O.S.D, S. M. H. and C. M. E. performed experiments; E.R. provided critical samples. J.D.W. and R.L.M. analyzed data and wrote the manuscript.
ACKNOWLEDGMENTS
We thank Estrellita Bermudez and Tamra Mendoza for technical assistance with tissue collection. We also thank the human-study participants and the staff of the Pennington Biomedical Research Center inpatient and outpatient units.
REFERENCES
- 1.Bieber LL, Abraham T, Helmrath T. A rapid spectrophotometric assay for carnitine palmitoyltransferase. Anal Biochem 50: 509–518, 1972. doi: 10.1016/0003-2697(72)90061-9. [DOI] [PubMed] [Google Scholar]
- 2.Bonnefont JP, Djouadi F, Prip-Buus C, Gobin S, Munnich A, Bastin J. Carnitine palmitoyltransferases 1 and 2: biochemical, molecular and medical aspects. Mol Aspects Med 25: 495–520, 2004. doi: 10.1016/j.mam.2004.06.004. [DOI] [PubMed] [Google Scholar]
- 3.Brown NF, Hill JK, Esser V, Kirkland JL, Corkey BE, Foster DW, McGarry JD. Mouse white adipocytes and 3T3-L1 cells display an anomalous pattern of carnitine palmitoyltransferase (CPT) I isoform expression during differentiation. Inter-tissue and inter-species expression of CPT I and CPT II enzymes. Biochem J 327: 225–231, 1997. doi: 10.1042/bj3270225. [DOI] [PMC free article] [PubMed] [Google Scholar]
- 4.Brown NF, Weis BC, Husti JE, Foster DW, McGarry JD. Mitochondrial carnitine palmitoyltransferase I isoform switching in the developing rat heart. J Biol Chem 270: 8952–8957, 1995. doi: 10.1074/jbc.270.15.8952. [DOI] [PubMed] [Google Scholar]
- 5.Ceccarelli SM, Chomienne O, Gubler M, Arduini A. Carnitine palmitoyltransferase (CPT) modulators: a medicinal chemistry perspective on 35 years of research. J Med Chem 54: 3109–3152, 2011. doi: 10.1021/jm100809g. [DOI] [PubMed] [Google Scholar]
- 6.Esser V, Britton CH, Weis BC, Foster DW, McGarry JD. Cloning, sequencing, and expression of a cDNA encoding rat liver carnitine palmitoyltransferase. I. Direct evidence that a single polypeptide is involved in inhibitor interaction and catalytic function. J Biol Chem 268: 5817–5822, 1993. [PubMed] [Google Scholar]
- 7.Esser V, Brown NF, Cowan AT, Foster DW, McGarry JD. Expression of a cDNA isolated from rat brown adipose tissue and heart identifies the product as the muscle isoform of carnitine palmitoyltransferase. I (M-CPT I). M-CPT I is the predominant CPT I isoform expressed in both white (epididymal) and brown adipocytes. J Biol Chem 271: 6972–6977, 1996. doi: 10.1074/jbc.271.12.6972. [DOI] [PubMed] [Google Scholar]
- 8.Kim T, He L, Johnson MS, Li Y, Zeng L, Ding Y, Long Q, Moore JF, Sharer JD, Nagy TR, Young ME, Wood PA, Yang Q. Carnitine palmitoyltransferase 1b deficiency protects mice from diet-induced insulin resistance. J Diabetes Metab 5: 361, 2014. doi: 10.4172/2155-6156.1000401. [DOI] [PMC free article] [PubMed] [Google Scholar]
- 9.Kim T, Moore JF, Sharer JD, Yang K, Wood PA, Yang Q. Carnitine palmitoyltransferase 1b deficient mice develop severe insulin resistance after prolonged high fat diet feeding. J Diabetes Metab 5: 5, 2014. doi: 10.4172/2155-6156.1000401. [DOI] [PMC free article] [PubMed] [Google Scholar]
- 10.McGarry JD, Brown NF. The mitochondrial carnitine palmitoyltransferase system. From concept to molecular analysis. Eur J Biochem 244: 1–14, 1997. doi: 10.1111/j.1432-1033.1997.00001.x. [DOI] [PubMed] [Google Scholar]
- 11.Price N, van der Leij F, Jackson V, Corstorphine C, Thomson R, Sorensen A, Zammit V. A novel brain-expressed protein related to carnitine palmitoyltransferase I. Genomics 80: 433–442, 2002. doi: 10.1006/geno.2002.6845. [DOI] [PubMed] [Google Scholar]
- 12.Ratner C, Madsen AN, Kristensen LV, Skov LJ, Pedersen KS, Mortensen OH, Knudsen GM, Raun K, Holst B. Impaired oxidative capacity due to decreased CPT1b levels as a contributing factor to fat accumulation in obesity. Am J Physiol Regul Integr Comp Physiol 308: R973–R982, 2015. doi: 10.1152/ajpregu.00219.2014. [DOI] [PubMed] [Google Scholar]
- 13.Schreurs M, Kuipers F, van der Leij FR. Regulatory enzymes of mitochondrial β-oxidation as targets for treatment of the metabolic syndrome. Obes Rev 11: 380–388, 2010. doi: 10.1111/j.1467-789X.2009.00642.x. [DOI] [PubMed] [Google Scholar]
- 14.Sepa-Kishi DM, Wu MV, Uthayakumar A, Mohasses A, Ceddia RB. Anti-lipolytic and anti-lipogenic effects of the CPT-1b inhibitor oxfenicine in the white adipose tissue of rats. Am J Physiol Regul Integr Comp Physiol 311: R779-R787, 2016. 10.1152/ajpregu.00243.2016. [DOI] [PMC free article] [PubMed] [Google Scholar]
- 15.Sierra AY, Gratacós E, Carrasco P, Clotet J, Ureña J, Serra D, Asins G, Hegardt FG, Casals N. CPT1c is localized in endoplasmic reticulum of neurons and has carnitine palmitoyltransferase activity. J Biol Chem 283: 6878–6885, 2008. doi: 10.1074/jbc.M707965200. [DOI] [PubMed] [Google Scholar]
- 16.Tam CS, Redman LM, Greenway F, LeBlanc KA, Haussmann MG, Ravussin E. Energy metabolic adaptation and cardiometabolic improvements one year after gastric bypass, sleeve gastrectomy, and gastric band. J Clin Endocrinol Metab 101: 3755–3764, 2016. doi: 10.1210/jc.2016-1814. [DOI] [PMC free article] [PubMed] [Google Scholar]
- 17.Vandanmagsar B, Warfel JD, Wicks SE, Ghosh S, Salbaum JM, Burk D, Dubuisson OS, Mendoza TM, Zhang J, Noland RC, Mynatt RL. Impaired mitochondrial fat oxidation induces FGF21 in muscle. Cell Reports 15: 1686–1699, 2016. doi: 10.1016/j.celrep.2016.04.057. [DOI] [PMC free article] [PubMed] [Google Scholar]
- 18.Vandanmagsar B, Youm YH, Ravussin A, Galgani JE, Stadler K, Mynatt RL, Ravussin E, Stephens JM, Dixit VD. The NLRP3 inflammasome instigates obesity-induced inflammation and insulin resistance. Nat Med 17: 179–188, 2011. doi: 10.1038/nm.2279. [DOI] [PMC free article] [PubMed] [Google Scholar]
- 19.Wicks SE, Vandanmagsar B, Haynie KR, Fuller SE, Warfel JD, Stephens JM, Wang M, Han X, Zhang J, Noland RC, Mynatt RL. Impaired mitochondrial fat oxidation induces adaptive remodeling of muscle metabolism. Proc Natl Acad Sci USA 112: E3300–E3309, 2015. doi: 10.1073/pnas.1418560112. [DOI] [PMC free article] [PubMed] [Google Scholar]
- 20.Woeltje KF, Esser V, Weis BC, Sen A, Cox WF, McPhaul MJ, Slaughter CA, Foster DW, McGarry JD. Cloning, sequencing, and expression of a cDNA encoding rat liver mitochondrial carnitine palmitoyltransferase II. J Biol Chem 265: 10720–10725, 1990. [PubMed] [Google Scholar]


