

Abstract
Key points
The prevalence of cardiorespiratory fitness (CRF) non‐response gradually declines in healthy individuals exercising 60, 120, 180, 240 or 300 min per week for 6 weeks.
Following a successive identical 6‐week training period but comprising 120 min of additional exercise per week, CRF non‐response is universally abolished.
The magnitude of CRF improvement is primarily attributed to changes in haemoglobin mass.
The potential for CRF improvement may be present and unveiled with appropriate exercise training stimuli in healthy individuals without exception.
Abstract
One in five adults following physical activity guidelines are reported to not demonstrate any improvement in cardiorespiratory fitness (CRF). Herein, we sought to establish whether CRF non‐response to exercise training is dose‐dependent, using a between‐ and within‐subject study design. Seventy‐eight healthy adults were divided into five groups (1–5) respectively comprising one, two, three, four and five 60 min exercise sessions per week but otherwise following an identical 6‐week endurance training (ET) programme. Non‐response was defined as any change in CRF, determined by maximal incremental exercise power output (W max), within the typical error of measurement (±3.96%). Participants classified as non‐responders after the ET intervention completed a successive 6‐week ET period including two additional exercise sessions per week. Maximal oxygen consumption (), haematology and muscle biopsies were assessed prior to and after each ET period. After the first ET period, W max increased (P < 0.05) in groups 2, 3, 4 and 5, but not 1. In groups 1, 2, 3, 4 and 5, 69%, 40%, 29%, 0% and 0% of individuals, respectively, were non‐responders. After the second ET period, non‐response was eliminated in all individuals. The change in with exercise training independently determined W max response (partial correlation coefficient, r partial ≥ 0.74, P < 0.001). In turn, total haemoglobin mass was the strongest independent determinant of (r partial = 0.49, P < 0.001). In conclusion, individual CRF non‐response to exercise training is abolished by increasing the dose of exercise and primarily a function of haematological adaptations in oxygen‐carrying capacity.
Keywords: cardiorespiratory fitness, hemoglobin mass, non‐response, trainability
Key points
The prevalence of cardiorespiratory fitness (CRF) non‐response gradually declines in healthy individuals exercising 60, 120, 180, 240 or 300 min per week for 6 weeks.
Following a successive identical 6‐week training period but comprising 120 min of additional exercise per week, CRF non‐response is universally abolished.
The magnitude of CRF improvement is primarily attributed to changes in haemoglobin mass.
The potential for CRF improvement may be present and unveiled with appropriate exercise training stimuli in healthy individuals without exception.
Abbreviations
- BV
blood volume
- CO
carbon monoxide
- CRF
cardiorespiratory fitness
- ET
endurance training
- [Hb]
haemoglobin concentration
- Hbmass
haemoglobin mass
- Hct
haematocrit
- HRmax
maximal heart rate
- MitoVD
mitochondrial volume density
- PV
plasma volume
- RBCV
red blood cell volume
- TE
typical error of measurement
maximal oxygen consumption
- Wmax
maximal power output
Introduction
Primary sources regarding the notion of physical activity as a means to preserve health emerged along with the inception of scientific medicine in ancient Greece (Potteiger, 2013). More than 2 millennia later, outstanding health benefits associated with physical activity have been demonstrated by modern experimental, epidemiological and clinical sciences (Morris et al. 1953; Lee et al. 1995; Church et al. 2007; Wen et al. 2011; Pedersen & Saltin, 2015). Daily vigorous exercise decreases cardiovascular, metabolic and all‐cause mortality by 40–70%, irrespective of age, sex and presence of disease (Wen et al. 2011). Many of these benefits are closely associated with improvements in cardiorespiratory fitness (CRF), as determined by maximal oxygen consumption () or incremental exercise power output (W max), independent of traditional risk factors (Joyner & Green, 2009; Lee et al. 2010). CRF is thus considered a key surrogate endpoint of exercise training interventions in healthy and diseased individuals (Laukkanen et al. 2001; Kodama et al. 2009).
Among exercise training modalities, CRF is particularly responsive to endurance training (ET). and W max commonly increase by an average of ∼3–35% at the group level with regular ET in a dose (exercise duration × intensity)‐dependent manner (Wenger & Bell, 1986; Church et al. 2007; Helgerud et al. 2007; Bouchard et al. 2011b; Bacon et al. 2013; Jacobs et al. 2013; Bonne et al. 2014; Montero et al. 2015a). and W max gains induced by a given dose of supervised ET are, however, not uniform at the individual level, one‐third of measurements being dispersed more than 1 standard deviation from the mean (Cohen & Holliday, 1979; Lortie et al. 1984; Bouchard et al. 2011b; Bacon et al. 2013). Importantly, some individuals seemingly do not demonstrate any improvement in with ET according to current dose recommendations (150 min of moderate endurance exercise per week) (Bouchard et al. 2011b; Garber et al. 2011). The prevalence of non‐responders has been reported to reach up to 20% among healthy individuals (Timmons et al. 2010), raising compelling challenges to personalized preventive medicine (Buford et al. 2013).
As a first step, it is fundamental to understand which factors contribute to interindividual differences in CRF trainability. In this regard, much attention has been paid to genetic determinants (Bouchard et al. 1999, 2011a,b; Bouchard, 2012; Timmons et al. 2010; Sarzynski et al. 2017). Twenty‐one single‐nucleotide polymorphisms were found to explain up to 50% of the individual response to 5 months of moderate ET in a cohort of 473 sedentary adults from the HERITAGE Family Study (HERITAGE henceforward) (Bouchard et al. 2011b). Approximately 8% of these individuals increased by 28% or more, whereas ∼7% demonstrated a change in of only 4% or less (Bouchard et al. 2011b). While these findings have to be replicated, the notion has spread that CRF trainability is essentially a matter of fate (Roth, 2008; Bouchard, 2012; Mosley, 2012). Yet, it is uncertain whether HERITAGE outcomes can be extrapolated to at‐risk or diseased populations and above all, it remains to be established whether or to what extent CRF non‐response is dose‐dependent.
The influence of ET dose on CRF non‐response was recently examined in three groups of obese adults exposed to three distinct levels of exercise amount and intensity for 6 months (Ross et al. 2015). CRF non‐response, as defined by any change in lower than the typical error of measurement (TE), was observed in 39, 18 and 0% of obese individuals, respectively randomized to low‐amount (180–300 kcal per session)–low‐intensity (50% ), high‐amount (360–600 kcal per session)–low‐intensity (50% ) or high‐amount (360–600 kcal per session)–high‐intensity (75% ) of ET, all including four to five exercise sessions per week (Ross et al. 2015). A similar decline in the prevalence of non‐responders was previously demonstrated in postmenopausal women allocated to four to five exercise sessions requiring 4, 8 or 12 kcal kg−1 per week during 6 months (Sisson et al. 2009). These studies therefore suggest that CRF non‐response might ultimately be the result of inadequate exercise stimuli. Nonetheless, it should be noted that only individuals who adhered to at least 90% of the prescribed exercise sessions were included in these analyses (Sisson et al. 2009; Ross et al. 2015). It thus cannot be discounted that non‐responders were primarily excluded by study design. To unequivocally overcome this issue, CRF non‐responders should first be identified and then subjected to higher dose ET (Mann et al. 2014). This may be ideally addressed using a repeated ET intervention, which likewise would limit the influence of within‐subject response variability, a well‐known source of confounding in the clinical arena but uncertain concerning exercise training studies (Senn et al. 2011; Hecksteden et al. 2015).
Therefore, we assessed the response of CRF to ET in healthy young individuals divided into five groups comprising one, two, three, four or five 60 min exercise sessions per week during 6 weeks. We used this relatively short length of ET in order to secure a high prevalence of CRF non‐responders while still provoking extensive physiological responses at the group level (Montero et al. 2015a). Likewise, W max was chosen as the primary CRF outcome because its TE, as measured in our laboratory, is lower compared with that frequently reported for (∼5%) (Shephard et al. 2004); indeed, the relatively large contribution of test–retest errors in to the individual response to ET has been a matter of controversy concerning seminal studies in the current subject (Shephard et al. 2004; Hecksteden et al. 2015). Individuals identified as non‐responders subsequently completed an identical 6‐week ET period but including two additional exercise sessions per week, thereby augmenting the ET dose dispensed. In addition, as well as potential haematological and skeletal muscle determinants of W max were assessed prior to and after each ET period with the intent to determine physiologically relevant parameters that may explain variations in trainability.
Methods
Participants
Seventy‐eight healthy young male volunteers [age (mean ± SD) = 26.2 ± 3.4 years, height (mean ± SD) = 180.8 ± 4.3 cm] were recruited to participate in the study. To this end, ads were placed at the university campus looking for untrained individuals. As inclusion criteria, individuals had to be to males between 18 and 35 years of age not participating in organized sports, non‐smokers and medication free. Cycling and walking for commuting purposes were allowed. The protocol was approved by the local ethical committee (EK 2011‐N‐51) and conducted in accordance with the Declaration of Helsinki. Prior to the start of the experiments, informed oral and written consents were obtained from all participants.
Experimental design
All individuals underwent a first period of supervised training for 6 weeks consisting of 60 min sessions of cycle ergometer exercise. Individuals could chose to participate in five groups differing in the number of exercise sessions per week. Groups 1, 2, 3, 4 and 5 performed one, two, three, four and five exercise sessions per week, respectively, corresponding to 60, 120, 180, 240 and 300 min per week in total. Four different intensity profiles, comprising moderate continuous exercise and high‐intensity intervals, were alternated to facilitate participant motivation and compliance, as detailed previously (Robach et al. 2014).
Profile 1 consisted of a steady‐state exercise, i.e. 60 min at 65% of peak power output (W max) attained with the incremental exercise test.
Profile 2 started with 11.25 min at 65% of W max followed by 0.5 min at 130%, 1.25 min at 50%, 0.5 min at 130%, 1 min at 50%, 11.25 min at 65%, 0.5 min at 130%, 1.25 min at 50%, 0.5 min at 130%, 1.25 min at 50%, 0.5 min at 130%, 1 min at 50%, 11.25 min at 65%, 0.5 min at 130%, 1.25 min at 50%, 0.5 min at 130%, 1.25 min at 50%, 0.5 min at 130%, 1.25 min at 50%, 0.5 min at 130%, 1 min at 50% and 11.25 min at 65% W max.
Profile 3 started with 3 min at 50% of W max followed by 3 min at 60%, 3 min at 65%, 3 min at 70%, 3 min at 75%, 3 min at 70%, 3 min at 65%, 3 min at 60%, 3 min at 50%, 3 min at 65%, 3 min at 5%, 3 min at 60%, 3 min at 65%, 3 min at 70%, 3 min at 75%, 3 min at 70%, 3 min at 65%, 3 min at 60%, 3 min at 50% and 3 min at 65% W max.
Profile 4 started with 6 min at 65% of W max followed by 4 min at 75%, 6 min at 65%, 4 min at 75%, 6 min at 65%, 4 min at 75%, 6 min at 65%, 4 min at 75%, 6 min at 65%, 4 min at 75%, 6 min at 65% and 4 min at 75% W max.
Each profile had an average exercise intensity of 65% of W max for 60 min. Workloads were calculated from individual W max determined during the incremental exercise test at baseline. CRF non‐response was determined using the TE (Hopkins, 2000). TE is a measure of technological error and day‐to‐day biological variation. It was calculated by the standard error of within‐subject standard deviation from duplicate W max assessments, and expressed as a percentage of the individual's mean W max (i.e. in the form of a coefficient of variation). Any percentage change in W max not beyond ±1 × %TE was considered a non‐response. Based on repeated testing at baseline in all individuals, CRF non‐response was calculated to be ±3.96% for W max. The average of duplicate W max assessments was considered the baseline W max for each individual. Less than 7 days after the end of the initial ET period, non‐responders in each exercise group started a second 6‐week ET program identical to the former but adding two exercise sessions per week. The measures described below were determined prior to and after the first ET period as well as following the second ET period.
Experimental measures
Incremental exercise test
W max and were determined on an electronically braked bicycle ergometer (Monark, Vansbro, Sweden) with continuous measurements of using an online gas collection system (Innocor M400, Innovision, Glamsbjerg, Denmark). The test started with a warm‐up period of 5 min at 50–150 W workloads. Thereafter, the workload was increased by 30 W every 60 s until exhaustion. The gas analysers and the flowmeter of the applied spirometer were calibrated prior to each test. Breath‐by‐breath values were averaged over 30 s. The highest average value was taken as the provided that standard criteria were fulfilled (American Thoracic Society, 2003). W max was calculated as W compl + 30(t/60), where W compl is the last fully completed workload and t is the number of seconds in the final workload.
Blood
Haemoglobin mass (Hbmass) was measured as previously described (Siebenmann et al. 2015), using a modified version of the carbon monoxide (CO) re‐breathing technique (Burge & Skinner, 1995). All individuals rested for 20 min in a semi‐recumbent position before each measurement. Thereafter, 2 ml of blood was sampled from an antecubital vein via a 20‐G venflon catheter (BD, Franklin Lakes, NJ, USA) and analysed immediately in quadruplicate for (i) percentage carboxyhaemoglobin and Hb concentration ([Hb]) using a haemoximeter (ABL800, Radiometer, Denmark), and (ii) haematocrit (Hct) with the micromethod (4 min at 13,500 rpm). Subsequently, the subject breathed 100% oxygen for 4 min to flush the nitrogen from the airways. After closing the oxygen input, a bolus 1.5 ml kg−1 of 99.997% chemically pure CO (CO N47, Air Liquide, Paris, France) was administrated into the breathing circuit. The subjects rebreathed this gas mixture for 10 min. Then, an additional 2 ml blood sample was obtained and analysed in quadruplicate. The change in percentage carboxyhaemoglobin was used to calculate Hbmass, taking into account the amount of CO that remained in the rebreathing circuit at the end of the procedure (2.2%) (Burge & Skinner, 1995). Total red blood cell volume (RBCV), blood volume (BV) and plasma volume (PV) were derived from measures of Hbmass and Hct (Burge & Skinner, 1995).
Skeletal muscle biopsies
Using the Bergström technique (Bergstrom, 1962) with a needle modified for suction, skeletal muscle biopsies from m. vastus lateralis were obtained under local anaesthetics while the subject was at rest with a minimum of 24 h following the last exercise training bout. The biopsy specimen was dissected free of fat and connective tissue, divided into sections and immediately prepared for analysis as stated below.
Mitochondrial volume density
Four 1 mm3 pieces of each muscle biopsy were fixed in 2.5% glutaraldehyde at room temperature and processed according to standard electron‐microscopy protocols. Transition electron microscopy images were obtained in a FEI Tecnai G2 Spirit electron microscope (FEI, Hillsboro, OR, USA) with an Orius SC1000 CCD camera (Gatan, Pleasanton, CA, USA) and interfaced with the transition electron microscope user software (from FEI). Two hundred and sixteen images per biopsy were acquired in a random systematic order from 24 meshes distributed on eight grids from four blocks. The Cavalieri feature in the Stereo‐Investigator software (MBF Bioscience, Williston, VT, USA) was used to estimate mitochondrial volume density (MitoVD) by point counting (West, 2012). The grid spacing was 1 μm along both x‐ and y‐axes. Mitochondria boundaries were recognized at the x8200 magnification. Each point was assigned as one of mitochondria, muscle or ‘nothing’. MitoVD was expressed as the percentage of muscle tissue occupied by mitochondria. MitoVD was not assessed after the second training period.
Statistical analysis
Statistical analyses were performed using SPSS Statistics v. 22.0 (IBM Corp., Armonk, NY, USA). Data were tested for normal distribution with the Kolmogorov–Smirnov test and for homogeneity of variances with Levene's test. One‐way ANOVA with Bonferroni correction for multiple comparisons was used to compare continuous baseline variables among groups. To examine the impact of the frequency of exercise sessions on the effects of exercise training, a one‐way ANOVA was applied including baseline values as covariates and Bonferroni correction for multiple comparisons. When F was significant in the ANOVA, planned pair‐wise specific comparisons were carried out. Effects of exercise training on studied variables in each group were assessed by Student's paired t test. The proportion of CRF non‐responders was compared among groups with the chi‐square test. Finally, multiple regression analysis was used to identify variables independently associated with absolute changes (post‐training minus pre‐training, ∆) in W max or , including first and second ET periods. Variables significantly associated with ∆W max or ∆ in univariate analyses, as determined by Pearson's correlation coefficients, were entered into the regression model as independent variables. In the case of high correlation between independent variables, each of these were separately entered into the regression model in order to avoid high multicollinearity (variance inflation factor >10). A two‐tailed P‐value less than 0.05 was considered significant. Data are reported as the mean (±SD) unless otherwise stated.
Results
Baseline
Characteristics of study groups prior to ET are summarized in Table 1. Body weight, haematological values (Hct, Hb, Hbmass, PV, RBCV, BV), skeletal muscle MitoVD and were similar between groups (P > 0.05). The only difference between groups was observed with regard to W max, which was higher in group 5 compared with group 3 as expressed in either absolute (W) or relative (W kg−1) units (P < 0.05).
Table 1.
Baseline characteristics of study groups (n = 78)
| Exercise sessions per week | ||||||
|---|---|---|---|---|---|---|
| 1 (n = 16) | 2 (n = 15) | 3 (n = 14) | 4 (n = 17) | 5 (n = 16) | ANOVA P‐value | |
| Body weight (kg) | 76.6 ± 5.8 | 76.8 ± 4.8 | 77.7 ± 5.7 | 77.8 ± 8.8 | 79.8 ± 5.9 | 0.654 |
| Hct (%) | 43.8 ± 2.3 | 43.4 ± 1.6 | 43.9 ± 2.1 | 43.0 ± 1.6 | 43.5 ± 2.2 | 0.752 |
| Hb (g dl−1) | 14.6 ± 0.7 | 14.4 ± 0.6 | 14.9 ± 0.7 | 14.8 ± 0.6 | 14.5 ± 0.8 | 0.229 |
| Hbmass (g) | 847 ± 84 | 878 ± 151 | 826 ± 103 | 841 ± 113 | 761 ± 101 | 0.064 |
| PV (ml) | 3266 ± 532 | 3440 ± 501 | 3077 ± 376 | 3246 ± 453 | 2976 ± 430 | 0.065 |
| RBCV (ml) | 2521 ± 262 | 2640 ± 452 | 2408 ± 299 | 2454 ± 362 | 2288 ± 301 | 0.070 |
| BV (ml) | 5787 ± 772 | 6080 ± 935 | 5486 ± 637 | 5700 ± 792 | 5264 ± 696 | 0.054 |
| MitoVD (%)a | 4.62 ± 1.42 | 4.80 ± 1.14 | 4.89 ± 1.09 | 3.86 ± 0.91 | 4.32 ± 1.21 | 0.169 |
| HRmax (bpm) | 188 ± 5 | 185 ± 7 | 187 ± 7 | 188 ± 6 | 187 ± 7 | 0.736 |
| RERmax | 1.15 ± 0.05 | 1.15 ± 0.09 | 1.17 ± 0.06 | 1.13 ± 0.05 | 1.14 ± 0.07 | 0.510 |
| (ml min−1) | 3214 ± 507 | 3412 ± 736 | 3376 ± 438 | 3449 ± 514 | 2956 ± 435 | 0.069 |
| (ml min−1 kg−1) | 42.4 ± 8.5 | 44.7 ± 10.7 | 43.4 ± 4.2 | 44.5 ± 5.8 | 37.4 ± 7.5 | 0.057 |
| W max (W) | 269 ± 44 | 289 ± 66 | 297 ± 42 | 266 ± 48 | 239 ± 403 | 0.015 |
| W max (W kg−1) | 3.54 ± 0.70 | 3.80 ± 0.95 | 3.82 ± 0.45 | 3.42 ± 0.48 | 3.02 ± 0.6123 | 0.008 |
BV, blood volume; Hbmass, haemoglobin mass; Hct, haematocrit; HRmax, maximal heart rate; MitoVD, mitochondrial volume density; PV, plasma volume; RBCV, red blood cell volume; RERmax, maximal respiratory exchange ratio; , maximal oxygen consumption; W max, maximal power output. Superscript numbers (1, 2, 3, 4, 5) correspond to differences (P < 0.05) between groups (1, 2, 3, 4, 5). aMitoVD values were not available in all study subjects (sample size of 15, 14, 11, 15, 14 in groups 1, 2, 3, 4 and 5, respectively). Values in bold are significant.
First exercise training period
Table 2 presents absolute changes (Δ) after the first ET period in each group. A decrease in body weight with training was only observed in groups 4 and 5 (P < 0.05). MitoVD increased in all groups (P < 0.05). Hbmass, RBCV, BV, and W max increased in all groups (P < 0.05) except for group 1. With respect to the comparisons of Δ among groups, Δbody weight was lower (negative) in group 5 compared with groups 1, 2 and 3 (P < 0.05). Moreover, ΔMitoVD was higher in groups 4 and 5 versus groups 1 and 2 (P < 0.05). ΔHbmass, ΔRBCV, ΔBV and Δ were higher in group 5 compared with any other group (P < 0.05). ΔW max was higher in groups 4 and 5 versus groups 1, 2 and 3 (P < 0.05). Analyses with percentage (instead of Δ) changes and/or without covariate adjustment gave similar results. Figure 1 illustrates individual percentage changes in W max after the first ET period. The prevalence of W max non‐response was 69% (11 of 16 individuals), 40% (6 of 15), 29% (4 of 14), 0% (0 out of 17) and 0% (0 out of 16) for groups 1, 2, 3, 4 and 5, respectively (P < 0.001). The average percentage change in W max of non‐responder individuals was −1%, −1% and 2% for groups 1, 2 and 3, respectively. Whilst not measured in the current study, provided a TE for of 5% (Shephard et al. 2004), the prevalence of non‐response would be 81% (13 of 16 individuals), 47% (7 of 15), 50% (7 of 14), 18% (3 out of 17) and 0% (0 out of 16) for groups 1, 2, 3, 4 and 5, respectively.
Table 2.
Absolute changes (∆) after the first exercise training period
| Exercise sessions per week | ||||||
|---|---|---|---|---|---|---|
| 1 (n = 16) | 2 (n = 15) | 3 (n = 14) | 4 (n = 17) | 5 (n = 16) | ANOVA P‐value a | |
| ∆Body weight (kg) | −0.21 ± 1.26 | −0.23 ± 0.94 | −0.39 ± 1.96 | −1.38 ± 1.96* | −2.75 ± 0.98* 123 | <0.001 |
| ∆Hct (%) | 0.03 ± 1.15 | −0.31 ± 1.28 | −0.91 ± 2.64 | −1.33 ± 1.31* | 0.20 ± 1.244 | 0.024 |
| ∆Hb (g dl−1) | 0.03 ± 0.38 | −0.04 ± 0.43 | −0.18 ± 0.65 | −0.10 ± 0.56 | −0.00 ± 0.42 | 0.919 |
| ∆Hbmass (g) | 15.6 ± 39.4 | 40.0 ± 43.6* | 34.3 ± 35.8* | 44.9 ± 40.4* | 137 ± 51.7* 1234 | <0.001 |
| ∆PV (ml) | 31 ± 294 | 203 ± 206* | 263 ± 386* | 55 ± 253 | 555 ± 250* 124 | <0.001 |
| ∆RBCV (ml) | 28 ± 150 | 108 ± 129* | 105 ± 99* | 177 ± 147* 1 | 398 ± 158* 1234 | <0.001 |
| ∆BV (ml) | 59 ± 429 | 311 ± 296* | 368 ± 446* | 232 ± 371* | 953 ± 376* 1234 | <0.001 |
| ∆MitoVD (%)b | 0.48 ± 0.27* | 0.74 ± 0.43* | 1.66 ± 0.50* 1 | 2.15 ± 1.18* 12 | 1.92 ± 1.32* 12 | <0.001 |
| ∆ (ml min−1) | 27 ± 161 | 152 ± 178* | 156 ± 174* | 424 ± 207* 123 | 707 ± 311* 1234 | <0.001 |
| ∆ (ml min−1 kg−1) | 0.42 ± 2.40 | 2.19 ± 2.39* | 2.47 ± 1.90* | 6.50 ± 2.98* 123 | 10.49 ± 3.9* 1234 | <0.001 |
| ∆W max (W) | 3.13 ± 12.65 | 13.13 ± 17.4* | 21.18 ± 12.3* | 63.37 ± 24.6* 123 | 75.75 ± 31.3* 123 | <0.001 |
| ∆W max (W kg−1) | 0.05 ± 0.17 | 0.19 ± 0.23* | 0.30 ± 0.16* | 0.92 ± 0.39* 123 | 1.09 ± 0.40* 123 | <0.001 |
BV, blood volume; Hbmass, haemoglobin mass; Hct, haematocrit; MitoVD, mitochondrial volume density; PV, plasma volume; RBCV, red blood cell volume; , maximal oxygen consumption; W max, maximal power output; ∆, post‐ minus pre‐training absolute change.
* P < 0.05 post‐training versus pre‐training. Superscript numbers (1, 2, 3, 4, 5) correspond to differences (P < 0.05) between groups (1, 2, 3, 4, 5). aBaseline values included as covariates. bMitoVD values were not available in all study subjects (sample size of 13, 12, 9, 15, 12 in groups 1, 2, 3, 4 and 5, respectively). Values in bold are significant.
Figure 1. Individual percentage changes in maximal power output (W max) after the first exercise training period in each group.
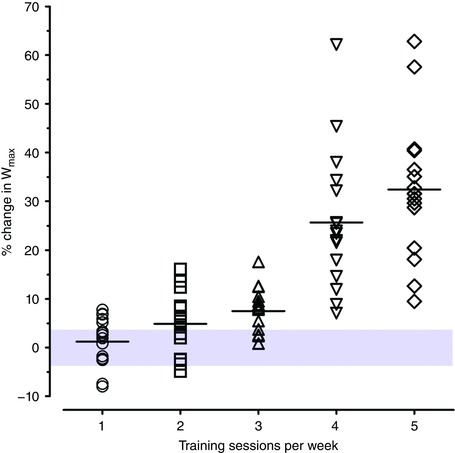
The typical error of measurement (%TE) for W max measurement is illustrated by the shaded area. Values within this area represent non‐response. Non‐response was 69% (11 of 16), 40% (6 of 15), 29% (4 of 14), 0% (0 out of 17) and 0% (0 out of 16) for groups 1, 2, 3, 4 and 5, respectively. [Color figure can be viewed at wileyonlinelibrary.com]
Second exercise training period
Non‐responders to the first ET period subsequently performed a second ET intervention including two additional training sessions per week. Paired comparisons were performed after the second ET period versus baseline (prior to the first ET period) in non‐responder individuals, thus assessing the total impact of both training periods in each group (n = 11, group 1 + 2; n = 6, group 2 + 2; n = 4, group 3 + 2). Body weight decreased in group 2 + 2 (P < 0.05). Hbmass, RBCV, BV, and W max increased in all groups (1 + 2, 2 + 2, 3 + 2; P < 0.05). MitoVD was not assessed after the second ET period. Analyses with percentage (instead of Δ) changes and/or without covariate adjustment gave similar results. Figure 2 displays individual percentage changes in W max after the first and second ET periods for non‐responder individuals. Non‐response was not observed after the second ET period in any individual.
Figure 2. Individual percentage changes in maximal power output (W max) after the second exercise training period for non‐responders in each group.
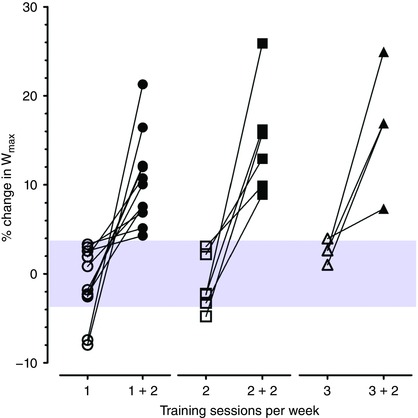
The typical error of measurement (%TE) for W max measurement is illustrated by the shaded area. Values within this area represent non‐response. Non‐response was abolished after the second exercise training period in all individuals. [Color figure can be viewed at wileyonlinelibrary.com]
Determinants of changes in ∆W max and ∆
In univariate analysis, ∆ (r = 0.85, P < 0.001), ∆Hbmass (r = 0.64, P < 0.001), ∆RBCV (r = 0.62, P < 0.001), ∆BV (r = 0.53, P < 0.001), ∆PV (r = 0.42, P < 0.001) and ∆MitoVD (r = 0.26, P = 0.043) were positively whereas ∆body weight (r = −0.29, P = 0.003) was negatively associated with ∆W max. Moreover, ∆Hbmass (r = 0.64, P < 0.001), ∆RBCV (r = 0.62, P < 0.001), ∆BV (r = 0.52, P < 0.001) and ∆PV (r = 0.42, P < 0.001) were positively and ∆body weight (r = –0.25, P = 0.012) negatively associated with ∆. Accordingly, ∆Hbmass, ∆RBCV, ∆PV, ∆BV, ∆MitoVD, ∆ and ∆body weight were entered into the regression model as potential independent determinants of ∆W max (Table 3), while ∆Hbmass, ∆RBCV, ∆PV, ∆BV and ∆body weight were entered as potential independent determinants of ∆ (Table 4). ∆ remained the only variable independently associated with ∆W max (β = 0.08, r partial ≥ 0.74, P < 0.001). In turn, ∆Hbmass was the strongest independent determinant of ∆ (β = 3.26, r partial = 0.49, P < 0.001).
Table 3.
Multiple linear regression with ∆W max as the dependent variable
| Model | β (95% CI) | r partial | P | Adjusted R 2 | P |
|---|---|---|---|---|---|
| Model 1 | |||||
| ∆Body weight (kg) | −0.001 (−0.004, 0.001) | −0.137 | 0.307 | 0.72 | < 0.001 |
| ∆Hbmass (g) | 0.072 (−0.062, 0.207) | 0.142 | 0.287 | ||
| ∆PV (ml) | 0.003 (−0.017, 0.022) | 0.035 | 0.797 | ||
| ∆MitoVD (%) | 2.170 (−1.979, 6.318) | 0.139 | 0.299 | ||
| ∆ (ml) | 0.080 (0.060, 0.100) | 0.738 | < 0.001 | ||
| Model 2 (including RBCV instead of Hbmass) | |||||
| ∆Body weight (kg) | −0.002 (−0.005, 0.001) | −0.158 | 0.235 | 0.72 | < 0.001 |
| ∆RBCV (ml) | 0.023 (−0.020, 0.067) | 0.143 | 0.283 | ||
| ∆PV (ml) | 0.023 (−0.020, 0.067) | 0.143 | 0.283 | ||
| ∆MitoVD (%) | 1.988 (−2.256, 6.232) | 0.124 | 0.352 | ||
| ∆ (ml·min−1) | 0.080 (0.061, 0.100) | 0.742 | < 0.001 | ||
| Model 3 (including BV instead of Hbmass, PV and RBCV) | |||||
| ∆Body weight (kg) | −0.002 (−0.004, 0.001) | −0.166 | 0.210 | 0.73 | < 0.001 |
| ∆BV (ml) | 0.008 (−0.003, 0.019) | 0.181 | 0.170 | ||
| ∆MitoVD (%) | 2.462 (−1.569, 6.492) | 0.160 | 0.226 | ||
| ∆ (ml min−1) | 0.083 (0.065, 0.101) | 0.773 | < 0.001 | ||
β, unstandardized regression coefficient with W max (W) as outcome; BV, blood volume; CI, confidence interval; Hbmass, haemoglobin mass; MitoVD, mitochondrial volume density; PV, plasma volume; RBCV, red blood cell volume; r partial, partial correlation coefficient; , maximal oxygen consumption; W max, maximal power output; ∆, post‐ minus pre‐training absolute change. ∆Hbmass, ∆RBCV and ∆PV were closely correlated with ∆BV in bivariate analyses (r > 0.80, P < 0.0001), and thus these variables were appropriately entered into a regression model in order to avoid high multicollinearity (variance inflation factor >10). Values in bold are significant.
Table 4.
Multiple linear regression with ∆ as the dependent variable
| Model | β (95% CI) | r partial | P | Adjusted R 2 | P |
|---|---|---|---|---|---|
| Model 1 | |||||
| ∆Body weight (kg) | −0.021 (−0.051, 0.008) | −0.147 | 0.153 | 0.41 | < 0.001 |
| ∆Hbmass (g) | 3.262 (2.076, 4.448) | 0.491 | < 0.001 | ||
| ∆PV (ml) | 0.015 (−0.019, 0.219) | 0.015 | 0.884 | ||
| Model 2 (including RBCV instead of Hbmass) | |||||
| ∆Body weight (kg) | −0.032 (−0.061, −0.002) | −0.218 | 0.033 | 0.39 | < 0.001 |
| ∆RBCV (ml) | 1.002 (0.620, 1.384) | 0.473 | < 0.001 | ||
| ∆PV (ml) | −0.031 (−0.253, 0.191) | −0.029 | 0.884 | ||
| Model 3 (including BV instead of Hbmass, PV and RBCV) | |||||
| ∆Body weight (kg) | −0.042 (−0.072, −0.012) | −0.273 | 0.007 | 0.31 | < 0.001 |
| ∆BV (ml) | 0.330 (0.223, 0.436) | 0.531 | < 0.001 | ||
β, unstandardized regression coefficient with (ml) as outcome; BV, blood volume; CI, confidence interval; Hbmass, haemoglobin mass; PV, plasma volume; RBCV, red blood cell volume; r partial, partial correlation coefficient; , maximal oxygen consumption; ∆, post minus pre training absolute change. ∆Hbmass, ∆RBCV and ∆PV were closely correlated with ∆BV in bivariate analyses (r > 0.80, P < 0.0001), thus these variables were appropriately entered into a regression model in order to avoid high multicollinearity (variance inflation factor > 10). Values in bold are significant.
Discussion
The present study tested the prevalence of CRF non‐response, as defined by any change of W max not surpassing %TE, with a double 6‐week ET protocol in 78 healthy individuals. The key findings are the following: (i) after the first ET period, the prevalence of CRF non‐response was 69, 40 and 29% in individuals training for 60, 120 and 180 min per week, respectively, and was absent (0%) in those training for 240 and 300 min per week; (ii) CRF non‐response was completely eliminated following the second 6‐week ET period including two extra 60 min sessions per week; and (iii) CRF (non‐)response was underlain by changes in Hbmass.
While the existence of interindividual response variability to exercise training is beyond dispute, less convincing is the generalized idea that a substantial fraction (∼20%) of individuals fail to improve CRF following intense ET (Timmons et al. 2010). Supporting evidence primarily derives from HERITAGE, in which 473 Caucasian adults (51% females) completed three exercise sessions per week progressively increasing their length from 30 to 50 min and intensity from 55% to 75% of maximal heart rate (HRmax), during 5 months (Bouchard et al. 1995; Timmons et al. 2010). The HERITAGE ET program thus reached the low end of current recommendations as regards exercise time per week (150 min) and did not comprise high intensity exercise (≥ 80% HRmax) (Garber et al. 2011). Of note, since exercise intensity was controlled by heart rate monitoring, interindividual fluctuations in training workload did occur and partly explained responses to ET in HERITAGE (Sarzynski et al. 2016). Most importantly, meta‐analytical evidence encompassing research performed during the last four decades suggests that higher doses of ET than those prescribed in HERITAGE can generate substantial improvements in in nearly all young and middle‐aged adults (Bacon et al. 2013). Likewise, recent studies have observed gradual decreases in the number of CRF non‐responders with increasing doses of ET in individuals who completed ≥ 90% of the exercise sessions prescribed (Sisson et al. 2009; Ross et al. 2015). A key limitation of these studies, however, is the potential presence of CRF non‐responders in individuals who dropped out or failed to complete the minimum number of exercise sessions. Definitive proof that CRF non‐responders may benefit from higher ET doses can only be provided by within‐subject study designs (Mann et al. 2014; Hecksteden et al. 2015), as originally applied in the current study and discussed hereunder.
We sought to determine CRF trainability with a repeated 6‐week ET intervention combining moderate continuous with high intensity exercise intervals in 60 min sessions. In the first ET period, individuals from five groups only differing in the number of sessions (1–5) and thus exercise dose per week were compared. In more than 20% of individuals allocated to one (60 min), two (120 min) or three (180 min) sessions of ET per week, W max did not increase (−1, −1 and 2%, respectively) more than 1 × %TE (4%) and hence they were considered as CRF non‐responders. Afterwards, CRF non‐responders accomplished a second ET period including 2 × 60 min additional sessions per week of otherwise identical training. After this additional training period CRF non‐response was no longer present in any individual. This unequivocally demonstrates that CRF non‐response was not inexorably predetermined in the study subjects and suggests that the potential for CRF improvements might well be present and unveiled with appropriate stimuli in healthy individuals without exception. Such unanimous CRF response may also indicate a relatively minor influence of within‐subject response variability and measurement error when applying successive higher doses of ET (Bacon et al. 2013; Hecksteden et al. 2015).
Despite our data clearly denoting the spurious nature of CRF non‐response, a wide interindividual variability in CRF improvements to identical ET dose is plainly illustrated in Figs 1 and 2. Certainly, hereditary factors must be assumed to play a role on CRF trainability (Bouchard et al. 1999), although family‐ and large population‐based confirmatory/replication studies are needed (Thomis, 2008). In addition, an often overlooked factor is the typical use of some percentage of HRmax, or W max to prescribe exercise intensity, which does not effectively standardize the homeostatic stress caused by ET at the individual level (Meyer et al. 1999; Gaskill et al. 2001; Scharhag‐Rosenberger et al. 2010). Therefore, provided a given ET dose, individuals may experience diverse magnitudes of stimuli for adaptive responses. Furthermore, a perfectly identical exercise dose prescription for any individual may prompt distinct homeostatic stress according to its interaction with oscillating factors such as sleep and nutrition, both affecting recovery and readiness to train (Kentta & Hassmen, 1998; Samuels, 2009; Hawley et al. 2011). Collectively considered, a comparable homeostatic stress among individuals involved in ET, as commonly prescribed, seems unlikely (Mann et al. 2014). It follows that a certain degree of interindividual variability in CRF trainability to a fixed ET dose may be generally expected by default due to lack of truly standardized exercise stimuli.
The question arises as to whether variability in CRF response to ET lies upon a firm mechanistic basis. ET is commonly associated with a surfeit of phenotypic modifications along the O2 transport and utilization chain – from lung to mitochondria – all potentially contributing to and W max improvements via enhancing convective oxygen delivery to and/or extraction by active tissue (Hawley & Noakes, 1992; Helgerud et al. 2007; Boushel et al. 2011; Lundby & Montero, 2015; Montero et al. 2015a; Wagner, 2015). The bulk of evidence indicates that haemodynamic and haematological systemic adaptations increasing the capacity to deliver oxygen predominantly explain improvements with short‐term (5–11 weeks) ET in healthy individuals (Montero & Diaz‐Canestro, 2015; Montero et al. 2015b). Empirical evidence demonstrates that the increase in with 6 weeks of moderate‐to‐high intensity ET is primarily attributed to augmented circulating RBCV and oxygen‐carrying capacity of blood, as reflected by increases in total circulating Hbmass (Bonne et al. 2014; Montero et al. 2015a). In turn, increases in skeletal muscle capillarization and MitoVD, both possibly facilitating oxygen extraction, do not seem to contribute substantially to the increase in after 6 weeks of ET (Montero et al. 2015a). Concurring with the above, in the present study increases (∆) in Hbmass were the strongest determinants of ∆, which in turn explained most of the variance in ∆W max. Yet, approximately half of the variance in ∆ remained unexplained, which could be partially attributed to non‐assessed adaptations modulating cardiac output and its distribution (Boushel et al. 2014; Lundby et al. 2017). The parallelism between changes in and underlying phenotypic modifications measured in this study implies the presence of quantitative but not major qualitative differences in either homeostatic stress induced by ET or adaptive capacity on an individual basis. Ultimately, it is worth noticing that the genetic bases of crucial physiological pathways governing convective oxygen delivery have not been identified (Sarzynski et al. 2016).
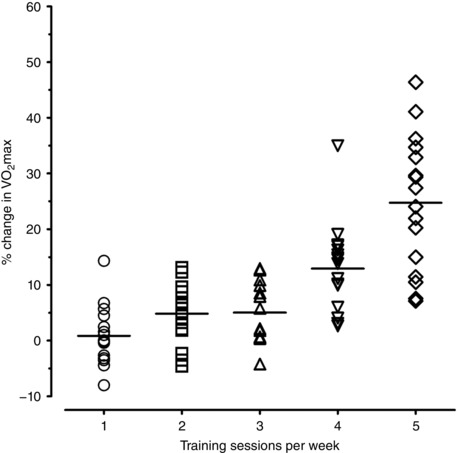
Another important outcome of this study was the magnitude of increases in CRF at the group level according to ET dose. Increases in W max with 240 or 300 min were substantial (24 and 32%) and higher compared with uniformly small W max changes observed with 60, 120 or 180 min of training per week (1, 5 and 7%, respectively) (Fig. 1). Similar findings were obtained regarding (Fig. 3). Part of this gap could be attributed to lower Hbmass in the 300 min group prior to ET (P = 0.064) facilitating greater adaptations, albeit baseline values were included as covariates. Regardless, the critical duration of exercise for CRF improvements with moderate–high intensity ET may lie somewhere between > 180 ≤ 240 min per week for most individuals. This finding concurs with previous reports suggesting raising the minimum level of exercise dose in physical activity guidelines for healthy adults (Bacon et al. 2013; Ross et al. 2015).
Figure 3. Individual percentage changes in maximal oxygen consumption () after the first exercise training period in each group.
Limitations
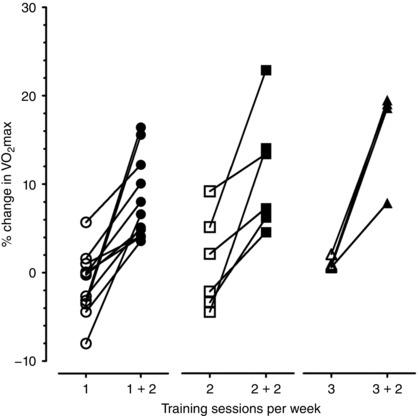
Findings were obtained from a sample of healthy young males. Further research will elucidate whether current conclusions can be extrapolated to populations including females, older individuals and/or cardio‐metabolic patients. Moreover, this study was designed to dissect the independent contribution of overall ET dose, but not of its components (frequency/length of exercise sessions, total duration, intensity). In addition, measurements were not duplicated at baseline and therefore %TE for was not calculated. Nonetheless, and W max responses were closely associated and all W max non‐responders increased their with higher ET dose (Figs 3 and 4). Finally, changes in body composition potentially influencing CRF were not assessed.
Figure 4. Individual percentage changes in maximal oxygen consumption () after the second exercise training period for non‐responders (according to changes in maximal power output; W max) in each group.
Conclusion
This study fundamentally challenges the notion of CRF non‐response to exercise training. In 78 healthy individuals performing moderate‐to‐high intensity ET for 6 weeks, the prevalence of CRF non‐response, as determined by W max, gradually declined in individuals exercising 60, 120 or 180 min per week. No vestige of W max non‐response was observed in individuals training 240 or 300 min per week. Following a successive 6‐week ET period comprising 120 min of additional ET per week, W max non‐response was universally abolished. Consistent with sound experimental evidence, haematological adaptations in oxygen‐carrying capacity underlay and thereby W max (non‐)responses to ET. These findings highlight the need to re‐evaluate contemporary concepts about human untrainability and exercise prescription.
Additional information
Competing interests
The authors declare no conflict of interest with the present study.
Author contributions
Conception and design of experiments: C.L. Collection, analysis and interpretation: C.L. and D.M. Drafting the article or revising it critically for important intellectual content: D.M. and C.L. Both authors have approved the final version of the manuscript and agree to be accountable for all aspects of the work. All persons designated as authors qualify for authorship, and all those who qualify for authorship are listed.
Funding
Funding was received from the Zürich Center for Integrative Human Physiology.
Linked articles This article is highlighted by a Perspective by Joyner. To read this Perspective, visit https://doi.org/10.1113/JP274031.
This is an Editor's Choice article from the 1 June 2017 issue.
References
- American Thoracic Society (2003). ATS/ACCP Statement on cardiopulmonary exercise testing. Am J Respir Crit Care Med 167, 211–277. [DOI] [PubMed] [Google Scholar]
- Bacon AP, Carter RE, Ogle EA & Joyner MJ (2013). VO2max trainability and high intensity interval training in humans: a meta‐analysis. PLoS One 8, e73182. [DOI] [PMC free article] [PubMed] [Google Scholar]
- Bergstrom J (1962). Muscle electrolytes in man. Scand J Clin Lab Invest 14 Suppl 68, 1–110. [Google Scholar]
- Bonne TC, Doucende G, Fluck D, Jacobs RA, Nordsborg NB, Robach P, Walther G & Lundby C (2014). Phlebotomy eliminates the maximal cardiac output response to six weeks of exercise training. Am J Physiol Regul Integr Comp Physiol 306, R752–R760. [DOI] [PubMed] [Google Scholar]
- Bouchard C (2012). Genomic predictors of trainability. Exp Physiol 97, 347–352. [DOI] [PubMed] [Google Scholar]
- Bouchard C, An P, Rice T, Skinner JS, Wilmore JH, Gagnon J, Perusse L, Leon AS & Rao DC (1999). Familial aggregation of VO(2max) response to exercise training: results from the HERITAGE Family Study. J Appl Physiol (1985) 87, 1003–1008. [DOI] [PubMed] [Google Scholar]
- Bouchard C, Leon AS, Rao DC, Skinner JS, Wilmore JH & Gagnon J (1995). The HERITAGE family study. Aims, design, and measurement protocol. Med Sci Sports Exerc 27, 721–729. [PubMed] [Google Scholar]
- Bouchard C, Rankinen T & Timmons JA (2011a). Genomics and genetics in the biology of adaptation to exercise. Compr Physiol 1, 1603–1648. [DOI] [PMC free article] [PubMed] [Google Scholar]
- Bouchard C, Sarzynski MA, Rice TK, Kraus WE, Church TS, Sung YJ, Rao DC & Rankinen T (2011b). Genomic predictors of the maximal O2 uptake response to standardized exercise training programs. J Appl Physiol (1985) 110, 1160–1170. [DOI] [PMC free article] [PubMed] [Google Scholar]
- Boushel R, Ara I, Gnaiger E, Helge JW, Gonzalez‐Alonso J, Munck‐Andersen T, Sondergaard H, Damsgaard R, van Hall G, Saltin B & Calbet JA (2014). Low‐intensity training increases peak arm VO2 by enhancing both convective and diffusive O2 delivery. Acta Physiol (Oxf) 211, 122–134. [DOI] [PubMed] [Google Scholar]
- Boushel R, Gnaiger E, Calbet JA, Gonzalez‐Alonso J, Wright‐Paradis C, Sondergaard H, Ara I, Helge JW & Saltin B (2011). Muscle mitochondrial capacity exceeds maximal oxygen delivery in humans. Mitochondrion 11, 303–307. [DOI] [PubMed] [Google Scholar]
- Buford TW, Roberts MD & Church TS (2013). Toward exercise as personalized medicine. Sports Med 43, 157–165. [DOI] [PMC free article] [PubMed] [Google Scholar]
- Burge CM & Skinner SL (1995). Determination of hemoglobin mass and blood volume with CO: evaluation and application of a method. J Appl Physiol (1985) 79, 623–631. [DOI] [PubMed] [Google Scholar]
- Cohen L & Holliday M (1979). Statistics for Education and Physical Education. Harper and Row, London. [Google Scholar]
- Church TS, Earnest CP, Skinner JS & Blair SN (2007). Effects of different doses of physical activity on cardiorespiratory fitness among sedentary, overweight or obese postmenopausal women with elevated blood pressure: a randomized controlled trial. JAMA 297, 2081–2091. [DOI] [PubMed] [Google Scholar]
- Garber CE, Blissmer B, Deschenes MR, Franklin BA, Lamonte MJ, Lee IM, Nieman DC & Swain DP (2011). American College of Sports Medicine position stand. Quantity and quality of exercise for developing and maintaining cardiorespiratory, musculoskeletal, and neuromotor fitness in apparently healthy adults: guidance for prescribing exercise. Med Sci Sports Exerc 43, 1334–1359. [DOI] [PubMed] [Google Scholar]
- Gaskill SE, Walker AJ, Serfass RA, Bouchard C, Gagnon J, Rao DC, Skinner JS, Wilmore JH & Leon AS (2001). Changes in ventilatory threshold with exercise training in a sedentary population: the HERITAGE Family Study. Int J Sports Med 22, 586–592. [DOI] [PubMed] [Google Scholar]
- Hawley JA, Burke LM, Phillips SM & Spriet LL (2011). Nutritional modulation of training‐induced skeletal muscle adaptations. J Appl Physiol (1985) 110, 834–845. [DOI] [PubMed] [Google Scholar]
- Hawley JA & Noakes TD (1992). Peak power output predicts maximal oxygen uptake and performance time in trained cyclists. Eur J Appl Physiol Occup Physiol 65, 79–83. [DOI] [PubMed] [Google Scholar]
- Hecksteden A, Kraushaar J, Scharhag‐Rosenberger F, Theisen D, Senn S & Meyer T (2015). Individual response to exercise training – a statistical perspective. J Appl Physiol (1985) 118, 1450–1459. [DOI] [PubMed] [Google Scholar]
- Helgerud J, Hoydal K, Wang E, Karlsen T, Berg P, Bjerkaas M, Simonsen T, Helgesen C, Hjorth N, Bach R & Hoff J (2007). Aerobic high‐intensity intervals improve VO2max more than moderate training. Med Sci Sports Exerc 39, 665–671. [DOI] [PubMed] [Google Scholar]
- Hopkins WG ( 2000). Measures of reliability in sports medicine and science. Sports Med 30, 1–15. [DOI] [PubMed] [Google Scholar]
- Jacobs RA, Fluck D, Bonne TC, Burgi S, Christensen PM, Toigo M & Lundby C (2013). Improvements in exercise performance with high‐intensity interval training coincide with an increase in skeletal muscle mitochondrial content and function. J Appl Physiol (1985) 115, 785–793. [DOI] [PubMed] [Google Scholar]
- Joyner MJ & Green DJ (2009). Exercise protects the cardiovascular system: effects beyond traditional risk factors. J Physiol 587, 5551–5558. [DOI] [PMC free article] [PubMed] [Google Scholar]
- Kentta G & Hassmen P (1998). Overtraining and recovery. A conceptual model. Sports Med 26, 1–16. [DOI] [PubMed] [Google Scholar]
- Kodama S, Saito K, Tanaka S, Maki M, Yachi Y, Asumi M, Sugawara A, Totsuka K, Shimano H, Ohashi Y, Yamada N & Sone H (2009). Cardiorespiratory fitness as a quantitative predictor of all‐cause mortality and cardiovascular events in healthy men and women: a meta‐analysis. JAMA 301, 2024–2035. [DOI] [PubMed] [Google Scholar]
- Laukkanen JA, Lakka TA, Rauramaa R, Kuhanen R, Venalainen JM, Salonen R & Salonen JT (2001). Cardiovascular fitness as a predictor of mortality in men. Arch Intern Med 161, 825–831. [DOI] [PubMed] [Google Scholar]
- Lee DC, Artero EG, Sui X & Blair SN (2010). Mortality trends in the general population: the importance of cardiorespiratory fitness. J Psychopharmacol 24, 27–35. [DOI] [PMC free article] [PubMed] [Google Scholar]
- Lee IM, Hsieh CC & Paffenbarger RS Jr (1995). Exercise intensity and longevity in men. The Harvard Alumni Health Study. JAMA 273, 1179–1184. [PubMed] [Google Scholar]
- Lortie G, Simoneau JA, Hamel P, Boulay MR, Landry F & Bouchard C (1984). Responses of maximal aerobic power and capacity to aerobic training. Int J Sports Med 5, 232–236. [DOI] [PubMed] [Google Scholar]
- Lundby C & Montero D (2015). CrossTalk opposing view: Diffusion limitation of O2 from microvessels into muscle does not contribute to the limitation of VO2max . J Physiol 593, 3759–3761. [DOI] [PMC free article] [PubMed] [Google Scholar]
- Lundby C, Montero D & Joyner MJ (2017). Biology of VO2max: looking under the physiology lamp. Acta Physiologica DOI: 10.1111/apha.12827. [DOI] [PubMed] [Google Scholar]
- Mann TN, Lamberts RP & Lambert MI (2014). High responders and low responders: factors associated with individual variation in response to standardized training. Sports Med 44, 1113–1124. [DOI] [PubMed] [Google Scholar]
- Meyer T, Gabriel HH & Kindermann W (1999). Is determination of exercise intensities as percentages of VO2max or HRmax adequate? Med Sci Sports Exerc 31, 1342–1345. [DOI] [PubMed] [Google Scholar]
- Montero D, Cathomen A, Jacobs RA, Fluck D, de Leur J, Keiser S, Bonne T, Kirk N, Lundby AK & Lundby C (2015a. Haematological rather than skeletal muscle adaptations contribute to the increase in peak oxygen uptake induced by moderate endurance training. J Physiol 593, 4677–4688. [DOI] [PMC free article] [PubMed] [Google Scholar]
- Montero D & Diaz‐Canestro C (2015). Endurance training and maximal oxygen consumption with ageing: Role of maximal cardiac output and oxygen extraction. Eur J Prev Cardiol 23, 733–743. [DOI] [PubMed] [Google Scholar]
- Montero D, Diaz‐Canestro C & Lundby C (2015b). Endurance training and VO2max: role of maximal cardiac output and oxygen extraction. Med Sci Sports Exerc 47, 2024–2033. [DOI] [PubMed] [Google Scholar]
- Morris JN, Heady JA, Raffle PA, Roberts CG & Parks JW (1953). Coronary heart‐disease and physical activity of work. Lancet 265, 1111–1120 (concl.). [DOI] [PubMed] [Google Scholar]
- Mosley M (2012). BBC Two –Horizon, 2011–2012, The Truth About Exercise. http://www.bbc.co.uk/programmes/b01cywtq.
- Pedersen BK & Saltin B (2015). Exercise as medicine – evidence for prescribing exercise as therapy in 26 different chronic diseases. Scand J Med Sci Sports 25 Suppl 3, 1–72. [DOI] [PubMed] [Google Scholar]
- Potteiger JA (2013). ACSM's Introduction to Exercise Science, 2nd edn Lippincott Williams & Wilkins, Baltimore. [Google Scholar]
- Robach P, Bonne T, Fluck D, Burgi S, Toigo M, Jacobs RA & Lundby C (2014). Hypoxic training: effect on mitochondrial function and aerobic performance in hypoxia. Med Sci Sports Exerc 46, 1936–1945. [DOI] [PubMed] [Google Scholar]
- Ross R, de Lannoy L & Stotz PJ (2015). Separate effects of intensity and amount of exercise on interindividual cardiorespiratory fitness response. Mayo Clin Proc 90, 1506–1514. [DOI] [PubMed] [Google Scholar]
- Roth SM (2008). Last word on viewpoint: Perspective on the future use of genomics in exercise prescription. J Appl Physiol (1985) 104, 1254. [DOI] [PubMed] [Google Scholar]
- Samuels C (2009). Sleep, recovery, and performance: the new frontier in high‐performance athletics. Phys Med Rehabil Clin N Am 20, 149–159. [DOI] [PubMed] [Google Scholar]
- Sarzynski MA, Ghosh S & Bouchard C (2017). Genomic and transcriptomic predictors of response levels to endurance exercise training. J Physiol 595, 2931–2939. [DOI] [PMC free article] [PubMed] [Google Scholar]
- Scharhag‐Rosenberger F, Meyer T, Gassler N, Faude O & Kindermann W (2010). Exercise at given percentages of VO2max: heterogeneous metabolic responses between individuals. J Sci Med Sport 13, 74–79. [DOI] [PubMed] [Google Scholar]
- Senn S, Rolfe K & Julious SA (2011). Investigating variability in patient response to treatment – a case study from a replicate cross‐over study. Stat Methods Med Res 20, 657–666. [DOI] [PubMed] [Google Scholar]
- Shephard RJ, Rankinen T & Bouchard C (2004). Test‐retest errors and the apparent heterogeneity of training response. Eur J Appl Physiol 91, 199–203. [DOI] [PubMed] [Google Scholar]
- Siebenmann C, Cathomen A, Hug M, Keiser S, Lundby AK, Hilty MP, Goetze JP, Rasmussen P & Lundby C (2015). Hemoglobin mass and intravascular volume kinetics during and after exposure to 3,454‐m altitude. J Appl Physiol (1985) 119, 1194–1201. [DOI] [PubMed] [Google Scholar]
- Sisson SB, Katzmarzyk PT, Earnest CP, Bouchard C, Blair SN & Church TS (2009). Volume of exercise and fitness nonresponse in sedentary, postmenopausal women. Med Sci Sports Exerc 41, 539–545. [DOI] [PMC free article] [PubMed] [Google Scholar]
- Thomis M ( 2008). Commentary on viewpoint: Perspective on the future use of genomics in exercise prescription. J Appl Physiol (1985) 104, 1251. [DOI] [PubMed] [Google Scholar]
- Timmons JA, Knudsen S, Rankinen T, Koch LG, Sarzynski M, Jensen T, Keller P, Scheele C, Vollaard NB, Nielsen S, Akerstrom T, MacDougald OA, Jansson E, Greenhaff PL, Tarnopolsky MA, van Loon LJ, Pedersen BK, Sundberg CJ, Wahlestedt C, Britton SL & Bouchard C (2010). Using molecular classification to predict gains in maximal aerobic capacity following endurance exercise training in humans. J Appl Physiol (1985) 108, 1487–1496. [DOI] [PMC free article] [PubMed] [Google Scholar]
- Wagner PD ( 2015). CrossTalk proposal: Diffusion limitation of O2 from microvessels into muscle does contribute to the limitation of VO2max . J Physiol 593, 3757–3758. [DOI] [PMC free article] [PubMed] [Google Scholar]
- Wen CP, Wai JP, Tsai MK, Yang YC, Cheng TY, Lee MC, Chan HT, Tsao CK, Tsai SP & Wu X (2011). Minimum amount of physical activity for reduced mortality and extended life expectancy: a prospective cohort study. Lancet 378, 1244–1253. [DOI] [PubMed] [Google Scholar]
- Wenger HA & Bell GJ (1986). The interactions of intensity, frequency and duration of exercise training in altering cardiorespiratory fitness. Sports Med 3, 346–356. [DOI] [PubMed] [Google Scholar]
- West MJ (2012). Estimating volume in biological structures. Cold Spring Harb Protoc 2012, 1129–1139. [DOI] [PubMed] [Google Scholar]