

Abstract
Interrogation of the urinary proteome for clinically useful biomarkers of disease will require normalization of methods for protein extraction and sample handling. Variations in collection methods and sample handling may introduce significant discrepancies in qualitative and quantitative. Here we demonstrate that the method of protein extraction, length of handling at room temperature, and repetitive freeze-thaw cycles do not seem to alter the urinary proteome at either the protein or peptide level.
Keywords: Biomarker, Sample Preparation, Protein Precipitation, Ultrafiltration, Mass Spectrometry
Introduction
In the search for clinically applicable biomarkers of disease, numerous studies on body fluids are being conducted with special emphasis on plasma and serum. Analyses of low complexity body fluids, such as urine, may increase the likelihood of biomarker discovery, particularly in diseases of the urinary tract. Recently, several published proteomic studies of normal adult human urine have identified a large, but variable number of proteins1–11. Variations in sample handling may contribute to the discrepancies in protein identification. To date, there are no defined standards for sample handling.
A recent review on urinary proteomics described practical considerations for the handling of urine12. The review highlights various disparities throughout the literature on sample handling and preparation. The inconsistencies in published reports may also be a function of the method of peptide identification and data analysis as opposed to variations in sample handling and protein extraction. However, before agreement on an optimal peptide and protein identification method can be achieved, it is critical to assess potential degradative effects of alternative approaches in sample handling. Currently, very few studies have examined the effect of different methods of protein extraction or the effect of other variables. These variables may be critical in discovery-oriented experiments or in attempts to translate biomarker findings to the clinical setting.
Without doubt, the very nature of clinical medicine introduces a significant number of potentially unavoidable variations in sample handling. Many questions remain as to how to best acquire the sample, transport the sample, and process the sample for immediate and future use. Because of the complexity of delivering and distributing health care, variations in sample handling may significantly alter the urinary proteome and create artifactual differences. As an example, post-analytical discrepancies in the serum proteome have been attributed to variable sample handling13–17.
Nevertheless, urine and serum may not be comparable. Urine is significantly less complex than serum and has a different protein composition. Variations in sample handling may be more problematic with serum because of the greater protein complexity. Lower protease concentrations in urine in comparison to serum may also make urine samples more stable.
The purpose of this study is to identify potential variations in urine sample handling, focusing on variables that mimic variables of clinical practice to determine their effect on the urinary proteome. In particular, we examine the effect of prolonged exposure to room temperature, repetitive freeze-thaw cycles (e.g. repetitive handling and analysis of samples), and method of protein extraction (e.g. variability of technique) on urine proteome composition. Samples are processed using downstream equipment that allows for both qualitative and quantitative identification of peptide/proteins, which may be the most sensitive method of determining variations in the proteome. These variables are examined as they best represent the real life challenges of clinical sample collection.
Methods
Urine Collection
One healthy adult circumcised male (35 year old) provided a midstream clean catch urine sample. Voided samples were the second, not the first void of the day. Samples were collected in sterile specimen containers (VWR cat# 15704-051, Falcon 4.5 oz / 110 ml # 35-4013) under sterile conditions. Biological repeats were obtained from the same volunteer on different days.
Experiment 1: Comparative Protein Extraction (Figure 1A)
Figure 1.

Figure 1 is the workflow for the methods experiment. (A) Depicts the various methods of protein extraction in this experiment. Urine samples underwent either 90% ethanol precipitation, lyophilization by speed vacuum, 5 kDa microconcentrator separation, or reverse phase trapping column. Protein extractions were then separated by SDS-PAGE (B). Three different low intensity horizontal sections corresponding to the same approximate MW region were excised, digested and evaluated by LC-MS.
To determine the optimal method of protein extraction from urine, a fresh 100 ml urine core sample was acquired. The sample was centrifuged (2500x g at 4 °C) for 10 minutes to clear any debris. 500 μl aliquots were made. The following four methods of protein extraction were tested.
Method 1 was lyophylization. Samples were directly dried at room temperature in a vacuum centrifuge (SPD1010 Thermo Savant).
Method 2 utilized 90% ethanol precipitation. 4.5 ml of 90% ethanol was added to the 500 μl aliquot, centrifuged at 2500x g for 25 min at 4 °C. All of the supernatant except for ~200μl was removed. The pellet was resuspended in the remaining supernatant, transferred to a 1.5 ml tube, and then dried in the vacuum centrifuge (Thermo Savant) at room temperature.
Method 3 used a Vivaspin 5kDa microconcentrator (Sartorius Group). Samples were centrifuged at 13,000x g for 15 min 4 °C. The remaining retentate was vacuum centrifuged at room temperature.
Method 4 extracted proteins using a reverse phase trapping column (Michrom Bioresources). 55 μl of 10X Buffer A (79% HPLC water, 20% acetonitrile, 1% TFA) was added to a 500 μl sample aliquot. The sample was loaded onto the column and desalted with 500 μl of Buffer A (~98% HPLC water; 2% acetonitrile; 0.1% TFA). Proteins were eluted with 500 μl of Buffer B (90% acetonitrile, 10% HPLC water, 0.1% TFA). Samples were dried using a vacuum centrifuge (Thermo Savant).
After proteins were extracted, samples underwent standard Bradford assay to determine the overall protein concentration of each method. The Bradford assay was performed in triplicate for each biological replicate and each method. The average value of the protein concentration is reported.
SDS-PAGE and LC/MS (GeLC/MS)
Samples from each experiment were resuspended in 21 μl of 100 mM ammonium bicarbonate and 8 μl 4X LDS sample buffer (Invitrogen). 1μl of 1M DTT was added for 50 min at 50°C to reduce the sample. Samples were alkylated with 2 μl of 40% acrylamide at room temperature for 10 min. Samples were heated at 70°C for 10 min and then all samples from one particular experiment (e.g. all method samples) were loaded into a single 4–12% Bis-Tris precast gel (Invitrogen). Gels were run at 100 V and stained overnight in colloidal blue as per manufacturer protocol (Invitrogen).
In each experiment three horizontal sections were chosen from each SDS-PAGE gel (Figure 1B, 2B, and 3B). The horizontal section represents the same mass region across each sample, therefore allowing for a comparative analysis in specific areas of the proteome. The gel regions from each lane (e.g. sample) were excised, in-gel digested with trypsin, extracted and analyzed by LC/MS. Analysis was performed on the LTQ equipped with a Surveyor HPLC pump and a microautosampler (all: Thermo Scientific). A 34 min gradient was used (94 to 64% Buffer A (0.4 % formic acid in H2O vs. 0.4 % formic acid in acetonitrile Buffer B)). The instrument was operated in data dependent acquisition mode, fragmenting the 6 most abundant species after each survey scan.
Figure 2.
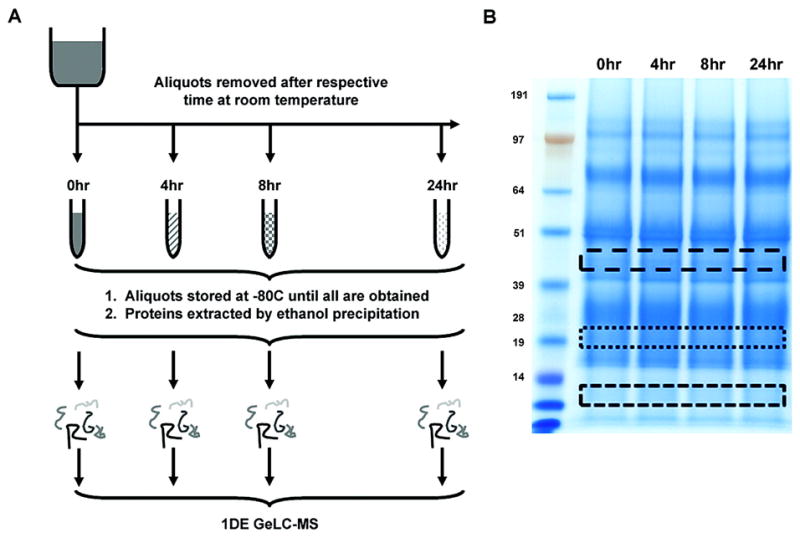
Figure 2 is the workflow for the freeze-delay experiment. (A) Aliquots of urine are removed from one biological sample (core) starting at 0 hours. The 0 hour sample is stored at −80°C until the other time points are obtained. The core biological sample is left at room temperature and then successive aliquots are removed 4 hours, 8 hours and 24 hours later. All aliquots are stored at −80°C. Proteins then are extracted by 90 % ethanol precipitation. (B) Samples are separated by SDS-PAGE. Three different low intensity horizontal sections corresponding to the same approximate MW region were excised, digested and evaluated by LC-MS.
Figure 3.

Figure 3 is the workflow for the freeze-thaw experiment. (A) One core biological sample is obtained and 500 μl aliquots are made and stored at −80°C. Multiple aliquots are removed, thawed in a water bath to 37C. One aliquot is removed and labeled as C0. The remaining aliquots are snap frozen in liquid nitrogen for 15 minutes. They are then thawed to 37°C and another aliquot is removed and labeled as C1. This process continues for five cycles. 90 % ethanol precipitation is used to extract the proteins. (B) Aliquots are separated by SDS-PAGE. Three different low intensity horizontal sections corresponding to the same approximate MW region were excised, digested and evaluated by LC-MS.
Experiment 2: Freeze-Delay (Figure 2A)
To determine the effect of prolonged exposure to room temperature a fresh 100 ml urine sample was acquired. The sample was centrifuged at 2500x g at 4°C for 10 min to clear any debris. Multiple 500 μl aliquots were immediately frozen at −80°C. The remainder of the core sample was left at room temperature for 4 h. Multiple 500 μl aliquots were then removed and frozen at −80°C. The remainder of the core sample was left at room temperature for an additional 4 h (total 8 h). After a total of 8 h at room temperature, additional 500 μl aliquots were removed and frozen at −80°C. Finally the remainder of the sample was left at room temperature overnight. After a total of 24 h at room temperature, additional 500 μl aliquots were stored at −80°C.
One aliquot from each time (T0, T4, T8, and T24 hour) were removed from −80°C and proteins were extracted using ethanol precipitation as described above. Samples then underwent SDS-PAGE and LC/MS as described above for experiment 1.
Experiment 3: Freeze-Thaw (Figure 3A)
To determine the effect of repetitive freeze thawing events on sample stability, a fresh 100 ml urine core sample was acquired. As in previous methods, 500 μl aliquots were stored at −80°C. Ten samples were removed and thawed in a 37°C water bath. All 10 aliquots were pooled into a 15 ml tube and then 500ul were drawn off into tube C0 (cycle 0). The remaining pooled urine was snap frozen in liquid nitrogen for 15 min.
The pooled refrozen urine was thawed in a 37°C water bath until ice melted, resuspended, and then another 500 μl were drawn off into tube C1 (cycle 1). The remaining sample was again snap frozen in liquid nitrogen for 15 min. This process was repeated until 6 samples were collected (C0 to C5). Protein was extracted from each sample by ethanol precipitation as described above. Each sample underwent SDS-PAGE and LC/MS as described above.
Database searching and validation
Each sample in all experiments was analyzed by LC/MS in triplicate. The order of running the samples was grouped within each experiment but randomized within the experiment. A blank sample was placed between each LC run. Each experiment was run twice with a biological replicate. Different areas of the gel were sampled in each biological replicate as compared to the original sample.
The 200 most intense fragment ions of the raw spectra were used for searches against IPI_human database (version 3.36) using Mascot version 2.1.04. The following search parameter were applied: default charge states of 1+, 2+, 3+ and 4+ were used; A maximum of one missed cleavage was allowed with an average peptide mass tolerance of ±1.5 Da. A fragment ion search tolerance of ±0.8 Da was permitted. Fixed modification on cysteine was acrylamide and variable modifications were deamidation, oxidation of methionine, and pyro-glutamic acid formation.
All data were searched against a target database and the corresponding decoy database18. In order to determine the false discovery rate and the accurate cutoff per run, the results of the individual target/decoy searches were merged. The initial false discovery rate was determined by dividing the number of target search peptide hits with a score greater than the identity score (as given by Mascot) by the number of decoy peptide hits with a score higher than the identity score threshold. The initial identity score threshold was then iteratively changed in order to obtain a 1% false discovery rate. The average ion score cutoff per sample was determined to be 46. The ion cutoff for each of the runs was automatically adjusted to ensure a 1% false positive rate throughout the experiments. In order to allow a sound comparison of the samples a parsimonious protein grouping was performed (non redundant proteins) based on a unique list of peptides obtained from the sample comparisons. This step is necessary to generate a minimal list of proteins that are able to explain all peptides in the combined sample sets. This list of proteins is then used as base for the comparison of the samples at the protein level.
Peptide quantitation by spectral counting was determined by calculating the total number of tandem MS spectra matching to a particular peptide across all the technical replicates19, 20. This number corresponds to the spectral count for that peptide. To compare peptide quantitation in either the freeze-delay or freeze-thaw experiment, we used a normalized peptide spectral count. The normalized spectral count for a peptide at a particular time point (e.g. T4) was calculated by dividing that peptide’s spectral count by the sum total of that peptide’s spectral counts for all time points. The normalized spectral count was used to determine the effect of prolonged room temperature and repetitive freeze-thaw cycles on peptide abundance.
Results
Comparative Protein Extraction
To determine the most effective method of extracting proteins from urine we compared four common methods of protein extraction. We first compared the total concentration of protein extracted from each method by standard Bradford assay. Results were measured in triplicate and represent the average of two biological replicates. By this assay lyophylization yielded the highest amount of protein (33.3 μg/ml), as compared to ethanol (16.9 μg/ml), microconcentrator (12.0 μg/ml), and trapping column (15.0 μg/ml).
To further evaluate each method beyond the standard Bradford assay, we separated samples by SDS-PAGE (Figure 1B). Interestingly the findings of the Bradford assay were not confirmed. It appeared that each method may have yielded a similar amount of protein. For a more detailed analysis, we compared identical molecular weight gel bands from each method at three distinct molecular weights regions by LC-MS. We purposefully chose low staining intensity areas because they represent low abundant proteins where differences will most likely be amplified and detected.
Overall, there was no demonstrable difference in any of the four methods of protein extraction (Figure 4). Identified proteins and peptides are detailed in Supplementary Data Table 1 and 2. Comparison of the overall number of peptides detected, total cumulative spectral count of all peptides identified, and number of proteins matched by 2 or more unique peptides did not demonstrate any difference between methods. Repeating the experiment with a biological replicate demonstrated identical results.
Figure 4.

Figure 4 demonstrates the number of peptides, proteins and cumulative spectral count for each method of protein extraction. (A) Two biological replicates were tested. Each biological replicate was run in triplicate. There was no difference in the number of peptides identified between each method for both biological replicates. (B) Cumulative spectra count for all identified peptides for each method remained consistent per biological replicate. (C) At the protein level there was no difference in the number of proteins identified between each method.
Furthermore when comparing how many proteins were found in common between each of the methods (e.g. biological replicate 2) we found that 55.3% (110 out of 199) were found by all four methods. The same analysis on the top 100 proteins identified (the 50th percentile) revealed that 89% of these proteins were found by all four methods. Similar results were seen in the other biological replicate.
Effect of prolonged room temperature exposure
To determine the effect of prolonged exposure to room temperature on peptide quantitation, only one method of protein extraction (ethanol precipitation) was used. Again comparative analysis was conducted at the peptide level as described previously. Visual SDS-PAGE comparison did not reveal substantial differences between successive time points (Figure 2B).
As in the methods experiment, three low staining intensity molecular weight gel regions were analyzed across each time point by LC/MS. There was no obvious effect of prolonged room temperature exposure on the number of peptides matched or the number of proteins matched by 2 unique peptides (Figure 5). A biological replicate confirmed these results. Identified proteins and peptides are detailed in Supplementary Data Table 3 and 4. As in the methods experiment, protein identity across all 4 time points was consistent. 60.2% (97) of all the identified proteins (161) were seen at all times, and of the top 50th percentile of identified proteins 97.5% were seen at all times.
Figure 5.

Figure 5 demonstrates that there is no difference in the number of proteins (A) or peptides (B) identified after prolonged exposure to room temperature. A biological replicate demonstrates identical results.
To determine if prolonged room temperature exposure resulted in quantitative changes, normalized spectral counts of the 200 most abundant peptides (e.g. highest spectral count) present at each time point were compared. Peptides were grouped into sets of 50 by their overall abundance and analyzed by box plot. For each group of 50 peptides the mean normalized spectral count was stable with increasing exposure to room temperature (Figure 6). The number of outliers increased among the lower abundant peptides (e.g. peptides 151–200). These results demonstrate that peptide and, by inference, urine protein levels are very stable at room temperature up to 24 h.
Figure 6.

Figure 6 is a quantitative comparison of the effect of prolonged room temperature exposure on peptide abundance. The normalized spectra counts of the top 200 abundant peptides were compared in groups of 50. The box plots demonstrate that peptide quantitation remained stable with prolonged exposure to room temperature. There were a minimal number of outliers.
Effect of multiple freeze-thaw cycles on the urinary proteome
Samples that underwent 0 to 5 repetitive freeze-thaw cycles were separated by SDS-PAGE as previously described. There was no obvious visual change in SDS-PAGE with each additional cycle (Figure 3B). As in the previous experiments, three sets of identical molecular weight low intensity gel bands were selected and analyzed by LC/MS. At the protein level, there was no obvious effect in the number of proteins identified after each freeze-thaw cycle (Figure 7). Identified proteins and peptides are detailed in Supplementary Data Table 5 and 6. Interestingly at the peptide level, the initial number of peptides identified prior to freezing was low as compared to the repetitive cycles in one biological sample. However, the biological replicate demonstrated that this discrepancy may have been secondary to technical variation. As in the other experiments, protein identification across each cycle was very stable. 63.8% (150) of all the identified proteins (235) were seen at all times, and of the top 50th percentile of identified proteins 98.3% were seen at all times.
Figure 7.

Figure 7 shows that repetitive five freeze-thaw cycles does not seem to affect the number of proteins (A) or peptides (B) identified. A biological replicate demonstrates identical results.
Quantitation of peptides was also compared using normalized spectral count. As before we quantitatively compared the 200 most abundant peptides identified from low staining areas. Box plot analysis of peptide groups did not demonstrate any appreciable quantitative variation in identified proteins after multiple freeze-thaw cycles (Figure 8). The less abundant peptides had the greatest number of outliers, which again may be a reflection of technical limitations or using spectral counting for quantitative comparison. Regardless, these results demonstrate that multiple freeze-thaw cycles do not appear to affect the overall peptide and therefore protein quantitation.
Figure 8.
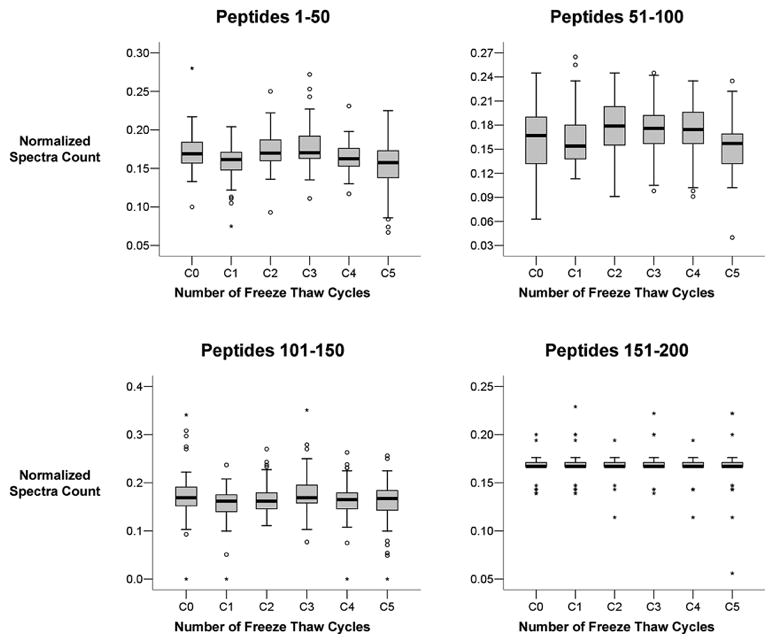
Figure 8 displays the effect of repetitive freeze-thaw cycles on peptide quantitation. The normalized spectra count for the top 200 abundant peptides were compared in groups of 50 by box plot analysis. We did not identify any significant change in peptide quantitation with increasing number of freeze-thaw cycles.
Discussion
The ability to identify clinically useful biomarkers of disease in urine will require normalization of methods for protein extraction and sample handling so that findings between laboratories can be compared. In this report we attempt to address some of the variables of sample collection and handling that may affect proteome analysis. One advantage of our experimental design is that we used one donor sample, which limits subject variability. Additionally, we performed multiple technical repeats on each sample in order to limit instrument and technical variability. Furthermore, by using a biological replicate and sampling the proteome purposefully in different low abundance areas as determined by SDS-PAGE, we test the robustness and reproducibility of our experiments and conclusions. Finally, by performing quantitative comparisons only at the peptide level, we eliminate any bias associated with database redundancy and peptide assignments to similar protein isoforms that can lead to erroneous protein identification or quantitation.
Comparing Protein Extraction Methods
Our results did not demonstrate significant differences arising from alternative methods of protein extraction at the qualitative protein level and quantitative peptide level. Previous studies and ours have demonstrated by standard Bradford assay that lyophilized urine has the highest protein concentration3. The measurement of urine protein concentration by the standard or modified Bradford assay has inherent error because of the optical complexity of urine, high amount of salts and other interfering compounds, and low concentrations of proteins21–23. The high concentration measured for lyophylization is most likely an artifact due to the lack of salt removal. The inability of lyophylization to remove salt is demonstrated by ineffective first dimensional separation and protein recovery by 2D-gel electrophoresis (2D-GE) even though the samples had high Bradford assay results3. For subjects with no significant nephropathy leading to high degrees of albuminuria, the results of Bradford assays for the determination of concentrations of urinary protein extracts should only be used with reservations.
Previous comparisons of urinary protein extraction methods relied on visual comparisons and spot counting on 2D-GE3. Although differences were identified on 2D-GE, the disparities may be a result of the efficacy of salt removal as opposed to the method of protein extraction. Additionally, reproducibility of 2D-GE separation, staining sensitivity, and variance in spot identification may play a critical role in determining the most efficacious method by visual comparison.
To further evaluate each method beyond the standard Bradford assay, we separated samples by SDS-PAGE. We purposefully chose low intensity staining areas because previous experiments have demonstrated that the high abundance proteins in the urine (e.g. albumin) are stable through various manipulations24–26. Additionally, it is more likely that low abundance areas will be more affected by the different variables being tested. Protein identification was stable in our analysis, particularly when examining the highest scoring proteins. The variation seen in the lower scoring proteins is most likely secondary to our inability to precisely excise the same MW region in each trial. Overall, our analysis demonstrated that methods of extraction were comparable and robust and yielded very similar results. The choice of method should be more dependent upon the technical ease, cost, speed, parallelization-capabilities, and compatibility with downstream protocols.
Effect of prolonged room temperature exposure
Overall there did not appear to be any effect on the urinary proteome at either the qualitative protein level or the quantitative peptide level by prolonged exposure to room temperature up to 24 h. This finding is supported by other studies on urinary proteins. ELISA assays of urinary matrix metalloproteinase demonstrated stability beyond 24 h at room temperature. However, protein/enzymatic activity measured by zymography was affected by prolonged storage, in that the enzyme activity decreases after a few hours at room temperature27. Thus, although the protein quantity may be stable, protein activity may not be.
Two factors that may limit our ability to detect the effect of room temperature exposure is 1) not analyzing the entire proteome; and 2) limiting our analysis to the top 200 peptides. To simplify data acquisition and analysis we limited our analysis to 3 areas with low staining intensities on the SDS-PAGE. As previously demonstrated, high abundance proteins are stable in urine, therefore the low abundance proteins are potentially more likely to be affected24–26. Inclusion of higher intensity areas, may lead to suppression of less abundant peptides and inability to detect differences. If variations are found in the low abundant proteins, further investigation of the more abundant species would be required.
In each experiment approximately 284 to 385 peptides were identified using our stringent search criteria. When we incorporated these additional peptides into the analysis, the overall mean quantitation score did not change, but the standard deviation increased, indicating that there may be some effect of temperature on very low abundant peptides. However, this variability may also be a result of other factors such as: 1) instrument reproducibility and sensitivity; 2) precision of MW matching between time points; and 3) efficiency of peptide digestion and recovery. By limiting the analysis to the more abundant peptides we may be able to detect variations that are a function of prolonged room temperature exposure and not technical limitations.
Previous reports describe increased bacterial contamination and dramatic changes in the proteome after >8 h of exposure at room temperature28. Our analysis did not demonstrate any contamination or changes in the proteome with increased exposure to room temperature. Without doubt midstream urine collection, which is the standard clinically for in adults, has the potential for contamination regardless of the method of cleansing the genital area29–31. For these reasons, bacterial growth in urine at 8 h implies that the starting sample may be contaminated, not that prolonged exposure to room temperature leads to increased risk of new contamination. Additives such as sodium azide may prevent contamination during sample handling, but not suppress the effects of prior existing contamination on the urinary proteome28. Regardless of additives, the primary goal should be to use only culture negative samples as active infection and inflammation, regardless of the bacterial type, may significantly change the complement of detectable proteins/peptides. As a corollary, continuous 24-h urine collection sample is never used in clinical practice to identify a bacterial infection because of the high risk of contamination and therefore should be avoided in discovery based proteomic studies.
Effect of multiple freeze-thaw cycles on the urinary proteome
We did not identify any effect of repetitive freeze-thaw cycles on protein identification or quantitative peptide analysis. Repetitive freeze-thaw cycles of urine have been reported to alter SELDI-TOF MS peak intensities after the fourth freeze-thaw cycle32. In those studies, urine samples underwent repetitive freeze-thaw cycles and were evaluated by SELDI-TOF MS. Peak profiles and intensities were compared between each cycle. Profiles remained similar but selective peak intensities decreased after the fourth cycle. The differences may be explained by the lack of technical and biological repeats. Additionally, comparative quantitative SELDI-TOF analysis in complex solutions such as urine may be affected by competition for binding sites and ion suppression leading to variations in peak intensity not related to the freeze-thaw cycle.
To further explore whether repetitive freeze-thaw cycles have an effect on the urinary proteome, we compared the peptide quantitation after each freeze-thaw cycle. As in the other experiments we did not detect a significant difference at the protein or peptide level. We may have limited our ability to identify differences by not analyzing the entire proteome and focusing our analysis on the top 200 peptides. Although these are the most abundant peptides seen in this analysis, they are not the most abundant urinary peptides and most likely represent low abundance proteins. By limiting the comparative analysis we can effectively remove the technical and human variations that are prevalent in this type of comparative experiment.
Additionally, we limited the analysis to abundant peptides, because quantitation by spectral counting is as robust as conventional quantitative labeling methods such as SILAC for higher abundance peptides20. For lower abundant peptides, spectral counting may not be appropriate. Overall, our analysis identified approximately 600 peptides at each cycle. Incorporating the additional peptides did not change the mean normalized quantitation between each cycle, the standard deviation again increased. The increased variability from the additional peptides again most likely represents technical limitations of spectral counting and measurement as opposed to the effect of repetitive freeze/thaw cycles.
Conclusion
Interrogation of the urinary proteome for clinically useful biomarkers of disease will require normalization of methods for protein extraction and sample handling. By analyzing low abundance areas of the urinary proteome, we demonstrated that several methods of protein extraction are equally effective for quantitation by MS. The choice of method may be more dependent on the method of downstream separation or analysis. Additionally, prolonged exposure to room temperature and multiple freeze-thaw cycles did not appreciably affect the stability of urine protein composition at either the protein or quantitative peptide level. These results imply that urine is a very stable body fluid and may be an optimal source for clinically applicable biomarker discovery using a bottom-up LC/MS approach. However, to make further definitive recommendations on these variables, various urinary subproteomes such as the phosphoproteome, and bioactivity of enzyme families, should be further investigated. Until that time we recommend that culture negative urine be obtained in a sterile fashion, transported in a sterile container, divided into multiple single-use aliquots; and be stored at −80°C.
Supplementary Material
Acknowledgments
Funding: This study was supported by a fellowship from the Swiss National Science Foundation (FM), NIH K08 DK077836 (RSL), NIH T32 DK60442 (MRF), and NIH P50 DK65298 (MRF).
Abbreviations
- MS
mass spectrometry
- 2D-GE
two dimensional gel electrophoresis
- SDS-PAGE
one dimensional polyacrylamide gel electrophoresis
- IPG
immobilized pH gradient
- LC-MS
liquid chromatography - mass spectrometry
- MW
molecular weight
References
- 1.Davis MT, Spahr CS, McGinley MD, Robinson JH, Bures EJ, Beierle J, Mort J, Yu W, Luethy R, Patterson SD. Towards defining the urinary proteome using liquid chromatography-tandem mass spectrometry. II. Limitations of complex mixture analyses. Proteomics. 2001;1(1):108–17. doi: 10.1002/1615-9861(200101)1:1<108::AID-PROT108>3.0.CO;2-5. [DOI] [PubMed] [Google Scholar]
- 2.Sun W, Li F, Wu S, Wang X, Zheng D, Wang J, Gao Y. Human urine proteome analysis by three separation approaches. Proteomics. 2005;5(18):4994–5001. doi: 10.1002/pmic.200401334. [DOI] [PubMed] [Google Scholar]
- 3.Thongboonkerd V, Chutipongtanate S, Kanlaya R. Systematic evaluation of sample preparation methods for gel-based human urinary proteomics: quantity, quality, and variability. J Proteome Res. 2006;5(1):183–91. doi: 10.1021/pr0502525. [DOI] [PubMed] [Google Scholar]
- 4.Pisitkun T, Shen RF, Knepper MA. Identification and proteomic profiling of exosomes in human urine. Proc Natl Acad Sci U S A. 2004;101(36):13368–73. doi: 10.1073/pnas.0403453101. [DOI] [PMC free article] [PubMed] [Google Scholar]
- 5.Oh J, Pyo JH, Jo EH, Hwang SI, Kang SC, Jung JH, Park EK, Kim SY, Choi JY, Lim J. Establishment of a near-standard two-dimensional human urine proteomic map. Proteomics. 2004;4(11):3485–97. doi: 10.1002/pmic.200401018. [DOI] [PubMed] [Google Scholar]
- 6.Thongboonkerd V, McLeish KR, Arthur JM, Klein JB. Proteomic analysis of normal human urinary proteins isolated by acetone precipitation or ultracentrifugation. Kidney Int. 2002;62(4):1461–9. doi: 10.1111/j.1523-1755.2002.kid565.x. [DOI] [PubMed] [Google Scholar]
- 7.Castagna A, Cecconi D, Sennels L, Rappsilber J, Guerrier L, Fortis F, Boschetti E, Lomas L, Righetti PG. Exploring the hidden human urinary proteome via ligand library beads. J Proteome Res. 2005;4(6):1917–30. doi: 10.1021/pr050153r. [DOI] [PubMed] [Google Scholar]
- 8.Smith G, Barratt D, Rowlinson R, Nickson J, Tonge R. Development of a high-throughput method for preparing human urine for two-dimensional electrophoresis. Proteomics. 2005;5(9):2315–8. doi: 10.1002/pmic.200401267. [DOI] [PubMed] [Google Scholar]
- 9.Tantipaiboonwong P, Sinchaikul S, Sriyam S, Phutrakul S, Chen ST. Different techniques for urinary protein analysis of normal and lung cancer patients. Proteomics. 2005;5(4):1140–9. doi: 10.1002/pmic.200401143. [DOI] [PubMed] [Google Scholar]
- 10.Pieper R, Gatlin CL, McGrath AM, Makusky AJ, Mondal M, Seonarain M, Field E, Schatz CR, Estock MA, Ahmed N, Anderson NG, Steiner S. Characterization of the human urinary proteome: a method for high-resolution display of urinary proteins on two-dimensional electrophoresis gels with a yield of nearly 1400 distinct protein spots. Proteomics. 2004;4(4):1159–74. doi: 10.1002/pmic.200300661. [DOI] [PubMed] [Google Scholar]
- 11.Adachi J, Kumar C, Zhang Y, Olsen JV, Mann M. The human urinary proteome contains more than 1500 proteins including a large proportion of membranes proteins. Genome Biol. 2006;7(9):R80. doi: 10.1186/gb-2006-7-9-r80. [DOI] [PMC free article] [PubMed] [Google Scholar]
- 12.Thongboonkerd V. Practical points in urinary proteomics. J Proteome Res. 2007;6(10):3881–90. doi: 10.1021/pr070328s. [DOI] [PubMed] [Google Scholar]
- 13.Findeisen P, Sismanidis D, Riedl M, Costina V, Neumaier M. Preanalytical impact of sample handling on proteome profiling experiments with matrix-assisted laser desorption/ionization time-of-flight mass spectrometry. Clin Chem. 2005;51(12):2409–11. doi: 10.1373/clinchem.2005.054585. [DOI] [PubMed] [Google Scholar]
- 14.Banks RE, Stanley AJ, Cairns DA, Barrett JH, Clarke P, Thompson D, Selby PJ. Influences of blood sample processing on low-molecular-weight proteome identified by surface-enhanced laser desorption/ionization mass spectrometry. Clin Chem. 2005;51(9):1637–49. doi: 10.1373/clinchem.2005.051417. [DOI] [PubMed] [Google Scholar]
- 15.West-Norager M, Kelstrup CD, Schou C, Hogdall EV, Hogdall CK, Heegaard NH. Unravelling in vitro variables of major importance for the outcome of mass spectrometry-based serum proteomics. J Chromatogr B Analyt Technol Biomed Life Sci. 2007;847(1):30–7. doi: 10.1016/j.jchromb.2006.09.048. [DOI] [PubMed] [Google Scholar]
- 16.Timms JF, Arslan-Low E, Gentry-Maharaj A, Luo Z, T’Jampens D, Podust VN, Ford J, Fung ET, Gammerman A, Jacobs I, Menon U. Preanalytic influence of sample handling on SELDI-TOF serum protein profiles. Clin Chem. 2007;53(4):645–56. doi: 10.1373/clinchem.2006.080101. [DOI] [PubMed] [Google Scholar]
- 17.Rai AJ, Vitzthum F. Effects of preanalytical variables on peptide and protein measurements in human serum and plasma: implications for clinical proteomics. Expert Rev Proteomics. 2006;3(4):409–26. doi: 10.1586/14789450.3.4.409. [DOI] [PubMed] [Google Scholar]
- 18.Elias JE, Gygi SP. Target-decoy search strategy for increased confidence in large-scale protein identifications by mass spectrometry. Nat Methods. 2007;4(3):207–14. doi: 10.1038/nmeth1019. [DOI] [PubMed] [Google Scholar]
- 19.Liu H, Sadygov RG, Yates JR. 3rd, A model for random sampling and estimation of relative protein abundance in shotgun proteomics. Anal Chem. 2004;76(14):4193–201. doi: 10.1021/ac0498563. [DOI] [PubMed] [Google Scholar]
- 20.Usaite R, Wohlschlegel J, Venable JD, Park SK, Nielsen J, Olsson L, Yates JR., III Characterization of Global Yeast Quantitative Proteome Data Generated from the Wild-Type and Glucose Repression Saccharomyces cerevisiae Strains: The Comparison of Two Quantitative Methods. J Proteome Res. 2008;7(1):266–75. doi: 10.1021/pr700580m. [DOI] [PMC free article] [PubMed] [Google Scholar]
- 21.McElderry LA, Tarbit IF, Cassells-Smith AJ. Six methods for urinary protein compared. Clin Chem. 1982;28(2):356–60. [PubMed] [Google Scholar]
- 22.Lim CW, Chisnall WN, Stokes YM, Debnam PM, Crooke MJ. Effects of low and high relative molecular protein mass on four methods for total protein determination in urine. Pathology. 1990;22(2):89–92. doi: 10.3109/00313029009063786. [DOI] [PubMed] [Google Scholar]
- 23.Dilena BA, Penberthy LA, Fraser CG. Six methods for determining urinary protein compared. Clin Chem. 1983;29(3):553–7. [PubMed] [Google Scholar]
- 24.Froom P, Bieganiec B, Ehrenrich Z, Barak M. Stability of common analytes in urine refrigerated for 24 h before automated analysis by test strips. Clin Chem. 2000;46(9):1384–6. [PubMed] [Google Scholar]
- 25.Innanen VT, Groom BM, de Campos FM. Microalbumin and freezing. Clin Chem. 1997;43(6 Pt 1):1093–4. [PubMed] [Google Scholar]
- 26.Tencer J, Thysell H, Andersson K, Grubb A. Stability of albumin, protein HC, immunoglobulin G, kappa- and lambda-chain immunoreactivity, orosomucoid and alpha 1-antitrypsin in urine stored at various conditions. Scand J Clin Lab Invest. 1994;54(3):199–206. doi: 10.1080/00365519409088425. [DOI] [PubMed] [Google Scholar]
- 27.Moses MA. Personal Communication. 2008.
- 28.Thongboonkerd V, Saetun P. Bacterial overgrowth affects urinary proteome analysis: recommendation for centrifugation, temperature, duration, and the use of preservatives during sample collection. J Proteome Res. 2007;6(11):4173–81. doi: 10.1021/pr070311+. [DOI] [PubMed] [Google Scholar]
- 29.Blake DR, Doherty LF. Effect of perineal cleansing on contamination rate of mid-stream urine culture. J Pediatr Adolesc Gynecol. 2006;19(1):31–4. doi: 10.1016/j.jpag.2005.11.003. [DOI] [PubMed] [Google Scholar]
- 30.Lifshitz E, Kramer L. Outpatient urine culture: does collection technique matter? Arch Intern Med. 2000;160(16):2537–40. doi: 10.1001/archinte.160.16.2537. [DOI] [PubMed] [Google Scholar]
- 31.Vaillancourt S, McGillivray D, Zhang X, Kramer MS. To clean or not to clean: effect on contamination rates in midstream urine collections in toilet-trained children. Pediatrics. 2007;119(6):e1288–93. doi: 10.1542/peds.2006-2392. [DOI] [PubMed] [Google Scholar]
- 32.Schaub S, Wilkins J, Weiler T, Sangster K, Rush D, Nickerson P. Urine protein profiling with surface-enhanced laser-desorption/ionization time-of-flight mass spectrometry. Kidney Int. 2004;65(1):323–32. doi: 10.1111/j.1523-1755.2004.00352.x. [DOI] [PubMed] [Google Scholar]
Associated Data
This section collects any data citations, data availability statements, or supplementary materials included in this article.