

Abstract
Glioblastoma is a highly heterogeneous aggressive primary brain tumor, with the glioma stem‐like cells (GSC) being more sensitive to cytotoxic lymphocyte‐mediated killing than glioma differentiated cells (GDC). However, the mechanism behind this higher sensitivity is unclear. Here, we found that the mitochondrial morphology of GSCs modulates the ER–mitochondria contacts that regulate the surface expression of sialylated glycans and their recognition by cytotoxic T lymphocytes and natural killer cells. GSCs displayed diminished ER–mitochondria contacts compared to GDCs. Forced ER–mitochondria contacts in GSCs increased their cell surface expression of sialylated glycans and reduced their susceptibility to cytotoxic lymphocytes. Therefore, mitochondrial morphology and dynamism dictate the ER–mitochondria contacts in order to regulate the surface expression of certain glycans and thus play a role in GSC recognition and elimination by immune effector cells. Targeting the mitochondrial morphology, dynamism, and contacts with the ER could be an innovative strategy to deplete the cancer stem cell compartment to successfully treat glioblastoma.
Keywords: cancer cell glycocalyx, cytotoxic lymphocytes, ER–mitochondria contacts, glioma, glioma stem‐like cells
Subject Categories: Cancer, Immunology, Metabolism
Introduction
Grade IV astrocytoma, also known as glioblastoma (GBM), is the most frequent and most lethal primary malignant brain tumor (Castro et al, 2003). Despite conventional therapy combining surgical resection, radiotherapy, and chemotherapy, the prognosis remains poor with a median survival of only 14.6 months (Castro et al, 2003; Binello & Germano, 2011; Chen et al, 2012b). In GBM, as in many other cancers, evidence has been found for a subpopulation of cancer initiating cells with stem‐like features. These glioma stem‐like cells (GSC) and their glioma differentiated cell (GDC) counterparts may represent the opposite extremes of cells forming the highly heterogeneous GBM mass in vivo (Singh et al, 2004; Chen et al, 2012a; Patel et al, 2014; Suva et al, 2014). As a direct consequence, the greater the proportion of GSC, the higher the tumor aggressivity and the poorer the prognosis (Bao et al, 2006; Zeppernick et al, 2008). Therefore, targeting glioma at its very root by directly eliminating GSC could be a very promising therapeutic strategy to obtain durable cancer treatment responses. However, conventional therapies are poorly efficacious against GSC (Bao et al, 2006; Liu et al, 2006; Dalerba et al, 2007; Hadjipanayis & Van Meir, 2009). One attractive alternative is to take advantage of the endogenous immune response to eradicate GSC during immunotherapy. Indeed, both GDC and GSC can be efficiently targeted by cytotoxic immune effector cells (Pellegatta et al, 2006; Wu et al, 2007; Barcia et al, 2009; Brown et al, 2009; Castriconi et al, 2009; Yang et al, 2010; Avril et al, 2012; Bassoy et al, 2016). These findings, together with the identification of multiple glioma antigens (Dutoit et al, Brain 2012: 135, 1042–1054), have encouraged the development of vaccines eliciting coordinated multi‐epitope targeted T‐cell‐mediated immunity, T helper functions, and immunologic memory (Derouazi et al, 2015). Interestingly, GSC appear even more sensitive to both natural killer (NK) cells and cytotoxic T lymphocytes (CTL) than GDC (Avril et al, 2012; Bassoy et al, 2016). However, the mechanism underlining the higher susceptibility of GSC cytotoxic immune cell‐mediated killing is unclear.
Strikingly, the ability of cytotoxic lymphocytes to contact target cells can be modulated by the topography of the plasma membrane of the latter, which results from the combined density of microvilli and filopodia, and the cell surface expression of glycans in the form of glycoproteins and glycolipids that compose the glycocalyx (Hoa et al, 2010; Paszek et al, 2014). When cytotoxic immune cells finally recognize and contact their targets, they trigger apoptosis, a process that we found to be also dependent on target cell mitochondrial reactive oxygen species (ROS) (Martinvalet et al, 2005, 2008; Martinvalet & Thiery, 2008; Jacquemin et al, 2015).
Mitochondria are also very important for energy production, cell metabolism and signaling, Ca2+ homeostasis, cell cycle regulation, differentiation, and aging (Attardi & Schatz, 1988; Saraste, 1999; Rizzuto et al, 2000; Kasahara & Scorrano, 2014). Mitochondria are morphologically and structurally very versatile as they undergo constant remodeling through fusion and fission events (Scorrano, 2005; Chan, 2006; Dimmer & Scorrano, 2006; Cereghetti et al, 2010; Gomes et al, 2011; Kasahara et al, 2013). Furthermore, the distribution of mitochondria in cells is dictated by the local need for energy or Ca2+ signaling (Li et al, 2004; Yi et al, 2004; Brough et al, 2005; Quintana et al, 2007; Abarca‐Rojano et al, 2009). As a consequence, mitochondria interact rather intimately with other organelles such as the endoplasmic reticulum (ER). This ER–mitochondria interaction is crucial for lipid transfer, initiation of autophagosome formation, determination of the mitochondrial fission site, and for establishment of Ca2+ microdomains (Rizzuto et al, 1993, 1998; Kornmann et al, 2009; Friedman et al, 2011; Rowland & Voeltz, 2012; Hamasaki et al, 2013; Korobova et al, 2013). Interestingly, it has recently been reported that GSC have very fragmented mitochondria while GDC have an elongated tubular mitochondrial network (Xie et al, 2015). We therefore tested whether this dichotomous mitochondrial morphology could explain the higher susceptibility of GSC to cytotoxic lymphocyte‐mediated killing. Here, using mouse and human glioma cell lines, as well as early‐passage glioma samples, we confirmed that GSC show fragmented mitochondria. Compared with GDC, GSC express a higher level of the mitochondrial pro‐fission protein DRP1, while expression of the pro‐fusion molecule MFN2 is reduced. GSC fragmented mitochondria are far more dynamic compared to the elongated mitochondria in GDC. Moreover, modulation of the ER–mitochondria contact either by manipulating the mitochondrial morphology, or with an artificial tether, modulates the glioma cell expression of certain glycans and susceptibility to cytotoxic lymphocyte‐mediated killing.
Results
The mitochondrial network in glioma stem‐like cells is very dynamic
To investigate GSC and GDC mitochondrial network dynamism, we first used the well‐characterized GL261 and U251 glioma cell lines, of mouse and human origin, respectively, and their GSC neurosphere (NS) derivatives mNS and NSU251. As expected, both mNS and NSU251 had a higher expression level of the stem cell markers CXCR4, MELK, PTCH, CD44, CD133, MSL1, and CD90 (Liu et al, 2006; Ehtesham et al, 2009; Dahlrot et al, 2013a,b, 2014), whereas GL261 and U251 GDC expressed a higher level of the differentiated glioma marker glial fibrillary acidic protein (GFAP) (Appendix Fig S1A and B). Both U251 and the GSC NSU251 were transfected with mitochondrial targeted RFP (mitoRFP), and mitochondrial morphology was analyzed by confocal microscopy. U251 displayed an elongated and reticulated mitochondrial network while NSU251 had pronounced fragmented mitochondria (Fig 1A). Average mitochondrial length was fourfold longer in U251 than in NSU251 (Fig 1A and B). Even YT‐Indy NK cells, used as control for a spherical cell shape, had mitochondria twofold longer than NSU251. This indicates that NSU251 mitochondrial morphology was not due to their spherical shape. These results were further confirmed by electron microscopy analysis (Fig 1C). Moreover, this finding was also true for the mouse GL261 GDC and its GSC derivative mNS (Fig 1D–F). This is in agreement with the recently reported shorter mitochondrial phenotype of GSC (Xie et al, 2015). Furthermore, this differential mitochondrial morphology between GDC and GSC was consistent with the expression of the mitochondrial shaping proteins, since U251 and GL261 cells tended to modestly but significantly express more of the mitochondrial fusion proteins mitofusin 1 and 2, as well as OPA1, while NSU251 and mNS expressed more of the mitochondrial pro‐fission protein DRP1 (Fig 1G–K).
Figure 1. Glioma cell mitochondrial morphology controls glycan surface expression.

-
AU251 human glioma cells, NSU251 human glioma stem‐like cells (GSC), and YT‐Indy NK cells expressing mitoRFP were analyzed by confocal microscopy.
-
BAverage mitochondrial length in U251, NSU251, and YT‐Indy cells.
-
CElectron micrographs of U251 and NSU251 cells.
-
DGL261 mouse glioma cells and mNS mouse GSC expressing mitoRFP were analyzed by confocal microscopy.
-
E, FAverage mitochondrial length (E) and electron micrographs (F) of GL261 and mNS cells.
-
G–JExpression of the mitochondrial shaping proteins MFN1, MFN2, OPA1, and DRP1 in U251 and NSU251 cells (G, H) or GL261 and mNS cells (I, J) analyzed by WB (G, I), and quantification by densitometry (H, J). Tom20 is used as a mitochondrial control and actin and histone H3 as loading controls.
-
K, LU251 and NSU251 cells (K) or GL261 and mNS cells (L) expressing mitoRFP and mitochondrial photoactivatable GFP were analyzed by time‐lapse confocal microscopy following photoactivation of GFP in a region of interest. The dilution of the GFP signal over time is a direct indication of the mitochondrial fusion events.
-
M–PHuman NS cells (M, N) and mouse NS cells (O, P) expressing mitoRFP were transfected or not with shRNA targeting Drp1 and mitochondrial length analyzed as before.
-
Q–TU251 cells (Q, R) and GL261 cells (S, T) expressing mitoRFP were transfected or not with shRNA targeting Mfn2 then mitochondrial length analyzed as previously.
-
U, VLeft panel: Wheat germ agglutinin (WGA) (U) or sambucus nigra lectin (SNA‐1) (V) staining of human NS cells expressing or not shRNA against Drp1 and U251 cells expressing or not shRNA against Mfn2 followed by flow cytometry analysis. Right panel: WGA (U) or SNA‐1 (V) staining of mNS cells expressing or not shRNA against Drp1 and GL261 cells expressing or not shRNA against Mfn2.
Interestingly, although GSC had fragmented mitochondria, these shorter organelles appeared far more dynamic than the longer mitochondria in GDC. This was assessed by a fusion assay consisting of following the dilution of the green fluorescence of photoactivatable mitoGFP co‐expressed with control mitoRFP (Fig 1K and L, and Appendix Fig S1C and D). However, these more dynamic mitochondria were poorly respiring, as indicated by their O2 consumption rate (Appendix Fig S1E and F). Note that NSU251, but not mNS mitochondria, were less responsive to the mitochondrial uncoupler FCCP, or rotenone plus antimycin A, inhibitors of the respiratory chain complex I and III, respectively. Interestingly, both mouse and human NS cells maintained their ATP pool when forced to use pyruvate (Appendix Fig S1G and H), in agreement with their normal expression pattern of subunits of the respiratory chain (Appendix Fig S1I and J) and the restricted set of metabolic enzymes we tested (Appendix Fig S1K and L). Together, these results indicate that in agreement with their cancer stem‐like cell phenotype, human and mouse GSC fragmented mitochondria are more dynamic but respire less than their GDC counterparts. Furthermore, although these two types of GSC shared a common mitochondrial morphology and dynamism, they still differed, to some extent, in their mitochondrial functions; this could reflect some inherent interspecies and tumor stage differences.
The glioma cell mitochondrial morphology regulates the surface expression of sialylated glycans
The cancer cell glycocalyx is a critical determinant of the sensitivity to cytotoxicity mediated by immune effector cells (Paszek et al, 2014). Therefore, we tested whether the fragmented mitochondria of GSC impact on plasma membrane topography through the surface expression of glycosylated moieties. Human and mouse NS mitochondrial length could be significantly increased by knocking down the expression of DRP1 (Fig 1M–P), which resulted in decreased stemness as measured by a limited dilution colony forming assay, without altering cell growth (Appendix Fig S2A and B); this result is in agreement with Xie et al (2015). Moreover, silencing DRP1 in both human and mouse glioma GSC did not significantly alter their respiration capacity, nor their ATP content, except for mNS ATP content assessed with pyruvate supplemented medium (Appendix Fig S2C–F). Conversely, U251 and GL261 mitochondrial length could be efficiently reduced by knocking down MFN2 expression (Fig 1Q–T), without altering short‐term cell growth (Appendix Fig S3A and B). Interestingly, when glioma cells were stained with wheat germ agglutinin (WGA), a lectin specific for sialic acid and N‐acetylglucosaminyl moieties, U251 and GL261 GDC exhibited brighter staining than their NSU251 and mNS GSC counterparts. Similar brighter staining was observed with sambucus nigra lectin (SNA‐1), which binds preferentially to sialic acid attached to terminal galactose in α‐2,6 and to a lesser degree in α‐2,3 linkage (Fig 1U and V, and Appendix Fig S4A–C). Moreover, NS cells expressed more surface chondroitin sulfate than U251 and GL261 cells, whereas all have similar surface expression of heparin sulfate (Appendix Fig S4D and E, and data not shown). We focused on the sialylated glycan expression since it was consistently more highly expressed by GDC than GSC; it was also similar between the mouse and human glioma models and could putatively share an identical determinant. Very interestingly, forced elongation of the mitochondrial length in GSC following DRP1 knockdown (NSU251‐DRP1sh and mNS‐Drp1sh) resulted in a significant increase in WGA staining, bringing it to the level obtained for U251 and GL261 GDC (Fig 1U). In a reciprocal manner, knocking down the expression of MFN2 in GDC (U251‐MFN2sh and GL261‐Mfn2sh), which shortens mitochondrial length, resulted in a significant reduction of WGA staining (Fig 1U). Similarly, knocking down DRP1 expression significantly increased SNA‐1 staining in NSU251, while silencing MFN2 expression in U251 and GL261 markedly reduced SNA‐1 staining (Fig 1V). Moreover, a systematic glycan profiling by lectinship analysis using total membranes (endomembranes and plasma membrane) of GL261 and mNS did not show any significant differences in glycan expression (Appendix Fig S4F), suggesting that GSC and GDC do not have any major defect in glycan biosynthesis, but differ in their ability to express some glycans at the cell surface. This was further supported by RNAseq data from GL261 and mNS showing that the mRNA encoding most of the glycosyltransferase were highly expressed in both GSC and GDC, with few exceptions. The mRNA encoding for β‐1,3‐N‐acetylglucosaminyltransferase, lactosamine α‐2,3‐sialyltransferase, α‐N‐acetyl‐neuraminyl‐2,3‐β‐galactosyl‐1,3‐N‐acetyl‐galactosaminide α‐2,6‐sialyltransferase, β‐1,3‐galactosyltransferase, 2‐hydroxyacylsphingosine 1‐β‐galactosyltransferase, β‐1,4‐galactosyltransferase 4, and β‐galactoside alpha‐2,6‐sialyltransferase 1, all involved in different steps of glycolipid synthesis, were more expressed in mNS than in GDC (data not shown). On the other hand, the mRNA encoding β‐1,3‐galactosyltransferase 5 that transfers galactose to o‐link glycans and β‐1,4‐galactosyltransferase 6 required for the biosynthesis of glycosphingolipids were better expressed in GDC than in GSC (data not shown). Moreover, none of these GDC and GSC presented any marked defect in their endocytosis and exocytosis capacity, as tested by Texas Red‐labeled dextran endocytosis (Appendix Fig S5A–D) and by 35S‐methionine metabolic labeling (data not shown), suggesting that vesicle trafficking might not be altered in these cells. Taken together, these results indicate that the glioma cell mitochondrial morphology controls the surface expression of certain sialylated glycans.
ER–mitochondria interaction is a determinant of glycan surface expression in GSC
To characterize how the mitochondrial morphology could modulate the surface expression of some sialylated glycans, we compared the mitochondria‐associated membranes (MAM) in GDC and GSC. Cells were analyzed by electron microscopy and the average distances between ER and the mitochondria, as well as the average MAM length, were quantified. In a very conservative manner we considered that the ER interacts with mitochondria when the distance between the two organelles is inferior or equal to 15 nm (Csordas et al, 2006). We observed that the average ER–mitochondria distance was significantly longer in mNS than in GL261, whereas there was no difference between NSU251 and U251 (Fig 2A). This resulted in a greater proportion of mitochondria that were further apart from the ER in mNS than in GL261 (Fig 2B), but not between NSU251 and U251 (Fig 2C). Interestingly, the average MAM length was not affected in mNS compared with GL261, but tended to be shorter in NSU251 compared to U251 glioma cells (Fig 2D). Moreover, the percentage of mitochondria with MAM was significantly lower in mNS, with a similar trend in NSU251 (Fig 2E). Together, these results suggest that either in the ER–mitochondria distance or the MAM length, GSC present some alteration in the ER–mitochondria contacts. Therefore, we tested the ability of GSC mitochondria to uptake Ca2+, a process that is strongly dependent on their interaction with the ER. Upon stimulation with ATP plus carbachol, both NSU251 and mNS GSC overexpressing mitochondrial targeted calcium sensor 4mitD3CP experience reduced mitochondrial Ca2+ uptake, as compared to their U251 and GL261 GDC counterparts expressing 4mitD3CP (Fig 2F). Although additional independent repeats would have made these data stronger, these results are in agreement with the observed defect in the ER–mitochondria contact in GSC. This reduced mitochondrial Ca2+ uptake in the GSC compartment correlates well with the slight increase in the basal cytosolic Ca2+ levels and faster elevation in response to thapsigargin when tested in the presence of extracellular Ca2+ in GSC (Appendix Fig S6A–D), particularly in mNS (Appendix Fig S6C and D). Both human and mouse GSC and GDC did not differ significantly in their Ca2+ store, while the capacity for calcium entry was only significantly different in the mouse model (Appendix Fig S6C and D). While the expression of PIPIP51, Eif2ak3, Bap31, and Fis1 ER–mitochondria tethering factors was similar between GSC and GDC, GSC presented a very modest increase in the expression of Park7 and GRP75, and a reduction in MFN2 expression (Appendix Fig S6E and F, and Figs 1G–J and 7D). In fact MFN2 expression was consistently lower in the GSC and this tendency was most pronounced for NS904 low‐passage GSC (Fig 7D), in agreement with the implication of MFN2 as a ER–mitochondria tether (de Brito & Scorrano, 2008).
Figure 2. ER–mitochondria contacts regulate surface glycan expression.

-
ASchematic (left panel) and quantification of the ER–mitochondria distance in GL261 and mNS cells (middle panel) or in U251 and NSU251 cells (right panel) from electron microscopy images.
-
B, CDistribution of the mitochondria as a function of the distance to the ER for GL261 and mNS cells (B) or U251 and NSU251 cells (C).
-
DSchematic (left panel) and quantification of the average length of the mitochondrial associated membrane (MAM) from electron microscopy images of GL261 and mNS cells (middle panel) or U251 and NSU251 cells (right panel).
-
EQuantification of the percentage of mitochondria with MAM in GL261 and mNS cells (left panel) or U251 and NSU251 cells (right panel).
-
FDifferentiated glioma and glioma stem‐like cells overexpressing the mitochondrial targeted calcium sensor 4mitD3CPV were stimulated with 100 μM ATP and 3 μM carbachol, and maximum mitochondrial calcium uptake was followed by measuring the ratio of emission at 535/480 nm.
Figure 7. NS904 GSC cells are more sensitive to killer cells than GE904 GDC cells.

- GE904 and NS904 cell expression profile of mRNA encoding for GFAP, CD44, NOTCH, SOX2, and MSL1.
- GE904 and NS904 cells expressing mitoRFP were analyzed by confocal microscopy.
- Quantification of the average mitochondrial length of cells from (B).
- Expression of the mitochondrial shaping proteins MFN1, MFN2, OPA1, and DRP1 in GE904 and NS904 cells analyzed by WB.
- NS904 cells are better killed by NK cells than GE904 cells. GE904 and NS904 cells were labeled with CFSE and incubated for 4 h with YT‐Indy NK cells at various E:T ratios in the presence of anti‐HLA‐ABC antibody. Target cell death was monitored by Draq7 staining and FACS analysis by gating on the CFSE‐positive cells.
To test whether this ER–mitochondria contact defect could explain the lower sialylated glycan surface expression in NSU251 and mNS GSC, we tested the effect of forced contact between these two organelles using an artificial tether. This artificial tether OMM‐ER consisted of residues 34–63 of A‐kinase anchor protein 1 (AKAP1) that inserts into the outer mitochondria membrane (OMM) linked to the N‐terminal of RFP cloned upstream of residues 283–303 of UBC6 ER transmembrane domain (Csordas et al, 2006). The OMM construct used as a negative control lacked the UBC6 ER transmembrane domain. OMMER expression did not modify the average mitochondrial length in NSU251 and mNS (Fig 3A and B), however, this forced contact between ER and mitochondria increased SNA‐1 staining in mNS (Fig 3C and D) and increased WGA staining in NSU251 (Fig 3E and F). Moreover, both human (Fig 3G) and mouse (Fig 3H) OMMER expressing GSC were consistently more resistant to YT‐Indy NK cells and OT‐1 CTL, respectively. This indicates that ER–mitochondria contacts, rather than the actual mitochondrial length, are contributing determinants of GSC sialylated glycan surface expression, which are subsequently likely to impact on susceptibility to killing by cytotoxic immune cells.
Figure 3. ER–mitochondria artificial tethering does not affect mitochondrial length.

-
A, BDetermination of the mitochondrial morphology and length of NSU251 cells (A) and mNS cells (B) following expression of an artificial ER–mitochondria tether (OMM‐ER) or control tether (OMM). Images are representative of three independent experiments, and bar graphs are mean ± SD of three independent experiments.
-
C–FSurface glycan expression analysis by SNA‐1 staining (C, D) or WGA staining (E, F) of NSU251 cells (C, E) and mNS cells (D, F) following expression of an artificial ER–mitochondria tether (OMM‐ER) or control tether (OMM). Bar graphs are mean ± SD of three independent experiments.
-
GNSU251 glioma stem‐like cells (GSC) overexpressing OMM or OMMER were used as target for YT‐Indi NK cells. Draq7+ dead cells were monitored in the RFP+ tether‐expressing cells by flow cytometry. Data are representative of two independent experiments.
-
HSame as in (G) using mNS mouse GSC pulsed with OVA peptide and OT‐1 CTL as effector cells.
Glioma stem‐like cells are preferentially attacked by cytotoxic immune cells
To understand the physiological significance of the modulation of sialylated glycan surface expression by the mitochondrial morphology, we next compared GSC and GDC for their sensitivity to cytotoxicity mediated by immune cells. Both GL261 and mNS express similar levels of MHC class I, costimulatory molecules CD80 and CD86, while the CD54 adhesion molecule was slightly more expressed on GL261 (Appendix Fig S7A). Interestingly, ovalbumin‐peptide pulsed mNS were more efficiently killed by OT‐1 CTL compared to GL261 glioma cells at all the effector:target (E:T) cell ratios tested (Fig 4A). To further investigate this, we developed a novel two‐color cytotoxicity assay, in which mNS were labeled with calcein‐red orange (calcein‐RO) and GL261 with calcein AM before peptide loading and simultaneous incubation with OT‐1 CTL (Bassoy et al, 2016). The cytotoxicity toward each target cell type was assessed by quantifying the release of each calcein dye in the supernatant (Appendix Fig S7B). Even when encountering the CTL simultaneously, mNS were significantly and consistently more efficiently killed than GL261 glioma cells (Fig 4B). Similar results were obtained in the dye swap experiments in which mNS were labeled with calcein AM and GL261 with calcein‐RO (data not shown). This was also true for NSU251 compared to U251. Both U251 and NSU251 expressed similar levels of HLA class I, CD80, CD86, CD54, and NK cell activating ligand MICA/B (Appendix Fig S7C); however, NSU251 were significantly more efficiently killed than U251 cells by the human NK cells YT‐Indy at all the E:T ratios tested, whether in the classical single color cytotoxic assay (Fig 4C), or with the new two‐color cytotoxic assay (data not shown). To test whether this differential killing could be due to a defect of the apoptotic machinery in the glioma cells, mNS and GL261 were treated with purified human granzyme B (GB) and a sublytic dose of perforin (P). Surprisingly, GB and P killed GL261 cells slightly but significantly more efficiently than mNS (Appendix Fig S7D). This can be explained by the ability of GL261 to uptake more GB, which is a very cationic protein (Appendix Fig S7E), in agreement with GL261 expressing more negatively charged surface sialylated glycans than mNS. These results show that the apoptotic machinery of these two types of cells is functional. This was further confirmed by the similar expression of mRNA encoding cell death‐related proteins (Appendix Fig S7F). Taken together, our results indicate that both human and mouse GSC are preferentially killed by cytotoxic effector cells. It is therefore possible that the higher susceptibility of GSC to killer lymphocytes resulted from better cell–cell contact. To test this hypothesis, calcein AM‐labeled mNS and calcein blue‐labeled GL261 were incubated simultaneously with CTL in which cytotoxic granules were labeled with lysotracker red to monitor granule polarization during the course of the E:T interactions. The dynamics of the killer cell attack was followed by live cell imaging. As expected, CTL consistently and preferentially engaged with mNS rather than GL261 cells (Fig 4D). Moreover, these CTL:mNS conjugates yielded more functional immunological synapses as seen by the higher rate of CTL with polarized granules (granules at the interface of the two cells) compared to conjugates involving GL261 cells (Fig 4E). The functionality of these immunological synapses was further confirmed by monitoring the cytotoxic granule polarization time, which we defined as the time lapse between the initial stable contact of the effector with a target cell and the polarization of the granules. The granule polarization time was almost halved for the CTL:mNS compared with the CTL:GL261 conjugates (Fig 4F), indicating that CTL contact with mNS results in more effective activation. We obtained similar results in the dye swap experiments where calcein blue‐labeled mNS and calcein AM‐labeled GL261 were used (data not shown). Moreover, using human GSC and GDC facing YT‐Indy human NK effector cells, we observed a comparable enhanced GSC sensitivity to lysis as seen in mouse cells (Fig 4G–I). Taken together, our results clearly show that both NK cells and CTL preferentially and more efficiently engage and kill GSC than GDC.
Figure 4. GSC are better contacted and killed by cytotoxic lymphocytes.

-
AGL261 and mNS cells were pulsed or not with peptide and used as target for OT‐1 CTL in a 4‐h calcein AM release assay.
-
BGL261 and mNS cells were loaded with calcein AM and calcein‐RO, respectively, then pulsed with peptide and incubated simultaneously with OT‐1 CTL in a dual‐color cytotoxicity assay. The cytotoxicity toward each target is followed by measuring the release of the respective calcein in the supernatant.
-
CU251 and NSU251 cells were used as target for YT‐Indy effector cells in calcein AM assay.
-
DPeptide‐loaded calcein blue‐labeled GL261 cells (blue) and calcein AM‐labeled mNS cells (green) were incubated with Lysotracker red‐labeled OT‐1 CTL (red) and the dynamics of the interactions analyzed by live cell imaging.
-
E, FThe percentage of conjugates involving polarized CTL (E) and the granule polarization time (F) from panel (D) were quantified.
-
GCalcein AM‐labeled U251 cells (green) and calcein blue‐labeled NSU251 cells (blue) were incubated with Lysotracker red‐loaded YT‐Indy (red) and the dynamics of the interactions analyzed by live cell imaging.
-
H, IThe percentage of conjugates involving polarized YT‐Indy cells (H) and the granule polarization times (I) from panel (G) were quantified.
The mitochondrial morphology and glycan expression at the cell surface modulate glioma cell sensitivity to killer lymphocytes
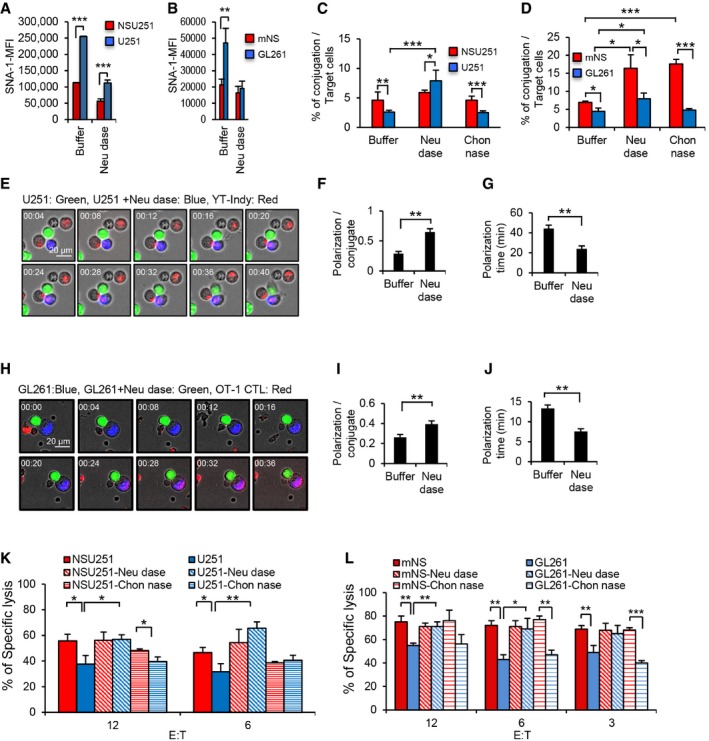
Next, we investigated the contribution of the surface sialylated glycans on GSC and glioma cell susceptibility to killing by cytotoxic immune cells. Neuraminidase pretreatment, which removes sialic acid, did not modify the expression of MHC class I molecules, CD80, CD86, CD54, and MICA/B (Appendix Fig S8A and B), but brought U251 and GL261 staining with SNA‐1 to the level of their respective GSC counterparts (Fig 5A and B). As expected, NSU251 made more conjugates with YT‐Indy than did U251 (Fig 5C). Interestingly, neuraminidase pretreatment significantly increased the ability of U251 to form conjugates with YT‐Indy, while chondroitinase pretreatment had no effect (Fig 5C). Comparable results were obtained when GL261 was pretreated with neuraminidase (Fig 5D). Note that mNS pretreated with neuraminidase or chondroitinase made even more conjugates with the CTL than untreated mNS, although neuraminidase pretreatment did not significantly reduce mNS SNA‐1 staining. To further validate these datasets, U251 pretreated or not with neuraminidase was incubated with YT‐Indy, and the dynamics of the contacts were followed by live cell imaging (Fig 5E). YT‐Indy preferentially entered in contact with neuraminidase‐pretreated U251 cells (Fig 5E) and these interactions were more productive, since cytotoxic granule polarization was more frequent and faster (Fig 5F and G). We obtained the same results when GL261 cells, pretreated or not with neuraminidase, were peptide loaded and incubated with OT‐1 CTL (Fig 5H–J). Furthermore, neuraminidase but not chondroitinase pretreatment restored the sensitivity of U251 to YT‐Indy killer cells to the level of NSU251 at all the E:T ratios tested (Fig 5K). Similarly, pretreatment with neuraminidase, but not chondroitinase, also restored GL261 killing by OT‐1 CTL at all the E:T ratios (Fig 5L). Taken together, these results indicate that cancer cell plasma membrane topography is a critical determinant for contact with and killing by cytotoxic immune effector cells.
Figure 5. Sialylated surface glycan expression modulates interaction with immune cells.
-
A, BU251 and NSU251 cells (A) or GL261 and mNS cells (B) treated or not with neuraminidase were stained with SNA‐1 and analyzed by flow cytometry.
-
C, DU251 and NSU251 cells (C) or peptide pulsed GL261 and mNS cells (D) treated or not with neuraminidase (Neu dase) or chondroitinase (Chon nase) as control were labeled with calcein AM and incubated with calcein‐RO labeled YT‐Indy or OT‐1 effector cells respectively. Conjugate formation was followed by flow cytometry, gating the double‐stained doublets.
-
EU251 cells labeled green with calcein AM and neuraminidase‐pretreated U251 cells labeled blue with calcein blue were incubated with Lysotracker red‐labeled YT‐Indy cells and the dynamics of the interaction followed by live imaging.
-
F, GThe percentage of conjugates involving polarized YT‐Indy cells (F) and the granule polarization times (G) from panel (E) were quantified.
-
HGL261 cells labeled blue with calcein blue and neuraminidase‐pretreated GL261 cells labeled green with calcein AM were both peptide loaded and incubated with OT‐1 CTL labeled with Lysotracker red and the dynamics of the interaction followed by live imaging.
-
I, JThe percentage of conjugate involving polarized CTL (I) and the granule polarization times (J) from panel (H) were measured.
-
KNSU251 and U251 cells treated or not with neuraminidase or chondroitinase were used as targets for YT‐Indy effector cells during a 4‐h calcein AM release assay.
-
LMouse NS and GL261 cells treated or not with neuraminidase or chondroitinase were peptide loaded then used as target for OT‐1 CTL during a 4‐h calcein AM release assay.
Since we had found that manipulating the mitochondrial morphology modulated the surface expression of certain glycans, we therefore tested its effect on GSC and GDC interaction with immune cells. Manipulation of the mitochondrial length in GSC or GDC did not change the expression pattern of MHC class I molecules, CD80, CD86, CD54, or MICA/B (Appendix Fig S8C and D). However, compared to NSU251, NSU251‐DRP1sh with longer mitochondria, interacted less efficiently with YT‐Indy killer cells (Fig 6A), with lower occurrence of granule polarization and longer periods of polarization (Fig 6B and C), indicating that the immune synapses established under these conditions were less effective at facilitating effector cell activation. Similarly, mNS‐Drp1sh with elongated mitochondria gave rise to poor contact with OT‐1 CTL, with increased granule polarization time (Fig 6D–F). Reciprocally, U251‐MFN2sh with shorter mitochondria were preferentially recognized by YT‐Indy cells, with shorter granule polarization time compared to U251 (Fig 6G–I). Similar results were obtained when comparing GL261 and GL261‐Mfn2sh (Fig 6J–L). These results were further supported in the killing assay, as forced elongation of the mitochondrial length in NSU251‐DRP1sh inhibited their killing, lowering it to the level of U251 killing at almost all the E:T ratios tested (Fig 6M). Reciprocally, forced shortening of the mitochondria in U251‐MFN2sh drastically increased their killing to the level of NSU251 (Fig 6M). Mouse NS‐Drp1sh cells were more resistant to OT‐1 CTL than mNS, and reciprocally, GL261‐Mfn2sh became more sensitive than GL261 to the same CTL (Fig 6N). Note that re‐expression of DRP1 in the knockdown NS cells restored the mitochondrial length and NS cell susceptibility to CTL killing, indicating that our results were specific to DRP1 silencing (Appendix Fig S9).
Figure 6. Glioma cell mitochondrial morphology regulates their sensitivity to killer cells.

-
ABlue NSU251 cells and green NSU251 hDRP1sh cells silenced for DRP1 were incubated with Lysotracker red‐stained YT‐Indy killer cells and analyzed by live cell imaging.
-
B, CThe percentage of conjugates involving polarized YT‐Indy cells (B) and the granule polarization times (C) from panel (A) were measured.
-
DBlue mNS cells and green mNS mDrp1sh cells silenced for mouse Drp1 were peptide loaded, incubated with Lysotracker red‐stained OT‐1 CTL and analyzed by live cell imaging.
-
E, FThe percentage of conjugate involving polarized CTL (E) and the granule polarization times (F) from panel (D) were measured.
-
GGreen U251 cells and blue U251 MFN2sh cells silenced for human MFN2 were incubated with Lysotracker red‐loaded YT‐Indy cells and analyzed by live cell imaging.
-
H, IThe percentage of conjugate involving polarized YT‐Indy cells (H) and the granule polarization times (I) from panel (G) were measured.
-
JGreen GL261 cells and blue GL261Mfn2sh cells silenced for mouse Mfn2 were peptide loaded, incubated with Lysotracker red‐labeled OT‐1 CTL, and analyzed by live cell imaging.
-
K, LThe percentage of conjugates involving polarized CTL (K) and the granule polarization times (L) from panel (J) were measured.
-
MU251, U251MFN2sh, NSU251, and NSU251DRP1sh cells were used as target for YT‐Indy killer cells in a 4‐h calcein release assay.
-
NGL261, GL261Mfn2sh, mNS, and mNSDrp1sh cells were peptide loaded and used as target for OT‐1 CTL in a 4‐h calcein release assay.
We then tested whether our results were also valid for early‐passage human glioma samples that were directly cultured from the patient biopsy either in standard culture conditions to generate GDC GE904, or under NS conditions to generate the GSC counterpart NS904. NS904 expressed higher levels of the stem cell markers CD44, Sox2, Notch, and MSL1, while GE904 had a higher expression of the GFAP differentiated glioma marker, as assessed by NanoString RNA profiling (Fig 7A). GE904 displayed a very elongated mitochondrial morphology, while the NS904 mitochondria were fragmented (Fig 7B and C), in agreement with their expression profile of the mitochondrial shaping protein (Fig 7D). This differential mitochondrial phenotype between GE904 and NS904 agreed with results presented in Fig 1A, B, D, and E as well as with Xie et al (2015). As for the mNS and NSU251 lines that were generated from high‐passage differentiated cultures, the NS904 cultured as NS directly from the biopsy were also more sensitive to YT‐Indy NK cell killing than GE904 (Fig 7E); this was consistent with the surface glycan profiling (Fig 8A). Indeed, with the exception of SNA1, DBA, and GSL I, all the lectins used for the surface glycan profiling showed far brighter staining for GE904 than for NS904 (Fig 8A and Appendix Table S1). This indicates that these low‐passage GDC also have higher expression of surface glycosylated moieties than the low‐passage GSC. Moreover, as expected, silencing of MFN2 expression in GE904‐MFN2sh (Fig 8B bottom panel) resulted in shortening the average mitochondrial length compared to wild‐type GE904 (Fig 8B top panel and 8C), and also reversed the surface glycan expression assessed by lectin staining as previously demonstrated (Fig 8D). Interestingly, this shortening of the mitochondrial length also rendered GE904‐MFN2sh more sensitive to YT‐Indy cell killing (Fig 8E). We could not test whether forced elongation of the mitochondrial length in NS904 gives the reciprocal effect, since overexpression of MFN2 or silencing of DRP1 was lethal to these cells. However, most of our results could be extrapolated to the low‐passage glioma sample GE904/NS904. Moreover, a small re‐expression of MFN2 in the silenced GE904‐MFN2sh cells restored their mitochondrial length and their resistance to YT‐Indi cells to the level of the parental GR904 GDC (Appendix Fig S10), indicating that our results were specific to MNF2 silencing. Taken together, these results clearly show that manipulation of glioma cell mitochondrial morphology as a means to modulate their ER–mitochondria contact regulates the surface expression of certain glycans which directly impedes GSC and GDC ability to form conjugates and to be killed by cytotoxic immune effector cells.
Figure 8. The GE904 cell mitochondrial morphology control their surface glycome expression and susceptibility to NK cells.

- Surface glycan profiling of NS904 and GE904 cells stained with SNA‐1, WGA, Con A, SBA, DBA, UEA, RCA I, PNA, GSL I, PSA, LCA, PHA‐E, PHA‐L, SJA, and succinylated WGA lectins and analyzed by FACS. Bar graphs are mean ± SD of at least three independent experiments. **P ≤ 0.01, ***P ≤ 0.001 (one‐sided t‐test). For more information on the specificity of the lectins see Appendix Table S1.
- Expression of MFN2 (top panel) and mitochondrial morphology (bottom panel) in GE904 and GE904‐MFN2sh cells. Images are representative of four independent experiments.
- Quantification of the average mitochondrial length of cells analyzed in (B). Bars are mean ± SD of four independent experiments. ***P ≤ 0.001 (one‐sided t‐test).
- Surface glycan profiling of GE904 and GE904 MFN2sh cells analyzed as in (A). FACS histograms are representative of three independent experiments.
- GE904 MFN2sh cells are better killed by NK cells than GE904 cells. GE904 and GE904 MFN2sh cells were labeled with CFSE and incubated for 4 h with YT‐Indy NK cells at various E:T ration in the presence of anti‐HLA‐ABC antibody. Target cell death was monitored by Draq7 staining and FACS analysis by gating on the CFSE‐positive cells. Cytotoxicity bar graphs are mean of at least two experiments of duplicate points. *P ≤ 0.05, **P ≤ 0.01 (one‐sided t‐test).
Discussion
In this report, we have shown that when GSC are compared with GDC, they exhibit shorter and far more dynamic mitochondria with lower interaction with the endoplasmic reticulum (ER); they exhibit lower surface expression of certain glycans and they are better killed by cytotoxic lymphocytes. Interestingly, our results show a direct link between these parameters. The glycan surface expression is a determinant for cancer cell susceptibility to cytotoxic immune effector cells since neuraminidase pretreatment of glioma cells consistently and significantly increased their ability to be contacted and killed by effector cells, without affecting target cell surface expression of MHC class I molecules, CD80, CD86, and MICA/B. This is in agreement with the fact that independently of their biological function, bulky elements of the cancer cell glycocalyx can sterically hinder receptor organization, distribution, and activity (Paszek et al, 2014). Paszek and coworkers have demonstrated that a bulky glycocalyx enhances integrin clustering to augment adhesion that favors tumor invasiveness. This enhanced clustering would also reduce the freedom of diffusion of the glycocalyx, negatively affecting the formation of a functional immune synapse, in which integrins play a very important adhesive role (Margadant et al, 2011; Springer & Dustin, 2012; Comrie et al, 2015). Consequently, the bulkiness of the cancer glycocalyx would favor immune evasion of the cancer cells. Although we did not test for T‐cell and NK cell receptor clustering during the glioma:CTL and glioma:NK cell interactions, we observed that removing elements of the target cell glycocalyx enhanced the interactions of the conjugate. This resulted in faster cytotoxic granule polarization that we used as a readout of the functionality of these interactions and of killer cell activation. There is overwhelming evidence supporting a link between glycosylation and cancer development (Meezan et al, 1969; Wu et al, 1969; Singhal & Hakomori, 1990; Yamamoto et al, 2000; Bos et al, 2009; Drake, 2015; Wildburger et al, 2015). Glycocalyx remodeling also leads to some subsets of glycans being preferentially expressed by GSC (Hakomori, 2002; Dai et al, 2011; Tucker‐Burden et al, 2012). Our results highlight another mechanism by which glycan editing would facilitate glioma cell evasion from cytotoxic effector cells; we propose that they could be explored as a diagnostic tool for the prediction of patient responsiveness to immunotherapies. Of course this would require a better characterization of the tumor‐associated carbohydrate antigens (TACAs) linked to this glycome drift between GSC and GDC. It was reported that the membrane topography of adherent glioma cells is further complicated by the presence of microvilli and filopodia that could hinder the lethal hit from cytotoxic lymphocytes (Hoa et al, 2010). In our work, we could exclude the contribution of such microvilli and filopodia since GDC were detached with accutase before every challenge with CTL or NK cells. It is worth stressing that the difference of sensitivity to killer cells between GSC and GDC was not due to differences in medium composition. In fact, GDC and GDC with forced shortening of the mitochondrial length were cultured in the same medium, yet their sensitivity to cytotoxic lymphocytes differed according to their mitochondrial morphology and surface glycan expression. The same is true for GSC and GSC with forced elongation of their mitochondria. Moreover, it was recently reported that GSC have immunosuppressive action through the polarization of the tumor‐associated macrophages and the activation of myeloid suppressor cells (Wu et al, 2010; Zhou et al, 2015; Otvos et al, 2016). In line with our in vitro results indicating that when facing the killer cells, GSC are more efficiently eradicated, this immunosuppression in vivo could be a mechanism for GSC to avoid direct confrontation with fully activated cytotoxic lymphocytes.
Our results also show that mitochondrial morphology is a determinant for glycan surface expression. The lectinship results (Appendix Fig S3F) showed no difference in total glycan biosynthesis and branching between GDC and GSC. This is in agreement with their ability to maintain their ATP pool, and with the similar expression pattern of respiratory chain subunit and metabolic enzymes. In our cells, it seems more likely that GSC and GDC differed in their ability to bring some of these glycans to the cell surface. Nevertheless, we did not observe any major defect in endocytosis, nor in exocytosis processes between these glioma cells. The link between the mitochondrial morphology and the glycan surface expression came from the surprising observation that in our glioma models, the shorter mitochondria of GSC tend to interact less with the ER compared to those of their GDC counterparts and as a consequence, GSC mitochondria tend to uptake less Ca2+ compared to their GDC counterpart upon ER Ca2+ discharge. It is therefore possible that the small increase in GRP75 level in GSC could be a compensation mechanism to correct this reduced mitochondrial Ca2+ uptake observed in GSC; however, additional experiments will be necessary to test this hypothesis. Moreover, forced ER–mitochondria contact in GSC with an artificial tether increased the surface expression of some of these glycans without altering their mitochondrial length and consequently protected GSC from cytotoxic lymphocytes. This suggests that in the human and mouse glioma cells we used, these ER–mitochondria contacts directly contribute to the surface expression of some glycans that modulates their susceptibility to immune effector cells. Except for MFN2, most of the other ER–mitochondria tethering proteins tested were similarly expressed by GDC and GSC (Appendix Fig S6E and F, and Fig 1G and I) (Szabadkai et al, 2006; de Brito & Scorrano, 2008; Iwasawa et al, 2011; De Vos et al, 2012). It is likely that MFN2 might be critical in this process. However, we could not overexpress MFN2 in the GSC to further test its impact on the surface glycan expression. A role for MFN2 in the ER–mitochondria tether is in agreement with De Brito and Scorrano who first indicated a function of MFN2 in the tethering of the ER to the mitochondria (de Brito & Scorrano, 2008). ER–mitochondria contacts are essential for the establishment of Ca2+ microdomains, initiation of autophagosome formation, lipid transfer, and for the determination of the mitochondrial fission sites (Rizzuto et al, 1993, 1998; Kornmann et al, 2009; Friedman et al, 2011; Rowland & Voeltz, 2012; Hamasaki et al, 2013; Korobova et al, 2013). Since ER–mitochondria contacts determine the mitochondrial fission sites (Friedman et al, 2011), one might expect ER–mitochondria contacts to be increased in GSC, in contrast to our results. One possible explanation for this apparent discrepancy could come from the observation that both human and mouse GSC mitochondria are far more dynamic than GDC mitochondria, as seen in the fusion assay. This result suggests that GSC mitochondria must exhibit far more fission events to maintain the observed fragmented mitochondrial phenotype. This could ultimately end in a faster ER–mitochondria contact turnover, explaining the apparent alteration in the average distance and contact length between these two organelles. However, additional experiments would be necessary to test this hypothesis.
One remaining question of importance is how the ER–mitochondria contacts favor the surface expression of some sialylated glycans. As stated earlier, the contact sites between these two organelles are involved in the exchanges and the biosynthesis of metabolites such as lipids (Kornmann et al, 2009; Kornmann & Walter, 2010; De Mario et al, 2016). Therefore, one attractive possibility is that the difference in the density and length of the ER–mitochondria contacts could result in an altered biosynthesis or bioavailability of lipids essential for the surface expression of some glycans in the form of surface glycolipids. Nevertheless, more investigations will be necessary get a clear molecular understanding of how the ER–mitochondria contacts control the glycan surface expression in glioma cells. Moreover, it was recently reported that GSC have increased expression of the CD36 scavenger receptor required for their maintenance (Hale et al, 2014). It is possible that this receptor could allow GSC to recycle exogenous lipids as a compensation mechanism for any defect in endogenous lipid biosynthesis or bioavailability. However, further investigations are still necessary in order to test these hypotheses and better characterize the nature of the glycan moieties which are differentially expressed between GSC and GDC.
Lastly, the details of interaction between immune effector cells and glioma cells in vivo were also reported, bringing physiological significance to CTL:glioma and NK cell:glioma immunological synapses (Barcia et al, 2009; Yang et al, 2010). Therefore, it is likely that there could be an in vivo physiological significance of ER–mitochondria contacts and its effect on glioma surface glycan expression and its subsequent impact on the dynamics of interaction with immune effector cells. Indeed, although we did not directly test this in vivo, our results were also valid for early‐passage human GDC and GSC glioma samples which are likely to have conserved their key in vivo differentiation status. In future studies, it would be very interesting to test whether differential mitochondrial morphology and, contact with the ER, as well as surface glycome expression and susceptibility to killer cells are general features of cancer stem cells regardless of their histological type.
Taken together, our results show that in glioma cells, mitochondrial morphology and dynamism dictate the ER–mitochondria contacts that directly regulate the surface expression of some glycans and consequently determine their susceptibility to immune effector cells. These findings suggest that novel therapeutic approaches targeting the mitochondrial morphology and dynamism, or the ER–mitochondria contact sites, could push glioma cells toward a more differentiated and chemosensitive status. The inevitable residual stem‐like cells would remain accessible to subsequent cytotoxic T lymphocyte or NK cell‐mediated immunotherapy, capable of mediating long‐term immune protection.
Materials and Methods
Cell culture and reagents
GL261 and U251 cells were grown in Dulbecco's modified Eagle's medium (DMEM) (Gibco) with 10% fetal bovine serum (FBS) (Gibco) and supplements (100 U/ml penicillin G (Sigma‐Aldrich), 100 μg/ml streptomycin sulfate (Sigma‐Aldrich), 6 mM Hepes (Applichem), 1.6 mM l‐glutamine (Sigma‐Aldrich), 50 μM β‐mercaptoethanol (Bio‐Rad). GE904 were isolated from one patient biopsy and directly grown in the same medium supplemented with none‐essential amino acids. GL261, U251 and GE904 were harvested using accutase (Invitrogen) according to manufacturer's procedure. YT‐Indy, cells were grown in RPMI 1640 medium (Invitrogen) with 5% FBS and supplements.
Neurosphere formation and transfection
GL261 and U251 cells were cultured in neurosphere medium (DMEM/F12) medium supplemented with 100 U/ml penicillin G, 100 μg/ml streptomycin sulfate, 6 mM Hepes, 1.6 mM l‐glutamine, 50 μM β‐mercaptoethanol, B‐27 supplement (Invitrogen), 20 ng/ml recombinant basic fibroblast growth factor (basic‐FGF) (Invitrogen), and 20 ng/ml recombinant epidermal growth factor (EGF) (Invitrogen) and 50 U/ml heparin (Sigma). NS904 were isolated from the same patient biopsy directly grown in the NS medium supplemented with none‐essential amino acids. For each passage, spheres were dissociated with accutase (Invitrogen) and passaged into fresh media. Human and mouse neurospheres were transfected using the Neon electroporation system (Invitrogen). Briefly, 500,000 cells in buffer R were electroporated using 100 μl tips with 10 μg of the plasmids pmRFP‐N1 AKAP1 (34–63)‐mRFP encoding for OMM and pEGFP‐C1 AKAP1 (34–63)‐mRFP‐ER (UBC6) encoding for OMM‐ER artificial tether, a kind gift from Dr. Gyorgy Hajnoczky from Thomas Jefferson University Philadelphia USA. Cells were then plated with 2 ml of their respective medium. The electroporation parameters changed according to cell type (NSU251: 1,250 V, 40 mA, 1 pulse, mNS: 1,250 V, 30 mA, 1 pulse). Forty‐eight hours after transfection, cells were harvested for glycan cell surface expression analyses.
Mice and CTL isolation
OT‐1 mice were bred in the SPF animal facility at the CMU and used between 6 and 12 weeks of age according to approved animal protocols. CTLs were isolated from the OT1 splenocytes. Mouse spleen was filtered through a 70‐μm gauge strainer (Becton Dickinson) and incubated in red blood cell lysis buffer (RBC) (8.26 g ammonium chloride (NH4CI), 1 g potassium bicarbonate (KHCO3), 0.037 g EDTA dissolved in 1 l of water) at 37°C for 10 min. Sample was spun for 5 min at 315 g, supernatant was decanted, and pellet was re‐suspended in 1 ml of complete medium with 10 μg/ml OVA peptide (OVA 257–264: SIINFEKL) (Polypeptide group, USA) for 1 h for CTLs. Cells were washed and maintained in RPMI 1640 medium. Every 48 h, 50 U/ml of human interleukin‐2 was added. Grown cytotoxic T cells were used starting from the day 6 of culture.
Cell phenotyping
Surface expression of CD80, CD86, HLA‐ABC, CD54, MICA/B antigens was detected with anti‐mouse CD86, CD80 (B7‐1), MHC class I, anti‐human; CD86, CD80, HLA‐ABC, MICA/B from BD Biosciences.
Glycan cell surface expression detection and removal
5 × 10⁴ cells were pelleted and dissociated well. Cells were washed twice with buffer (0.5% BSA, in PBS) and resuspended in 2.5 μg/ml of lectin as a final concentration. Non‐treated cells were used as a control. Neuraminic acid and Chondroitin were analyzed by using biotinylated sambucus nigra lectin (SNA‐1) and biotinylated Griffonia (Bandeiraea) simplicifolia lectin I (GSL I) (Vectorlabs), respectively. Some sialylated glycans were also detected with WGA from Triticum vulgaris (Genetex). For additional lectins see Appendix Table S1. Biotinylated lectins were incubated 15 min at room temperature, then washed three times, and detected with streptavidin Alexa Fluor 647 conjugated (Life Technologies). Anti‐chondroitin sulfate antibody (Sigma), anti‐heparan sulfate (US Biological) were used to detect chondroitin sulfate and heparin sulfate, respectively. Streptavidin or antibodies were incubated 20 min at 4°C. After washing cells three times, they were resuspended in secondary antibody goat anti‐mouse Alexa 488 (Invitrogen). Following the washing steps, samples were analyzed by using Accuri flow cytometer (BD). In certain cases samples were analyzed using Cyan cytometer (BD). Cell surface glycans were removed by using neuraminidase from Clostridium perfringens or chondroitinase ABC from Proteus vulgaris (Sigma‐Aldrich). Cells were treated with 30 mU/ml enzyme in culture medium for 2 h at 37°C then washed before evaluation of glycan surface expressions. Lectinship analysis of GL261 cells and mNS total membrane was performed by GlycoTechnica Ltd Japan.
Conjugation experiment
106 target cells and 106 effector cells each in 1 ml of PBS with 10 mM Hepes, pH 7.4, were separately labeled with 0.5 μM calcein AM and 0.1 μM calcein‐RO, respectively, for 10 min at 37°C. After three washes in same buffer, 5 × 10⁴ effector cells in 50 μl were co‐incubated with an equal volume of target cells in 1:1 or 2:1 E:T ratios. The cells were centrifuged at 100 g for 10 s and then incubated at 37°C for 15 min without agitation. After, cells were fixed in 200 μl ice‐cold fixation buffer (0.5% paraformaldehyde in PBS). Samples were analyzed by flow cytometry (CyAn™ ADP Analyzer, Beckman Coulter) gating on the double stain doublets. Results were expressed as a percentage of total effector cells.
FACS‐based CTL killing assay
Target cells were labeled with CFSE, and plated in a 96 U‐bottom well plate with YT‐Indy NK cells at various E:T ratios in a final volume of 100 μl. Cells were then stained with Draq7 (BioStatus Limited) according to the manufacturer's procedure then harvested and analyzed by flow cytometry. The percentage specific lysis was calculated with the following formula:
Calcein cytotoxicity assay
106 target cells in 1 ml were loaded with 1 μM calcein AM for 15 min at 37°C and washed three times. 1 × 10⁴ target cells per well (triplicate) in 0.1 ml medium (HBSS containing 1.55 mM CaCl2, 17.5 mM glucose, 10 mM Hepes, pH 7.4) were incubated with same volume of CTL or NK cells in various E:T cell ratios in 96‐well V‐bottom plate. When using OT‐1 CTL as effector cells the targets are leaded with OVA peptide. Plate was spun at 114 g for 1 min and incubated for 4 h at 37°C. After incubation, plate was spun for 5 min at 526 g and 80 μl/well of supernatants was transferred to a clear bottom black plate to read fluorescence using a 490/520 nm excitation/emission filter at SpectraMax, Paradigm Microplate Reader (Molecular device Sunnyvale, CA, USA).
Two‐color cytotoxicity assay
Two‐color assay was used to compare the killing of two different target cell types simultaneously from the same effector cells. First type of target cells (106/ml) was loaded with 1 μM calcein AM while the second type of target cells was loaded with 1 μM calcein‐RO (Invitrogen) for 15 min at 37°C. After three washes, target cells from both populations are mixed at 1:1 ratios in the same well keeping the total target cell number 104 in 0.1 ml. Mixed target cells were incubated with 0.1 ml CTL or NK cells in various E:T cell ratios as indicated. After 4‐h incubation, data were acquired by reading the fluorescence at 544/590 nm excitation/emission for the calcein‐RO‐labeled targets and 490/520 nm for the calcein AM‐labeled targets. % lysis was calculated as it is mentioned before. Measurements of each fluorescence in the supernatant give the % of killing of each target cell type. For a given cell line, it is expected that % killing obtained with calcein AM assay = % killing obtained with calcein‐RO assay. However since the calcein‐RO is less effectively released than the calcein AM, the specific lysis obtained from the calcein‐RO must be adjusted with a correction factor (CF). For each target at each E:T ratio CF = % killing with calcein AM assay − % killing with calcein‐RO assay, obtained from single color assay for each calcein. After adjustment of calcein‐RO data with the CF, it is virtually as if the two calcein behaved exactly in a similar manner. So after correcting the data from the calcein‐RO any difference left is the actual difference between the target cell types. The dye swap experiments were performed to validate the results.
Granzyme B uptake and loading experiments
Granzyme B uptake experiment was performed with 5 × 10⁴ U251, NSU251, Gl261 and mNS cells. They were washed two times in PBS and last wash was done in cell buffer (HBSS, 10 mM Hepes pH 7.2, 0.4% BSA, 3 mM CaCl2) and resuspended in 30 μl cell buffer with 20 nM of GB‐Alexa 647 and a sublytic dose of perforin (P) or with 30 μl buffer alone as a control. After 10‐min incubation at 37°C, samples were extensively washed and data acquired with Accuri flow cytometer (BD). For loading experiments, cells were prepared in cell buffer as previously and GB was added at different concentrations (16, 50, 150 and 450 nM) with sublytic dose of PFN for 1 h at 37°C. Cells were double stained with annexin V and propidium iodide (PI) (Life Technology). Cell death were determined by flow cytometry.
Mitochondrial morphology analysis
For imaging of mitochondrial network, 5 × 10⁵ cells of GL261, U251, mNS, NSU251, or YT stably expressing mitoRFP were seeded in 6‐cm plastic dishes. For NS or YT suspension cells, 0.1% gelatin was used to support cells on the bottom of the dish. After 24 h, cells were incubated in complete DMEM or NS medium and dishes were placed on the stage of a LSM510META microscope (Zeiss), and acquired with 575 longpass filter settings, and with an Achroplan 40 × 0.8 water immersion objective. Morphometric analysis was performed as described (Kasahara et al, 2013). For confocal z‐axis stacks of mitochondrial network, stacks of 10–20 images separated by 0.4 μm along the z‐axis were acquired. Total acquisition time for each stack was 1.1 s for the 20 planes to minimize reconstruction artefacts caused by mitochondrial movement. 3D reconstruction and volume rendering of the stacks were performed using the appropriate plugin of ImageJ (Wayne Rasband, NIH).
Mitochondrial fusion assay
For quantification of the mitochondrial fusion rate, 1 × 10⁵ cells seeded onto 24‐mm round glass coverslips were co‐transfected with mtRFP and mitochondrial photoactivatable GFP (mito‐pAGFP). After 24 h, cells were placed on the stage of Nikon A1r spectral microscope (Nikon) with temperature and CO2 controllers. Using NIS software (Nikon), regions of interest to be photoactivated were manually defined. To activate the pAGFP fluorescence, 1 z‐plane was activated using 100% of the power of the 413 nm laser line with a ×63, 1.4 NA objective. Frames were then acquired each minute using the 488 nm and the 563 laser lines for 30 min. Standard deviation of the green fluorescence in the whole cell was measured and normalized for the intensity of the mtRFP fluorescence using the NIS software (Nikon).
Quantitative real‐time reverse transcription polymerase chain reaction (qRT–PCR)
Total RNA was isolated from U251, NSU251, GL261, and mNS using TRIzol (Invitrogen) according to the manufacturer's instructions. RNA was reverse‐transcribed using Promega reverse transcription kit according to manufacturer's procedure. PCR was performed using SYBR Green PCR Master Mix on a Step One Plus Real‐Time PCR system (Applied Biosystems) with a comparative C T () method. The values of the relative expression levels of individual genes are normalized to those of β‐actin. Primer sequences are in Appendix Table S2.
Oxygen consumption rate
Measurement of intact cellular respiration was performed using the Seahorse XF24 analyzer (Seahorse Bioscience). Respiration was measured under basal condition, and in the presence of 1 μM ATP synthase inhibitor oligomycin, 0.75 μM FCCP uncoupler, 1 μM rotenone respiratory chain complex I inhibitor and 1 μM antimycin A complex III inhibitor. GL261 and U251 cells were plated at a density of 40,000 cells/well the day before of experiment. Briefly, cells were washed with unbuffered assay medium supplemented 25 mM glucose, 1 mM pyruvate, 4 mM glutamine (same as their culture medium) for 1 h in unbuffered assay medium at 37°C without CO2. NS was dissociated by accutase and plated at a density of 50,000 cells (to adjust to the number of adhesion control cells) per well in unbuffered assay medium supplemented 17.5 mM glucose, 0.5 mM pyruvate, 2.5 mM glutamine (same as their culture medium) on the experiment day for 1 h in unbuffered assay medium at 37°C without CO2. The plate was spun down at 336 g for 15 min to allow NS to attach for this assay without differentiating.
Transmission electron microscopy
Cells were fixed for 30 min at room temperature using glutaraldehyde at a final concentration of 2.5% (v/v) in PBS. Embedding and staining were performed as described (Scorrano et al, 2002). Thin sections were imaged on a Tecnai‐20 electron microscope (Philips‐FEI). Mitochondria and ER distance were analyzed using Metamorph (Molecular devices).
Determination of cellular ATP content
Total cellular ATP content was measured by luminescence. 1 × 10⁵ cells plated in 6‐well plates were incubated with additional 4.5 mg/ml glucose with or without 1 μg/ml oligomycin for 2 h. Cells were lysed with 0.5% trichloroacetic acid (V/V) in PBS and placed in white 96‐well plate together with ATP standard, placed directly into the chamber of a luminometer (Perkin Elmer). Light emission was recorded after addition of 100 μl of luciferin‐luciferase solution (Invitrogen). The content of ATP for each condition was normalized to the protein amount of each samples.
Ratiometric measurement of cytosolic Ca2+ concentration
Cells (106) were incubated at 37°C in Krebs Buffer (KRB, 125 mM NaCl, 5 mM KCl, 1 mM Na3PO4, 1 mM MgSO4, 5.5 mM glucose, 20 mM Hepes, pH 7.4) containing 1 mM Ca2+, and 1 μM Fura2‐AM (Molecular Probes). After 30 min, cells were washed in buffer free of Fura2 and resuspended in Ca2+‐free KRB at a density of 0.5 × 10⁶/ml. Ratiometric Ca2+ measurement were performed using excitation wave length 340 ± 5 and 380 ± 5 nm, and emission at 510 ± 15 nm at 37°C in a LS‐50B fluorimeter (Perkin Elmer) equipped with fast filter and magnetic stirring. Fura2 ratio values were converted into Ca2+ concentrations, using a K d for Ca2+ of 225 nM as described (Kasahara et al, 2013).
Ratiometric measurement of mitochondrial Ca2+ uptake
Glioma differentiated cells and GSC stably expressing the mitochondrial targeted calcium sensor 4mitD3CPV in Krebs Buffer (KRB, 125 mM NaCl, 5 mM KCl, 1 mM Na3PO4, 1 mM MgSO4, 5.5 mM glucose, 20 mM Hepes, pH 7.4) containing 1 mM Ca2+ were plated at 300,000 cells/well and spun at 935 g for 20 min in 96‐well black clear bottom plates to obtain an homogenous and continuous carpet of cells. Ratiometric Ca2+ measurement was performed using excitation wavelength 440 nm, and emission at 480 and 535 nm at 37°C using the FlexStation fluorimeter (Molecular Device) in the absence or in the presence of stimulation with 100 μM ATP plus 3 μM carbachol. 4mitD3CPV mitochondrial targeted calcium sensor construct was a kind gift from Dr. Maud Frieden.
Immunoblotting
GL261, U251 and NSs (approximately 106) were harvested and lysed in RIPA buffer (150 mM NaCl, 1% Nonidet P‐40, 0.25% deoxycholate, 1 mM EDTA, 50 mM Tris, pH 7.4) in the presence of complete protease‐inhibitor mixture (Roche). Extracted proteins (15–30 μg) were separated by 12% Tris‐glycine SDS–polyacrylamide gel, transferred onto polyvinylidene difluoride (PVDF, Bio‐Rad). Membranes were probed using the following antibodies: rabbit polyclonal anti‐MFN1 clone H65, sc‐50330; goat polyclonal anti‐Eif2ak3/PERK, clone C16, sc‐9481; mouse monoclonal anti‐DJ‐1/Park7 (clone A9), sc‐55573; rabbit polyclonal anti‐HSP60 H‐300, sc‐13966; rabbit polyclonal anti‐PISD E15, sc‐86197; rabbit polyclonal anti‐Tom40, H300, sc‐11414 (Santa Cruz Biotechnology); mouse monoclonal anti‐Tom20 (clone 4F3) MCA4300Z (AbD Serotec); mouse monoclonal anti‐MFN2 (clone 4H8), H00009927‐M03 (Abnova); mouse monoclonal anti‐OPA1 (clone 18/OPA1), 612607; mouse monoclonal anti‐DLP1 (clone 8/DLP1), 611113 (BD Biosciences); mouse monoclonal anti‐β‐actin (Sigma); rabbit polyclonal anti‐BAP31, GTX111939; rabbit polyclonal anti‐Fis1, GTX111010; Rabbit polyclonal anti‐PTPIP51, GTX54674; rabbit polyclonal anti‐GRP75, GTX104407 (Genetex); Total OXPHOS Human WB Antibody Cocktail (ab110411); rabbit polyclonal anti‐glucose‐6‐phosphatase (G6PTase) (ab83690); rabbit polyclonal anti‐fatty acid synthase (FAS) (ab82419); rabbit polyclonal anti‐glucokinase (ab137714); goat anti‐GAPDH (ab9483) (Abcam); rabbit anti‐glutamate dehydrogenase (GDH), MBS620515 (MyBiosource); and horseradish peroxidase‐conjugated secondary antibodies (Amersham) were used followed by detection by chemiluminescence (Amersham). Densitometry was performed using the appropriate plugin of ImageJ (Wayne Rasband, NIH).
Time‐lapse imaging of cytotoxic granules movement
To follow the kinetics of immune synapse formation and granules movement, target cells were stained with either 100 nM calcein AM or 2 μM calcein violet whereas effector cells were stained with 100 nM of Lysotracker Red DND‐99 (Life Technologies), for 15 min at 37°C. After two washes in HBSS, 7,500 cells of each target cell type were mixed with 15,000 effector cells in 100 μl of RPMI (10% FBS, without phenol red) in clear bottom 96‐well black plates (Greiner Bio one) and analyzed using the ImageXpress XL microscope and the MetaXpress software.
Endocytosis assay
Cells (0.5 × 10⁶) were incubated for 3 h in normal medium with 0.5 mg/ml Dextran Texas Red (Thermo Fisher) in a V‐bottom 96‐well plate and then washed with HBSS. Cells were either analyzed by confocal microscopy on laminin‐coated coverslips or by flow cytometry. Coverslips were fixed with 4% PFA, and images were acquired by Confocal Laser Scanning Microscopy 700 (LSM700, Zeiss) and a Plan‐Apochromat 63×/1.4 Oil objective. Flow cytometry was performed using a Beckman Coulter CyAn analyzer.
RNA sequencing analysis
The libraries were prepared with 1 μg of total RNA as starting material and processed with the Illumina TruSeq stranded total RNA (Ribo‐Zero Gold) kit according to the manufacturer's instruction. Libraries were sequenced according to 100 single‐read protocol on a HiSeq 2500 from Illumina. This experiments were performed at the iGE3 genomics platform of the University of Geneva (http://www.ige3.unige.ch/genomics-platform.php). Differential analysis was performed using the edgeR package (Robinson et al, 2010). Normalization factors were computed using the TMM technique, after which tagwise dispersions were calculated and subjected to an exact test. Resulting P‐values were subjected to Benjamini–Hochberg multiple testing correction to derive FDRs. The list of mouse glycosyltransferases was extracted from the SwissProt database with the keyword glycosyltransferase and further mapped on the whole list of differentially expressed genes. Heatmaps were generated using the R package heatmap.
Statistical analysis
Data represent mean ± SEM or mean ± SD of indicated number of independent experiments. Statistical significance has been calculated by a two‐tailed or one‐tailed Student's t‐test between samples, and P‐values are indicated in the legends.
Author contributions
DM directed the work. EYB, AK, VC, GJ, EB, SZ, CR, SP, VD, and MD performed experiments and analysis. NH did bioinformatics analysis. DM and PRW wrote the manuscript with the help of PYD.
Conflict of interest
The authors declare that they have no conflict of interest.
Supporting information
Appendix
Review Process File
Source Data for Figure 1
Acknowledgements
This work was supported by a grant from Foundation Privée des HUG, ERC starting grant ERC‐2010‐StG_20091118, Foundation Boninchi, Ambizione SNSF PZ00P3_126710/1, and grants from the Carlos and Elsie de Reuter Foundation and Schmidheiny Foundation. We thank Jean‐Marie Tiercy for the HLA typing.
The EMBO Journal (2017) 36: 1493–1512
See also: S Lakshminarayanan & L Scorrano (June 2017)
References
- Abarca‐Rojano E, Muniz‐Hernandez S, Moreno‐Altamirano MM, Mondragon‐Flores R, Enriquez‐Rincon F, Sanchez‐Garcia FJ (2009) Re‐organization of mitochondria at the NK cell immune synapse. Immunol Lett 122: 18–25 [DOI] [PubMed] [Google Scholar]
- Attardi G, Schatz G (1988) Biogenesis of mitochondria. Annu Rev Cell Biol 4: 289–333 [DOI] [PubMed] [Google Scholar]
- Avril T, Vauleon E, Hamlat A, Saikali S, Etcheverry A, Delmas C, Diabira S, Mosser J, Quillien V (2012) Human glioblastoma stem‐like cells are more sensitive to allogeneic NK and T cell‐mediated killing compared with serum‐cultured glioblastoma cells. Brain Pathol 22: 159–174 [DOI] [PMC free article] [PubMed] [Google Scholar]
- Bao S, Wu Q, McLendon RE, Hao Y, Shi Q, Hjelmeland AB, Dewhirst MW, Bigner DD, Rich JN (2006) Glioma stem cells promote radioresistance by preferential activation of the DNA damage response. Nature 444: 756–760 [DOI] [PubMed] [Google Scholar]
- Barcia C Jr, Gomez A, Gallego‐Sanchez JM, Perez‐Valles A, Castro MG, Lowenstein PR, Barcia C Sr, Herrero MT (2009) Infiltrating CTLs in human glioblastoma establish immunological synapses with tumorigenic cells. Am J Pathol 175: 786–798 [DOI] [PMC free article] [PubMed] [Google Scholar]
- Bassoy EY, Chiusolo V, Jacquemin G, Riccadonna C, Walker PR, Martinvalet D (2016) Glioma stemlike cells enhance the killing of glioma differentiated cells by cytotoxic lymphocytes. PLoS One 11: e0153433 [DOI] [PMC free article] [PubMed] [Google Scholar]
- Binello E, Germano IM (2011) Targeting glioma stem cells: a novel framework for brain tumors. Cancer Sci 102: 1958–1966 [DOI] [PMC free article] [PubMed] [Google Scholar]
- Bos PD, Zhang XH, Nadal C, Shu W, Gomis RR, Nguyen DX, Minn AJ, van de Vijver MJ, Gerald WL, Foekens JA, Massague J (2009) Genes that mediate breast cancer metastasis to the brain. Nature 459: 1005–1009 [DOI] [PMC free article] [PubMed] [Google Scholar]
- de Brito OM, Scorrano L (2008) Mitofusin 2 tethers endoplasmic reticulum to mitochondria. Nature 456: 605–610 [DOI] [PubMed] [Google Scholar]
- Brough D, Schell MJ, Irvine RF (2005) Agonist‐induced regulation of mitochondrial and endoplasmic reticulum motility. Biochem J 392: 291–297 [DOI] [PMC free article] [PubMed] [Google Scholar]
- Brown CE, Starr R, Martinez C, Aguilar B, D'Apuzzo M, Todorov I, Shih CC, Badie B, Hudecek M, Riddell SR, Jensen MC (2009) Recognition and killing of brain tumor stem‐like initiating cells by CD8+ cytolytic T cells. Cancer Res 69: 8886–8893 [DOI] [PMC free article] [PubMed] [Google Scholar]
- Castriconi R, Daga A, Dondero A, Zona G, Poliani PL, Melotti A, Griffero F, Marubbi D, Spaziante R, Bellora F, Moretta L, Moretta A, Corte G, Bottino C (2009) NK cells recognize and kill human glioblastoma cells with stem cell‐like properties. J Immunol 182: 3530–3539 [DOI] [PubMed] [Google Scholar]
- Castro MG, Cowen R, Williamson IK, David A, Jimenez‐Dalmaroni MJ, Yuan X, Bigliari A, Williams JC, Hu J, Lowenstein PR (2003) Current and future strategies for the treatment of malignant brain tumors. Pharmacol Ther 98: 71–108 [DOI] [PubMed] [Google Scholar]
- Cereghetti GM, Costa V, Scorrano L (2010) Inhibition of Drp1‐dependent mitochondrial fragmentation and apoptosis by a polypeptide antagonist of calcineurin. Cell Death Differ 17: 1785–1794 [DOI] [PMC free article] [PubMed] [Google Scholar]
- Chan DC (2006) Mitochondria: dynamic organelles in disease, aging, and development. Cell 125: 1241–1252 [DOI] [PubMed] [Google Scholar]
- Chen J, Li Y, Yu TS, McKay RM, Burns DK, Kernie SG, Parada LF (2012a) A restricted cell population propagates glioblastoma growth after chemotherapy. Nature 488: 522–526 [DOI] [PMC free article] [PubMed] [Google Scholar]
- Chen J, McKay RM, Parada LF (2012b) Malignant glioma: lessons from genomics, mouse models, and stem cells. Cell 149: 36–47 [DOI] [PMC free article] [PubMed] [Google Scholar]
- Comrie WA, Babich A, Burkhardt JK (2015) F‐actin flow drives affinity maturation and spatial organization of LFA‐1 at the immunological synapse. J Cell Biol 208: 475–491 [DOI] [PMC free article] [PubMed] [Google Scholar]
- Csordas G, Renken C, Varnai P, Walter L, Weaver D, Buttle KF, Balla T, Mannella CA, Hajnoczky G (2006) Structural and functional features and significance of the physical linkage between ER and mitochondria. J Cell Biol 174: 915–921 [DOI] [PMC free article] [PubMed] [Google Scholar]
- Dahlrot RH, Hansen S, Herrstedt J, Schroder HD, Hjelmborg J, Kristensen BW (2013a) Prognostic value of Musashi‐1 in gliomas. J Neurooncol 115: 453–461 [DOI] [PubMed] [Google Scholar]
- Dahlrot RH, Hermansen SK, Hansen S, Kristensen BW (2013b) What is the clinical value of cancer stem cell markers in gliomas? Int J Clin Exp Pathol 6: 334–348 [PMC free article] [PubMed] [Google Scholar]
- Dahlrot RH, Hansen S, Jensen SS, Schroder HD, Hjelmborg J, Kristensen BW (2014) Clinical value of CD133 and nestin in patients with glioma: a population‐based study. Int J Clin Exp Pathol 7: 3739–3751 [PMC free article] [PubMed] [Google Scholar]
- Dai L, Liu Y, He J, Flack CG, Talsma CE, Crowley JG, Muraszko KM, Fan X, Lubman DM (2011) Differential profiling studies of N‐linked glycoproteins in glioblastoma cancer stem cells upon treatment with gamma‐secretase inhibitor. Proteomics 11: 4021–4028 [DOI] [PMC free article] [PubMed] [Google Scholar]
- Dalerba P, Dylla SJ, Park IK, Liu R, Wang X, Cho RW, Hoey T, Gurney A, Huang EH, Simeone DM, Shelton AA, Parmiani G, Castelli C, Clarke MF (2007) Phenotypic characterization of human colorectal cancer stem cells. Proc Natl Acad Sci USA 104: 10158–10163 [DOI] [PMC free article] [PubMed] [Google Scholar]
- De Mario A, Quintana‐Cabrera R, Martinvalet D, Giacomello M (2016) (Neuro)degenerated Mitochondria‐ER contacts. Biochem Biophys Res Commun 483: 1096–1109 [DOI] [PubMed] [Google Scholar]
- De Vos KJ, Morotz GM, Stoica R, Tudor EL, Lau KF, Ackerley S, Warley A, Shaw CE, Miller CC (2012) VAPB interacts with the mitochondrial protein PTPIP51 to regulate calcium homeostasis. Hum Mol Genet 21: 1299–1311 [DOI] [PMC free article] [PubMed] [Google Scholar]
- Derouazi M, Di Berardino‐Besson W, Belnoue E, Hoepner S, Walther R, Benkhoucha M, Teta P, Dufour Y, Yacoub Maroun C, Salazar AM, Martinvalet D, Dietrich PY, Walker PR (2015) Novel cell‐penetrating peptide‐based vaccine induces robust CD4+ and CD8+ T cell‐mediated antitumor immunity. Cancer Res 75: 3020–3031 [DOI] [PubMed] [Google Scholar]
- Dimmer KS, Scorrano L (2006) (De)constructing mitochondria: what for? Physiology (Bethesda) 21: 233–241 [DOI] [PubMed] [Google Scholar]
- Drake RR (2015) Glycosylation and cancer: moving glycomics to the forefront. Adv Cancer Res 126: 1–10 [DOI] [PubMed] [Google Scholar]
- Dutoit V, Herold‐Mende C, Hilf N, Schoor O, Beckhove P, Bucher J, Dorsch K, Flohr S, Fritsche J, Lewandrowski P, Lohr J, Rammensee HG, Stevanovic S, Trautwein C, Vass V, Walter S, Walker PR, Weinschenk T, Singh‐Jasuja H, Dietrich PY (2012) Exploiting the glioblastoma peptidome to discover novel tumour‐associated antigens for immunotherapy. Brain 135: 1042–1054 [DOI] [PubMed] [Google Scholar]
- Ehtesham M, Mapara KY, Stevenson CB, Thompson RC (2009) CXCR4 mediates the proliferation of glioblastoma progenitor cells. Cancer Lett 274: 305–312 [DOI] [PMC free article] [PubMed] [Google Scholar]
- Friedman JR, Lackner LL, West M, DiBenedetto JR, Nunnari J, Voeltz GK (2011) ER tubules mark sites of mitochondrial division. Science 334: 358–362 [DOI] [PMC free article] [PubMed] [Google Scholar]
- Gomes LC, Di Benedetto G, Scorrano L (2011) During autophagy mitochondria elongate, are spared from degradation and sustain cell viability. Nat Cell Biol 13: 589–598 [DOI] [PMC free article] [PubMed] [Google Scholar]
- Hadjipanayis CG, Van Meir EG (2009) Tumor initiating cells in malignant gliomas: biology and implications for therapy. J Mol Med (Berl) 87: 363–374 [DOI] [PMC free article] [PubMed] [Google Scholar]
- Hakomori S (2002) Glycosylation defining cancer malignancy: new wine in an old bottle. Proc Natl Acad Sci USA 99: 10231–10233 [DOI] [PMC free article] [PubMed] [Google Scholar]
- Hale JS, Otvos B, Sinyuk M, Alvarado AG, Hitomi M, Stoltz K, Wu Q, Flavahan W, Levison B, Johansen ML, Schmitt D, Neltner JM, Huang P, Ren B, Sloan AE, Silverstein RL, Gladson CL, DiDonato JA, Brown JM, McIntyre T et al (2014) Cancer stem cell‐specific scavenger receptor CD36 drives glioblastoma progression. Stem Cells 32: 1746–1758 [DOI] [PMC free article] [PubMed] [Google Scholar]
- Hamasaki M, Furuta N, Matsuda A, Nezu A, Yamamoto A, Fujita N, Oomori H, Noda T, Haraguchi T, Hiraoka Y, Amano A, Yoshimori T (2013) Autophagosomes form at ER‐mitochondria contact sites. Nature 495: 389–393 [DOI] [PubMed] [Google Scholar]
- Hoa N, Ge L, Kuznetsov Y, McPherson A, Cornforth AN, Pham JT, Myers MP, Ahmed N, Salsman VS, Lamb LS Jr, Bowersock JE, Hu Y, Zhou YH, Jadus MR (2010) Glioma cells display complex cell surface topographies that resist the actions of cytolytic effector lymphocytes. J Immunol 185: 4793–4803 [DOI] [PubMed] [Google Scholar]
- Iwasawa R, Mahul‐Mellier AL, Datler C, Pazarentzos E, Grimm S (2011) Fis1 and Bap31 bridge the mitochondria‐ER interface to establish a platform for apoptosis induction. EMBO J 30: 556–568 [DOI] [PMC free article] [PubMed] [Google Scholar]
- Jacquemin G, Margiotta D, Kasahara A, Bassoy EY, Walch M, Thiery J, Lieberman J, Martinvalet D (2015) Granzyme B‐induced mitochondrial ROS are required for apoptosis. Cell Death Differ 22: 862–874 [DOI] [PMC free article] [PubMed] [Google Scholar]
- Kornmann B, Currie E, Collins SR, Schuldiner M, Nunnari J, Weissman JS, Walter P (2009) An ER‐mitochondria tethering complex revealed by a synthetic biology screen. Science 325: 477–481 [DOI] [PMC free article] [PubMed] [Google Scholar]
- Kornmann B, Walter P (2010) ERMES‐mediated ER‐mitochondria contacts: molecular hubs for the regulation of mitochondrial biology. J Cell Sci 123: 1389–1393 [DOI] [PMC free article] [PubMed] [Google Scholar]
- Kasahara A, Cipolat S, Chen Y, Dorn GW II, Scorrano L (2013) Mitochondrial fusion directs cardiomyocyte differentiation via calcineurin and Notch signaling. Science 342: 734–737 [DOI] [PubMed] [Google Scholar]
- Kasahara A, Scorrano L (2014) Mitochondria: from cell death executioners to regulators of cell differentiation. Trends Cell Biol 24: 761–770 [DOI] [PubMed] [Google Scholar]
- Korobova F, Ramabhadran V, Higgs HN (2013) An actin‐dependent step in mitochondrial fission mediated by the ER‐associated formin INF2. Science 339: 464–467 [DOI] [PMC free article] [PubMed] [Google Scholar]
- Li Z, Okamoto K, Hayashi Y, Sheng M (2004) The importance of dendritic mitochondria in the morphogenesis and plasticity of spines and synapses. Cell 119: 873–887 [DOI] [PubMed] [Google Scholar]
- Liu G, Yuan X, Zeng Z, Tunici P, Ng H, Abdulkadir IR, Lu L, Irvin D, Black KL, Yu JS (2006) Analysis of gene expression and chemoresistance of CD133+ cancer stem cells in glioblastoma. Mol Cancer 5: 67 [DOI] [PMC free article] [PubMed] [Google Scholar]
- Margadant C, Monsuur HN, Norman JC, Sonnenberg A (2011) Mechanisms of integrin activation and trafficking. Curr Opin Cell Biol 23: 607–614 [DOI] [PubMed] [Google Scholar]
- Martinvalet D, Zhu P, Lieberman J (2005) Granzyme A induces caspase‐independent mitochondrial damage, a required first step for apoptosis. Immunity 22: 355–370 [DOI] [PubMed] [Google Scholar]
- Martinvalet D, Dykxhoorn DM, Ferrini R, Lieberman J (2008) Granzyme A cleaves a mitochondrial complex I protein to initiate caspase‐independent cell death. Cell 133: 681–692 [DOI] [PMC free article] [PubMed] [Google Scholar]
- Martinvalet D, Thiery J (2008) A novel caspase‐independent apoptotic pathway triggered by Granzyme A. Med Sci (Paris) 24: 901–903 [DOI] [PubMed] [Google Scholar]
- Meezan E, Wu HC, Black PH, Robbins PW (1969) Comparative studies on the carbohydrate‐containing membrane components of normal and virus‐transformed mouse fibroblasts. II. Separation of glycoproteins and glycopeptides by sephadex chromatography. Biochemistry 8: 2518–2524 [DOI] [PubMed] [Google Scholar]
- Otvos B, Silver DJ, Mulkearns‐Hubert EE, Alvarado AG, Turaga SM, Sorensen MD, Rayman P, Flavahan WA, Hale JS, Stoltz K, Sinyuk M, Wu Q, Jarrar A, Kim SH, Fox PL, Nakano I, Rich JN, Ransohoff RM, Finke J, Kristensen BW et al (2016) Cancer stem cell‐secreted macrophage migration inhibitory factor stimulates myeloid derived suppressor cell function and facilitates glioblastoma immune evasion. Stem Cells 34: 2026–2039 [DOI] [PMC free article] [PubMed] [Google Scholar]
- Paszek MJ, DuFort CC, Rossier O, Bainer R, Mouw JK, Godula K, Hudak JE, Lakins JN, Wijekoon AC, Cassereau L, Rubashkin MG, Magbanua MJ, Thorn KS, Davidson MW, Rugo HS, Park JW, Hammer DA, Giannone G, Bertozzi CR, Weaver VM (2014) The cancer glycocalyx mechanically primes integrin‐mediated growth and survival. Nature 511: 319–325 [DOI] [PMC free article] [PubMed] [Google Scholar]
- Patel AP, Tirosh I, Trombetta JJ, Shalek AK, Gillespie SM, Wakimoto H, Cahill DP, Nahed BV, Curry WT, Martuza RL, Louis DN, Rozenblatt‐Rosen O, Suva ML, Regev A, Bernstein BE (2014) Single‐cell RNA‐seq highlights intratumoral heterogeneity in primary glioblastoma. Science 344: 1396–1401 [DOI] [PMC free article] [PubMed] [Google Scholar]
- Pellegatta S, Poliani PL, Corno D, Menghi F, Ghielmetti F, Suarez‐Merino B, Caldera V, Nava S, Ravanini M, Facchetti F, Bruzzone MG, Finocchiaro G (2006) Neurospheres enriched in cancer stem‐like cells are highly effective in eliciting a dendritic cell‐mediated immune response against malignant gliomas. Cancer Res 66: 10247–10252 [DOI] [PubMed] [Google Scholar]
- Quintana A, Schwindling C, Wenning AS, Becherer U, Rettig J, Schwarz EC, Hoth M (2007) T cell activation requires mitochondrial translocation to the immunological synapse. Proc Natl Acad Sci USA 104: 14418–14423 [DOI] [PMC free article] [PubMed] [Google Scholar]
- Rizzuto R, Brini M, Murgia M, Pozzan T (1993) Microdomains with high Ca2+ close to IP3‐sensitive channels that are sensed by neighboring mitochondria. Science 262: 744–747 [DOI] [PubMed] [Google Scholar]
- Rizzuto R, Pinton P, Carrington W, Fay FS, Fogarty KE, Lifshitz LM, Tuft RA, Pozzan T (1998) Close contacts with the endoplasmic reticulum as determinants of mitochondrial Ca2+ responses. Science 280: 1763–1766 [DOI] [PubMed] [Google Scholar]
- Rizzuto R, Bernardi P, Pozzan T (2000) Mitochondria as all‐round players of the calcium game. J Physiol 529(Pt 1): 37–47 [DOI] [PMC free article] [PubMed] [Google Scholar]
- Robinson MD, McCarthy DJ, Smyth GK (2010) edgeR: a Bioconductor package for differential expression analysis of digital gene expression data. Bioinformatics 26: 139–140 [DOI] [PMC free article] [PubMed] [Google Scholar]
- Rowland AA, Voeltz GK (2012) Endoplasmic reticulum‐mitochondria contacts: function of the junction. Nat Rev Mol Cell Biol 13: 607–625 [DOI] [PMC free article] [PubMed] [Google Scholar]
- Saraste M (1999) Oxidative phosphorylation at the fin de siecle. Science 283: 1488–1493 [DOI] [PubMed] [Google Scholar]
- Scorrano L, Ashiya M, Buttle K, Weiler S, Oakes SA, Mannella CA, Korsmeyer SJ (2002) A distinct pathway remodels mitochondrial cristae and mobilizes cytochrome c during apoptosis. Dev Cell 2: 55–67 [DOI] [PubMed] [Google Scholar]
- Scorrano L (2005) Proteins that fuse and fragment mitochondria in apoptosis: con‐fissing a deadly con‐fusion? J Bioenerg Biomembr 37: 165–170 [DOI] [PubMed] [Google Scholar]
- Singh SK, Hawkins C, Clarke ID, Squire JA, Bayani J, Hide T, Henkelman RM, Cusimano MD, Dirks PB (2004) Identification of human brain tumour initiating cells. Nature 432: 396–401 [DOI] [PubMed] [Google Scholar]
- Singhal A, Hakomori S (1990) Molecular changes in carbohydrate antigens associated with cancer. Bioessays 12: 223–230 [DOI] [PubMed] [Google Scholar]
- Springer TA, Dustin ML (2012) Integrin inside‐out signaling and the immunological synapse. Curr Opin Cell Biol 24: 107–115 [DOI] [PMC free article] [PubMed] [Google Scholar]
- Suva ML, Rheinbay E, Gillespie SM, Patel AP, Wakimoto H, Rabkin SD, Riggi N, Chi AS, Cahill DP, Nahed BV, Curry WT, Martuza RL, Rivera MN, Rossetti N, Kasif S, Beik S, Kadri S, Tirosh I, Wortman I, Shalek AK et al (2014) Reconstructing and reprogramming the tumor‐propagating potential of glioblastoma stem‐like cells. Cell 157: 580–594 [DOI] [PMC free article] [PubMed] [Google Scholar]
- Szabadkai G, Bianchi K, Varnai P, De Stefani D, Wieckowski MR, Cavagna D, Nagy AI, Balla T, Rizzuto R (2006) Chaperone‐mediated coupling of endoplasmic reticulum and mitochondrial Ca2+ channels. J Cell Biol 175: 901–911 [DOI] [PMC free article] [PubMed] [Google Scholar]
- Tucker‐Burden C, Chappa P, Krishnamoorthy M, Gerwe BA, Scharer CD, Heimburg‐Molinaro J, Harris W, Usta SN, Eilertson CD, Hadjipanayis CG, Stice SL, Brat DJ, Nash RJ (2012) Lectins identify glycan biomarkers on glioblastoma‐derived cancer stem cells. Stem Cells Dev 21: 2374–2386 [DOI] [PMC free article] [PubMed] [Google Scholar]
- Wildburger NC, Zhou S, Zacharias LG, Kroes RA, Moskal JR, Schmidt M, Mirzaei P, Gumin J, Lang FF, Mechref Y, Nilsson CL (2015) Integrated transcriptomic and glycomic profiling of glioma stem cell xenografts. J Proteome Res 14: 3932–3939 [DOI] [PMC free article] [PubMed] [Google Scholar]
- Wu HC, Meezan E, Black PH, Robbins PW (1969) Comparative studies on the carbohydrate‐containing membrane components of normal and virus‐transformed mouse fibroblasts. I. Glucosamine‐labeling patterns in 3T3, spontaneously transformed 3T3, and SV‐40‐transformed 3T3 cells. Biochemistry 8: 2509–2517 [DOI] [PubMed] [Google Scholar]
- Wu A, Wiesner S, Xiao J, Ericson K, Chen W, Hall WA, Low WC, Ohlfest JR (2007) Expression of MHC I and NK ligands on human CD133+ glioma cells: possible targets of immunotherapy. J Neurooncol 83: 121–131 [DOI] [PubMed] [Google Scholar]
- Wu A, Wei J, Kong LY, Wang Y, Priebe W, Qiao W, Sawaya R, Heimberger AB (2010) Glioma cancer stem cells induce immunosuppressive macrophages/microglia. Neuro Oncol 12: 1113–1125 [DOI] [PMC free article] [PubMed] [Google Scholar]
- Xie Q, Wu Q, Horbinski CM, Flavahan WA, Yang K, Zhou W, Dombrowski SM, Huang Z, Fang X, Shi Y, Ferguson AN, Kashatus DF, Bao S, Rich JN (2015) Mitochondrial control by DRP1 in brain tumor initiating cells. Nat Neurosci 18: 501–510 [DOI] [PMC free article] [PubMed] [Google Scholar]
- Yamamoto H, Swoger J, Greene S, Saito T, Hurh J, Sweeley C, Leestma J, Mkrdichian E, Cerullo L, Nishikawa A, Ihara Y, Taniguchi N, Moskal JR (2000) Beta 1,6‐N‐acetylglucosamine‐bearing N‐glycans in human gliomas: implications for a role in regulating invasivity. Cancer Res 60: 134–142 [PubMed] [Google Scholar]
- Yang J, Sanderson NS, Wawrowsky K, Puntel M, Castro MG, Lowenstein PR (2010) Kupfer‐type immunological synapse characteristics do not predict anti‐brain tumor cytolytic T‐cell function in vivo . Proc Natl Acad Sci USA 107: 4716–4721 [DOI] [PMC free article] [PubMed] [Google Scholar]
- Yi M, Weaver D, Hajnoczky G (2004) Control of mitochondrial motility and distribution by the calcium signal: a homeostatic circuit. J Cell Biol 167: 661–672 [DOI] [PMC free article] [PubMed] [Google Scholar]
- Zeppernick F, Ahmadi R, Campos B, Dictus C, Helmke BM, Becker N, Lichter P, Unterberg A, Radlwimmer B, Herold‐Mende CC (2008) Stem cell marker CD133 affects clinical outcome in glioma patients. Clin Cancer Res 14: 123–129 [DOI] [PubMed] [Google Scholar]
- Zhou W, Ke SQ, Huang Z, Flavahan W, Fang X, Paul J, Wu L, Sloan AE, McLendon RE, Li X, Rich JN, Bao S (2015) Periostin secreted by glioblastoma stem cells recruits M2 tumour‐associated macrophages and promotes malignant growth. Nat Cell Biol 17: 170–182 [DOI] [PMC free article] [PubMed] [Google Scholar]
Associated Data
This section collects any data citations, data availability statements, or supplementary materials included in this article.
Supplementary Materials
Appendix
Review Process File
Source Data for Figure 1