

Abstract
FtsZ, the bacterial homologue of eukaryotic tubulin, plays a central role in cell division in nearly all bacteria and many archaea. It forms filaments under the cytoplasmic membrane at the division site where, together with other proteins it recruits, it drives peptidoglycan synthesis and constricts the cell. Despite extensive study, the arrangement of FtsZ filaments and their role in division continue to be debated. Here, we apply electron cryotomography to image the native structure of intact dividing cells and show that constriction in a variety of Gram‐negative bacterial cells, including Proteus mirabilis and Caulobacter crescentus, initiates asymmetrically, accompanied by asymmetric peptidoglycan incorporation and short FtsZ‐like filament formation. These results show that a complete ring of FtsZ is not required for constriction and lead us to propose a model for FtsZ‐driven division in which short dynamic FtsZ filaments can drive initial peptidoglycan synthesis and envelope constriction at the onset of cytokinesis, later increasing in length and number to encircle the division plane and complete constriction.
Keywords: asymmetric division, bacterial cell division, Caulobacter crescentus, electron cryotomography, FtsZ
Subject Categories: Cell Adhesion, Polarity & Cytoskeleton; Microbiology, Virology & Host Pathogen Interaction
Introduction
Cytokinesis in nearly all prokaryotic cells is mediated by a filamentous structure at the division site of the cell. This structure, as first revealed by immunoelectron microscopy of Escherichia coli, contains the eukaryotic tubulin homologue FtsZ (Bi & Lutkenhaus, 1991). FtsZ filaments serve as a scaffold to concentrate PG synthases (Egan & Vollmer, 2013) and recruit additional cell division proteins which together constrict the envelope, eventually dividing the cell (Adams & Errington, 2009; Erickson et al, 2010; Haeusser & Margolin, 2016). FtsZ is almost universally conserved throughout Bacteria (Margolin, 2005) and Euryarchaeota (Makarova et al, 2010).
Fluorescence microscopy studies have shown that FtsZ localizes to a ring‐like volume at the division site (Ma et al, 1996; Sun & Margolin, 1998; Thanedar & Margolin, 2004) and is highly dynamic, with subunits exchanging in and out of the volume with a half‐life of 9‐s in E. coli (Anderson et al, 2004; Biteen et al, 2012). In vitro reconstitution experiments using liposomes have further shown that FtsZ alone can constrict membranes (Osawa et al, 2008, 2009), but many molecular details of the structures present in vivo remain unclear.
Electron cryotomography (ECT) can resolve individual FtsZ filaments in the cell directly (not relying on fluorescent tags). In 2007, our laboratory reported the first ECT of FtsZ filaments in intact Caulobacter crescentus cells. Reflecting the difficulty of early ECT, only seven wild‐type cells were imaged in that study, and only five of these were in the process of constricting (one was pre‐constriction and one post‐constriction). The results revealed that FtsZ filaments are sometimes short and do not always form a closed ring (Li et al, 2007), supporting a model in which individual short filaments can generate constrictive force on the membrane by themselves (Lu et al, 2000). This model gained further support from several super‐resolution fluorescence microscopy studies reporting that FtsZ filaments in dividing cells are dynamic and do not form continuous closed rings (Strauss et al, 2012; Buss et al, 2013, 2015).
ECT technology has advanced considerably since 2007, and a recent ECT study re‐examined FtsZ arrangement in C. crescentus (Szwedziak et al, 2014). Utilizing a newly developed direct electron detector and choosing cells aligned with the tilt axis to minimize the effect of the “missing wedge” (Oikonomou & Jensen, 2016), Szwedziak et al imaged 20 dividing C. crescentus cells. Finding that FtsZ filaments bundle together to form a complete ring, the authors concluded that complete rings are required for constriction to begin, and proposed three possible mechanisms including one in which maximizing filament overlap via sliding drives constriction (Horger et al, 2008a,b; Lan et al, 2009). While more cells were imaged in this second ECT study than the first, the results shown were all from cells in the mid‐constriction stage of division, leaving the arrangement of FtsZ filaments in other constriction stages unclear.
To develop a more complete picture of FtsZ‐driven cell constriction, here we imaged a large number of dividing cells of several bacterial species by ECT. We found that in Proteus mirabilis, C. crescentus, Halothiobacillus neapolitanus c2, Legionella pneumophila, a Belliella baltica‐related strain, Thiomonas intermedia, Ralstonia eutropha, and FtsZ‐overexpressing Salmonella enterica spp. enterica minicells, initial constriction is asymmetric (starts on one side of the cell) and is accompanied by short FtsZ‐like filaments on the constricting side. Fluorescence microscopy further revealed that a burst of peptidoglycan (PG) synthesis also frequently occurs on one side of P. mirabilis and C. crescentus cells. In C. crescentus, where the cells' natural curvature allows the sides to be distinguished, we observed that constriction, PG synthesis, and short FtsZ‐like filaments all appear first on the outer curvature. Taken together, our observations support a general model in which cell envelope constriction and septal PG synthesis in the early stages of bacterial cytokinesis are driven by individual FtsZ filaments, and a complete ring is not required.
Results
Multiple bacterial species initiate constriction asymmetrically
Intrigued by the apparent contradiction in previous ECT studies of FtsZ in Caulobacter crescentus (Li et al, 2007; Szwedziak et al, 2014), we imaged a large number (49) of wild‐type frozen‐hydrated C. crescentus cells by ECT, targeting long (and therefore potentially dividing) cells. While C. crescentus is a well‐studied model system for division and the thinness of its cells allows features such as filaments to be readily resolved by ECT, we found that its natural curvature complicated analysis of constriction (see below), so we also imaged 38 wild‐type frozen‐hydrated Proteus mirabilis cells, which have a relatively straight cell body. In addition, we searched the Caltech Tomography Database, a resource containing more than 15,000 tomographic 3D images of 88 different bacterial species (Ding et al, 2015), for cryotomograms of other dividing cells. In total, we identified 159 dividing cells, and noted that 47, from eight different species, exhibited indentations of the cell envelope on only one side of the cell, as if constriction had begun asymmetrically (Fig 1A and B). In each case, the indentation appeared near the middle of a long cell. Other cells of these same species were observed with deeper, bilateral constrictions (Fig EV1, note that examples from P. mirabilis and C. crescentus are shown in Figs 2 and 3).
Figure 1. Examples of eight different bacterial species that exhibit asymmetric early‐constriction.
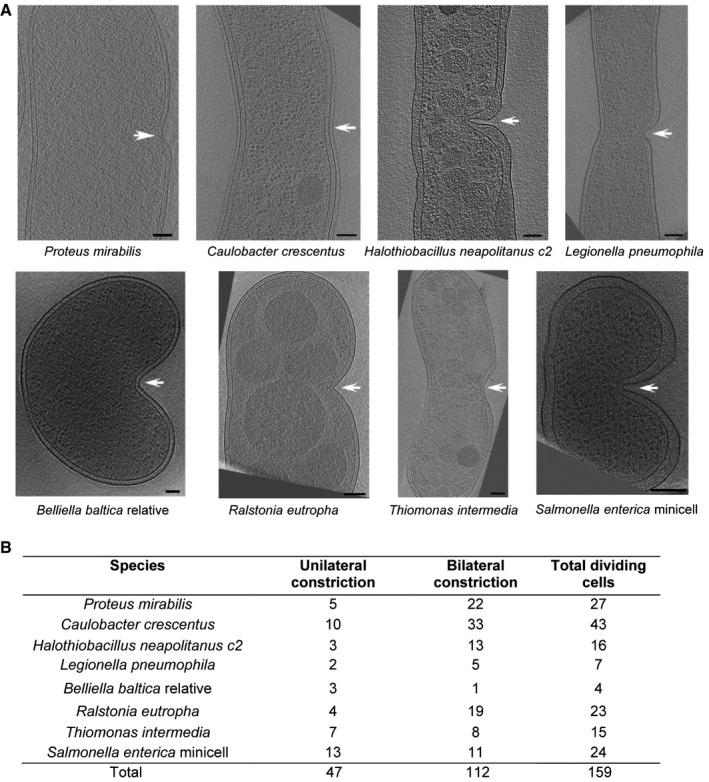
- Representative central slices of tomograms of eight different constricted cells are shown, arranged so that the asymmetric division site is on the right (indicated by white arrows). Scale bars, 100 nm.
- Table showing the numbers of cells observed constricting asymmetrically and symmetrically for each species.
Figure EV1. Additional examples of cell shapes throughout the constriction process.
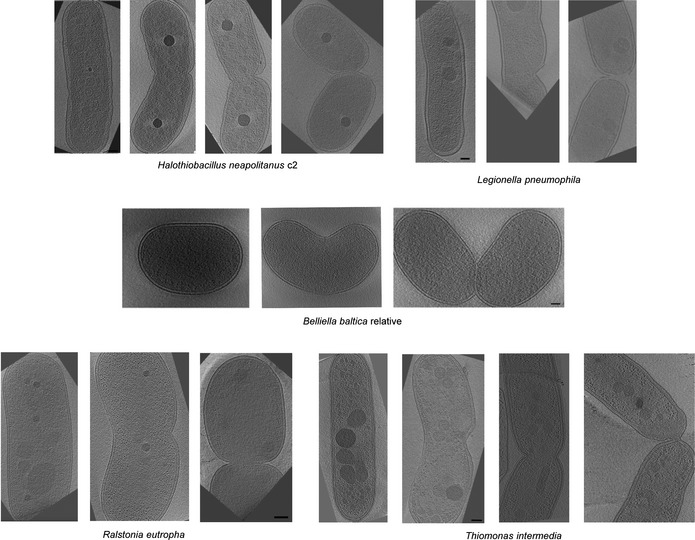
Central slices of representative 3D tomographic reconstructions of Halothiobacillus. neapolitanus c2, Legionella pneumophila, a Belliella baltica‐related strain, Ralstonia eutropha, and Thiomonas intermedia cells are shown. For each species, cells are arranged in order of presumed cell division progress (from left to right). Scale bars, 100 nm.
Figure 2. Atlas of dividing P. mirabilis cells imaged in this study.
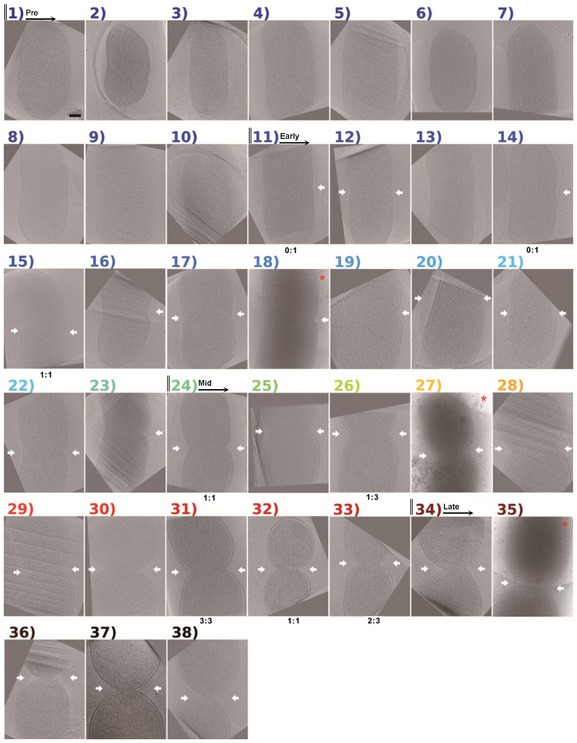
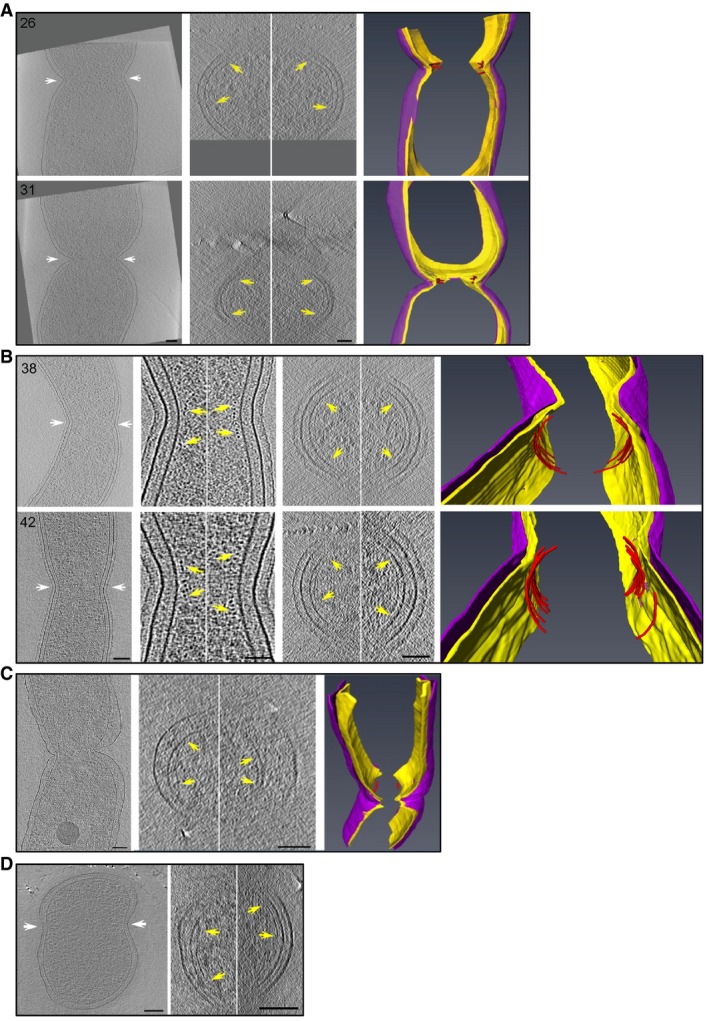
Central slices of tomograms or projection images (marked by red asterisks) of P. mirabilis are sorted according to W mid/W. Numbers and labels, as well as color scheme, correspond to Fig EV2A. White arrows denote indentations detected by the program on the indicated side. The three cells numbered 11, 26, and 31 correspond to cell 11 in Fig 5A and cells 26 and 31 in Fig 6A, respectively. The number of FtsZ‐like filaments observed on each side of the division plane (left: right) is noted below the corresponding image. If no number is given, no filaments were observed, meaning either that there were none or that we could not resolve them. Scale bar, 300 nm.
Figure 3. Atlas of all Caulobacter crescentus cells imaged in this study.
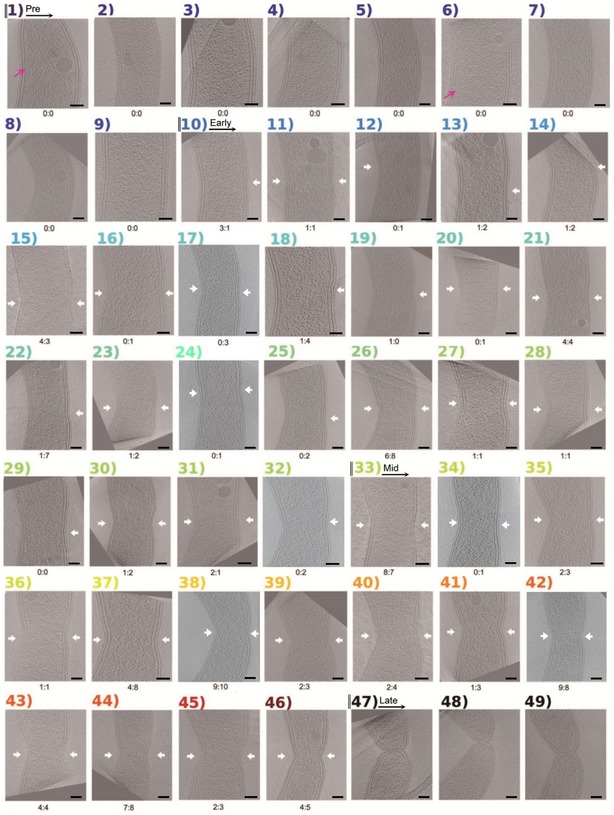
Central slices of tomograms of C. crescentus are sorted according to W mid/W. Cells are arranged with the inner curvature on the left and the outer curvature on the right. Numbers and labels, as well as color scheme, correspond to Fig EV2B. White arrows denote indentations detected by the program. Measurements from the last three cells (47–49) are omitted. Pink arrows indicate filaments formed by CTP synthase (Ingerson‐Mahar et al, 2010). The six cells numbered 17, 24, 32, 34, 38, and 42 correspond to cell 32 in Fig 5B, cells 38 and 42 in Fig 6B, and cells 17, 24 and 34 in Fig EV4, respectively. The number of FtsZ‐like filaments observed on each side of the division plane (left: right) is noted below the corresponding image. Scale bars, 100 nm.
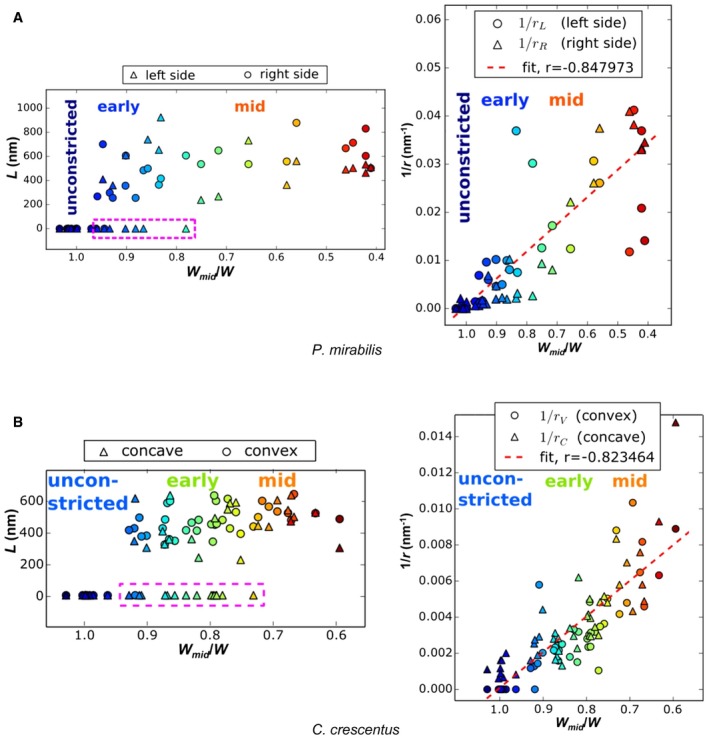
To more quantitatively examine this phenomenon, we analyzed the P. mirabilis and C. crescentus cells in detail. For both species, we arranged the cell images in order of cytokinesis progression based on the width ratio of the division plane to the cell body (W mid /W, see Appendix Fig S1A for details). To identify constrictions of the cell envelope in an unbiased way, even in the inherently curved bacterial species C. crescentus, we wrote a Python program (available at http://jensenlab.caltech.edu/software) that characterizes constriction based on the length (L) of the indentation site and its radius of curvature (r) (see Appendix Fig S1B for details).
For P. mirabilis, the results of this classification are shown in Figs 2 and EV2A, with measurements listed in Appendix Table S1. On the basis of this classification, we divided the cells into four categories: pre‐, early‐, mid‐, and late‐constriction. “Pre‐constriction” cells had no constrictions. The “early‐constriction” class began with the first cell in the series with a constriction and ended with the last cell with only a single (one‐sided) constriction. The “mid‐constriction” class then extended until cells exhibited a deep furrow (later defined more specifically as the cells beyond which FtsZ‐like filaments were no longer seen, see below). In the P. mirabilis data set, there were 10 pre‐constriction cells. Among the 13 early‐constriction stage cells (nos. 11–23), six exhibited an indentation on just one side. All 10 mid‐constriction cells (nos. 24–33) exhibited constrictions on both sides of the cell body, and the five late‐constriction cells (nos. 34–38) possessed deep furrows converging into a neck‐like structure. Note that the unbiased quantitative ordering by width ratio likely failed to perfectly reflect internal states: gentle thinning in the center of cell #13 caused it to be classified with the early‐constriction cells despite its lack of a detectable constriction, and the extra‐deep one‐sided furrow of cell #23 caused cell nos. 20–22 to be classed as early‐constriction despite their bilateral constrictions. The objective ordering nevertheless made it clear that in many P. mirabilis cells constriction initiates asymmetrically.
Figure EV2. Indentation length (L) and curvature sharpness (1/r) of P. mirabilis and C. crescentus cells increase as W mid/W decreases throughout division.
-
A, BIndentation length (L) and curvature sharpness (1/r) of P. mirabilis (A) and C. crescentus (B) cells increase as W mid/W decreases throughout division. The circles represent the measured values from the left sides; the triangles denote the measured values from the right sides. Note that these assignments are arbitrary for straight P. mirabilis cells. Colors in (A and B) indicate the corresponding numbers in Figs 2 and 3, respectively. The purple dashed boxes at left highlight cells with detectable indentation only on one side. The red dashed lines at right are the best‐fit line, showing a high degree of correlation. “Unconstricted”, “early”, and “mid” denote the pre‐constriction stage, early‐constriction stage, and mid‐constriction stages in cell division. These stages are roughly determined by W mid/W.
The results for C. crescentus are shown in Figs 3 and EV2B, with measurements listed in Appendix Table S2. We observed nine cells (nos. 1–9) in the pre‐constriction stage, 23 cells (nos. 10–32) in the early‐constriction stage, 14 cells (nos. 33–46) in the mid‐constriction stage, and three cells (nos. 47–49) in the late stage. Ten of the early‐constriction cells were constricted on just one side (nos. 10, 12, 13, 14, 18, 19, 22, 25, 29, and 32), and in all but one, the constriction appeared on the outer curvature. The exception (#12) appears to be a false positive, as our software marked a constriction on the inner curvature, but the indentation is questionable and we would not in fact have marked it visually. Thus, constriction initiates asymmetrically on the outer curvature in C. crescentus. Together with the P. mirabilis data and the observations in the other six species shown in Fig 1, these results reveal that in multiple Gram‐negative bacterial species, constriction can initiate on one side of the cell. Later in the process, constriction spreads to both sides (Figs 2, 3 and EV1), so that in some species like C. crescentus, late‐constriction appears very nearly symmetric. In others, like the Belliella baltica‐related strain, the asymmetry remains throughout division.
Peptidoglycan synthesis is also asymmetric at the onset of division
During division of rod‐shaped cells that contain MreB and FtsZ, the dominant mode of peptidoglycan (PG) synthesis switches from MreB‐dependent to FtsZ‐dependent (Typas et al, 2011). It has been suggested that FtsZ filaments serve as scaffolds to organize PG synthetic enzymes and that FtsZ‐mediated constriction is stabilized by the construction of new PG (Egan & Vollmer, 2013). We therefore wondered whether PG synthesis in early‐constriction is also asymmetric. To test this hypothesis, we tracked new PG synthesis in both P. mirabilis and C. crescentus by incorporation of a fluorescently labeled D‐amino acid, 7‐hydroxycoumarin‐3‐carboxylic acid‐amino‐D‐alanine (HADA; Kuru et al, 2012).
We first tried a previously published protocol of 5‐min HADA labeling, followed by washing and fixation (Kuru et al, 2012; Sundararajan et al, 2015). In an asynchronous culture of C. crescentus labeled this way, we observed a strong band of fluorescence at the midcell in more than 60% of cells (n > 200). Whether this is MreB‐ or FtsZ‐based is unclear, but the fact that bright labeling was only ever seen at midcell suggests that the midcell is the only location where new PG synthesis is highly concentrated. To increase the temporal resolution of staining, and perhaps capture more transient stages, we modified the protocol by labeling cells with HADA for only 1.5 min, immediately fixing and then washing. This resulted in half as many labeled cells (30%), again all at midcell, allowing us to sample cell cycle dynamics more finely.
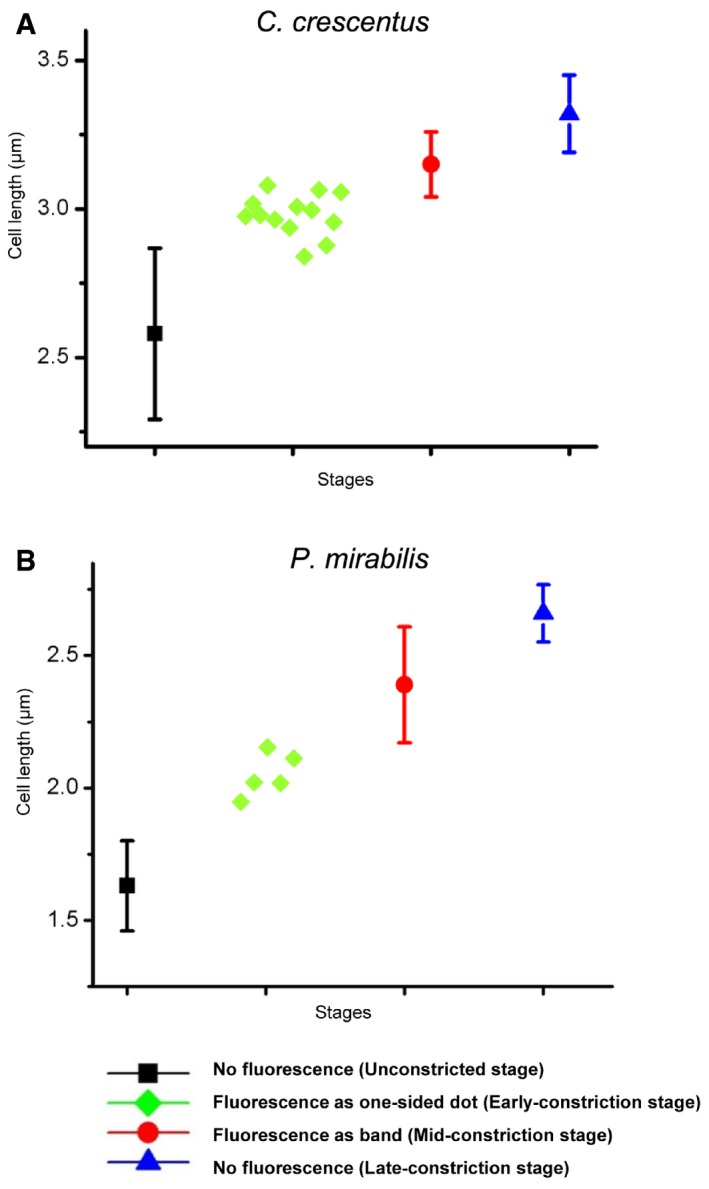
Using this improved protocol, we labeled ~200 C. crescentus cells and arranged them in relative order approximating progression through the cell cycle based on morphological features such as cell length and division plane diameter (Fig 4A). Fifty‐five percent of the cells were unlabeled and between short and intermediate length, suggesting diffuse PG synthesis during elongation. ~5% of the cells exhibited a single bright fluorescent spot on one side of the cell, and ~25% of the cells exhibited a band of fluorescence all the way across midcell. The final, longest 15% of the cells were again unlabeled and were clearly in the final stages of division. Comparing the lengths of each of these classes of cells (Fig EV3A), it was observed that the 5% of cells with the single bright spot on one side of midcell were intermediate in length between the short unlabeled cells and the cells with a complete fluorescent band across midcell. Among the cells with a single bright spot, 12 out of 13 of these spots appeared on the outer curvature of the cell.
Figure 4. Localization of new PG incorporation.
-
A, BLocalization of new PG incorporation in different stages of C. crescentus (A) and P. mirabilis (B) cytokinesis. In each panel, the upper row shows the fluorescence (HADA) images of representative cells in different cell division stages overlaid with phase contrast images showing the cell profiles. The bottom rows show fluorescence profiles of the division plane of the indicated early‐constriction and mid‐constriction stage cells. The numbers in (A) and (B) are 1/10 values of the 8‐bit gray values measured using the NIH ImageJ software. Scale bars, 1 μm.
Figure EV3. Cell length versus HADA labeling phenotype.
-
A, BFor C. crescentus (A) and P. mirabilis (B) cells labeled with HADA, the cell length statistics for different stages are shown. For the unconstricted, mid‐constriction, and late‐constriction stages, the cell length was measured in 15 randomly selected cells, and the mean and standard deviation (bars) are plotted using the indicated symbols. The cell lengths of all observed early‐constriction stage cells with one‐sided HADA incorporation are plotted with green diamonds.
We next used a similar protocol to visualize division‐related PG incorporation in P. mirabilis and found that a longer (7.5 min) labeling time gave the most interesting results. In 500 cells in three independent experiments, ~80% of the cells were unlabeled and short. One percent of the cells exhibited a single bright spot on one side of midcell, ~17% showed a uniform band at midcell, and the final ~3% of cells were again unlabeled, but clearly of a different class than the first because they were nearly twice as long and in the final stages of division (Figs 4B and EV3B). Again the small population of cells exhibiting HADA labeling on just one side of the division plane were intermediate in length between the short unlabeled cells and the cells with a complete fluorescent band across midcell (Fig EV3B). For both species, we think it unlikely that the asymmetric HADA labeling we observed is an artifact because (i) in both species it was only observed in cells of length consistent with an early‐constriction stage, and (ii) in C. crescentus, nearly all cases were observed on the outer curvature. Together, these results suggest that the asymmetric early‐constriction of bacterial cells reported above is accompanied by asymmetric PG synthesis.
Short FtsZ‐like filaments accompany early asymmetric constriction
In many cases, we observed ~4‐nm‐wide filaments ~15–16 nm away from the inner membrane (distance measured from center‐to‐center) perpendicular to the long axis of the cell at midcell. Previous studies perturbing the abundance, turnover, or membrane tethering of the protein have already established that these are the characteristics of FtsZ filaments, at least in C. crescentus (Li et al, 2007; Szwedziak et al, 2014). Because it remains possible that any particular filament seen in a cell by ECT is not FtsZ, in the following we refer to the filaments as “FtsZ‐like”, but we draw conclusions about FtsZ filaments in general based on the assumption that when FtsZ filaments were present in the cells, they were among those identified as “FtsZ‐like.”
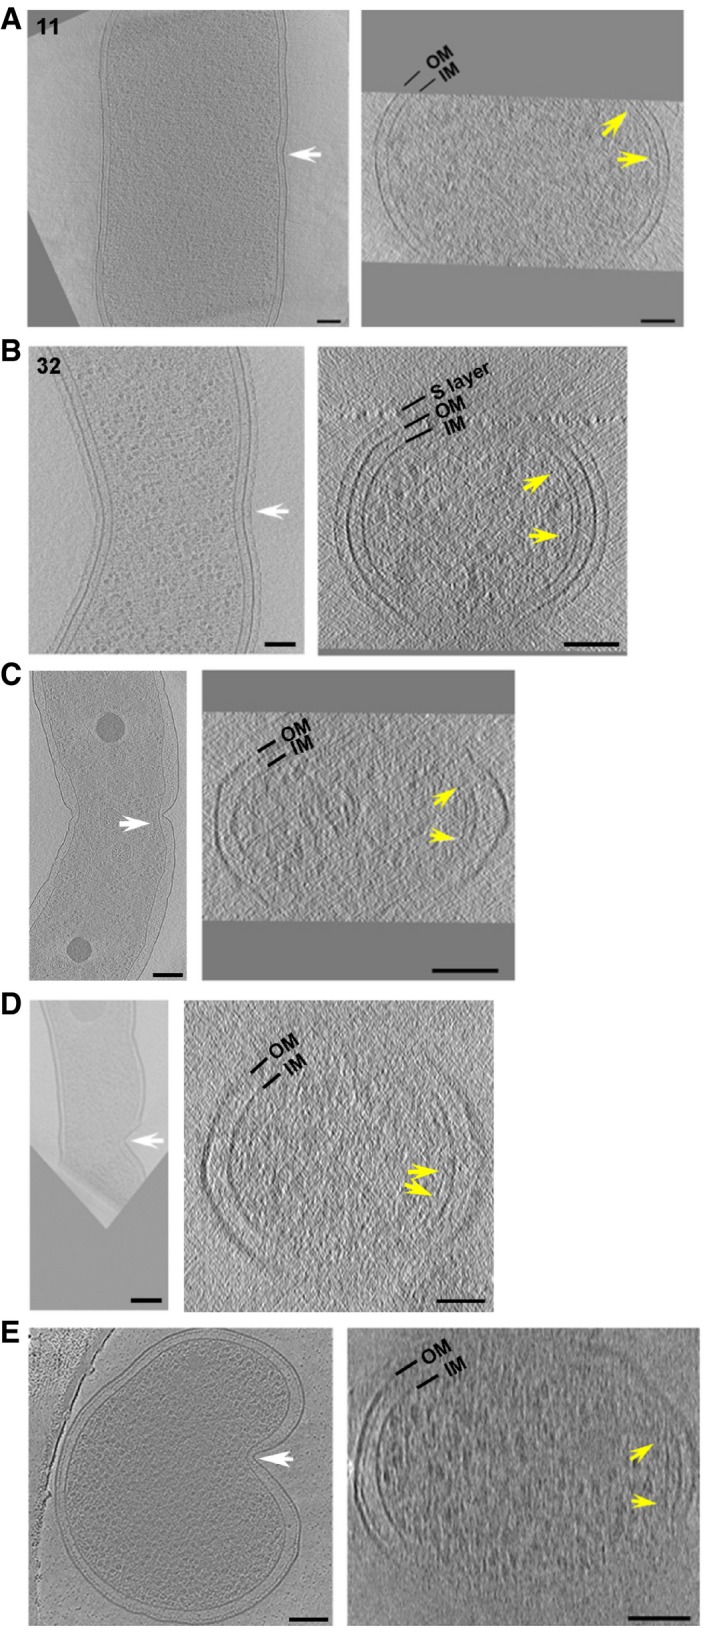
No FtsZ‐like filaments were observed in the ten unconstricted P. mirabilis cells (Fig 2). FtsZ‐like filaments were observed in three early‐constriction stage cells. In two (nos. 11 and 14), a single short FtsZ‐like filament was present on the same side as the unilateral indentation, and no filaments were seen on the opposite side (one example shown in Fig 5A). In the third cell (#15), indentations and a single FtsZ‐like filament were seen on both sides. Within the 10 mid‐constriction stage cells, FtsZ‐like filaments were observed in five. In all five cases, the cells were constricted on both sides and FtsZ‐like filaments were also seen on both sides, including both short and long filaments (two examples shown in Fig 6A). No FtsZ‐like filaments were observed in the five late‐constriction stage cells. While the relative straightness of P. mirabilis cells was an advantage in the constriction analysis described above, P. mirabilis cells were unfortunately quite thick for ECT, and so there may have been more filaments present than we detected.
Figure 5. Short FtsZ‐like filaments accompany early asymmetric cell constriction.
-
A–EShort FtsZ‐like filaments accompany early asymmetric cell constriction in P. mirabilis (A), C. crescentus (B), H. neapolitanus c2 (C), L. pneumophila (D), and S. enterica spp. enterica minicells (E). The two cells in (A) and (B) correspond to cells nos. 11 and 32 in Figs 2 and 3, respectively. A central x‐y slice is shown at left. White arrows highlight the asymmetric constriction and indicate the plane of the cross‐sectional x‐z slice shown at right. The limits of visibility or apparent ends of continuous FtsZ‐like filaments are marked by yellow arrows. OM, outer membrane; IM, inner membrane. Scale bars, 100 nm.
Figure 6. FtsZ‐like filament localization in mid‐constriction stages.
-
A–DFtsZ‐like filament localization in mid‐constriction stages of P. mirabilis (A), C. crescentus (B), H. neapolitanus c2 (C), and S. enterica spp. enterica minicells (D) division. Representative central x‐y slices of 3D tomographic reconstructions of mid‐constriction stage cells are shown on the left. Cell orientation is the same as in Fig 3. White arrows highlight the constriction sites and indicate the cross‐sectional x‐z slice plane. In (B), enlarged views of x‐y slices of both the inner (left) and outer (right) curvature of the division site are shown, with yellow arrows indicating FtsZ‐like filament cross sections. In all panels, the middle column shows an x‐z slice of the division site. Yellow arrows indicate FtsZ‐like filaments. Segmentations are shown at right, highlighting the inner (yellow) and outer (purple) membranes, and all FtsZ‐like filaments observed (red). The two cells in (A) correspond to cells nos. 26 and 31 in Fig 2; the two cells in (B) correspond to nos. 38 and 42 in Fig 3. Scale bars, 50 nm in second column in (B); all other scale bars, 100 nm; scale is the same in upper and lower panels in (A) and (B); segmentations not to scale.
Caulobacter crescentus cells are thinner, making it easier to resolve filaments. Again no FtsZ‐like filaments were observed in the nine unconstricted C. crescentus cells (Fig 3). In the 23 early‐constriction stage cells, FtsZ‐like filaments were observed in 22. The numbers of filaments per cell ranged from 0 (cell #29) to 14 (cell #26), with an average of 3.4 filaments/cell (noting, however, that because of the “missing wedge” of information in ECT, it is impossible to follow individual filaments all the way around a cell's circumference (Iancu et al, 2005), so some of the filaments might have been multiply‐counted if they continued all the way from the outer to the inner curvature). Nearly twice as many filaments were seen on the outer than inner curvature (50 to 29). In seven early‐constriction stage cells (nos. 12, 16, 17, 20, 24, 25, and 32) and one mid‐constriction stage cell (no. 34), FtsZ‐like filaments were found only on the outer curvature of the cell (one example shown in Fig 5B and three more in Fig EV4); in only one cell (no. 19), a filament was found only on the inner curvature. Together these results show that during early‐constriction, FtsZ filaments are more commonly found on the outer curvature of C. crescentus.
Figure EV4. Additional examples of FtsZ filaments on the outer curvature of C. crescentus cells in the early‐constriction stage of division.
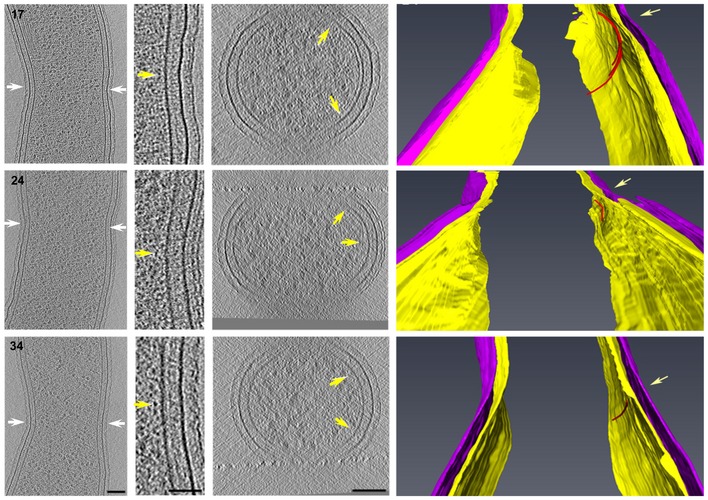
The three cells correspond to numbers 17, 24, and 34 in Fig 3. The panel arrangement and color scheme are the same as in Fig 6. The yellow arrows in segmentations indicate FtsZ‐like filaments. Scale bars: 50 nm in Column 2; 100 nm in columns 1 and 3; segmentations in column 4 not to scale.
FtsZ‐like filaments were observed in all 14 mid‐constriction stage C. crescentus cells, ranging in number from only 1 (cell #34) to 19 (cell #38), with an average of 8.8 filaments/cell (again noting that some may have been multiply‐counted; two example cells shown in Fig 6B). The ratio of filaments on the outer to inner curvature was still slightly biased toward the outer curvature (68 to 55), but much closer to parity than in the early‐constriction stage. Many filaments were noticeably longer than those in the early‐constriction stage cells, spanning the entire visible arc on one side of the cell, but shorter filaments (ending within the visible region) were also seen. Together the filaments formed a flat ribbon parallel to the membrane. No FtsZ‐like filaments were observed in the three late‐constriction stage cells (Fig 3), leading us at this point to define the boundary between “mid” and “late” stages as after the last cell with visible FtsZ‐like filaments.
Following this analysis of the large P. mirabilis and C. crescentus data sets, we also looked for FtsZ‐like filaments in the other 89 tomograms of dividing cells of other species. In all three H. neapolitanus c2 cells with unilateral constriction, a short FtsZ‐like filament was detected on the constricting side and none was seen on the non‐constricting side. The same was true for both asymmetrically constricting L. pneumophila cells. Finally, in S. enterica subsp. enterica minicells produced by an FtsZ‐overexpressing strain, short FtsZ‐like filaments were seen on the constricting side and not the other side of eight out of 13 unilaterally constricting cells (one example each of asymmetrically dividing H. neapolitanus c2, L. pneumophila, S. enterica subsp. enterica minicells with FtsZ‐like filaments shown in Fig 5C–E). Unfortunately, the tomograms of the other three species (Belliella baltica‐related strain, T. intermedia, and R. eutropha) were not high enough quality to detect filaments, in part because of cell thickness. Later in cell division in the three other species where FtsZ‐like filaments were seen (H. neapolitanus c2, L. pneumophila, S. enterica subsp. enterica minicells), FtsZ‐like filaments were seen on both sides of bilaterally constricting cells (two examples shown in Fig 6C and D), as in P. mirabilis and C. crescentus.
In summary, we have a total of 44 tomograms of cells or minicells constricting on just one side, and FtsZ‐like filaments are visible in 25. Among these, in 19, the filaments appear only on the constricting side, in 5, the filaments are on both sides, and in just 1 (C. crescentus #12, the likely false positive), the filament is on the side opposite the constriction (the filament is on the outer curvature, and the putative constriction is on the inner). As mentioned above, while the effect of the “missing wedge” of information in ECT makes it impossible to follow features all the way around a cell's circumference (Iancu et al, 2005), in those cases where no filament portions were observed on one side of the cell, the data are sufficient to establish that the filaments did not form complete rings. These results reveal that the presence of short FtsZ filaments correlates in both time and location with asymmetric constriction, and complete rings are not necessary for constriction.
Discussion
Asymmetric early‐constriction is a widespread property of bacterial cytokinesis
In multiple unmodified Gram‐negative bacterial species, as well as non‐replicating minicells containing FtsZ (Farley et al, 2016), we observed initial cell division constrictions on just one side of the division plane. We conclude that cell division initiates asymmetrically. Previous imaging studies missed asymmetric constriction likely because of limited resolution, specimen preparation, or number of samples: Light microscopy is limited to a few hundred nanometer resolution, and in many cases, the constrictions were only tens of nanometers deep. While higher resolution, traditional EM preparation methods rely on fixation and dehydration, which often fail to preserve membrane structure (Pilhofer et al, 2010). Previous ECT studies might have discovered this phenomenon, but they either imaged too few cells (Li et al, 2007) and/or focused on later stages of division ((Li et al, 2007; Szwedziak et al, 2014). Here, by imaging a large number of native cells by ECT throughout the process of division, the asymmetry of early cell division was recognized.
Accompanying asymmetric early‐constriction in both time and place, we observed asymmetric PG synthesis and short FtsZ‐like filaments. In C. crescentus, where the cell's inherent curvature distinguishes the two sides, constriction, PG synthesis, and the presence of FtsZ‐like filaments were all strongly biased toward the outer curvature (ratios of 9:1, 12:1, and 7:1, respectively, outer to inner curvatures, in cells where the feature was present on only one side). While it remains unclear whether the PG synthesis was MreB‐, FtsZ‐, or even crescentin‐related (Cabeen et al, 2009), we believe it was part of the cell division process because the HADA labeling only appeared at midcell in cells whose lengths matched early‐constriction.
These observations agree with previous studies that have observed asymmetric constriction and/or FtsZ localization in other systems (Appendix Fig S2). In the spherical cyanelle plastids of Cyanophora paradoxa, fluorescence microscopy showed FtsZ arcs underlying asymmetric indentation furrows (Sato et al, 2009; Appendix Fig S2A). In the spiral‐shaped magnetotactic bacterium Magnetospirillum gryphiswaldense, asymmetric septation accompanied by FtsZ arcs was suggested to split the magnetosome chain (Katzmann et al, 2011; Appendix Fig S2B). Asymmetric FtsZ localization and/or constriction have been observed in several E. coli mutants including a temperature‐sensitive mutant of ftsZ that induces spiral septa (Addinall & Lutkenhaus, 1996; Appendix Fig S2C), a spherical mreB mutant strain (Bendezu & de Boer, 2008; Appendix Fig S2D), and a strain overexpressing a MinCc‐MinD fusion (Rowlett & Margolin, 2014; Appendix Fig S2E). In the pleomorphic archaeon Haloferax mediterranei, immunofluorescence of FtsZ revealed arcs that did not completely encircle the cells (Poplawski et al, 2000; Appendix Fig S2F). Recently, it was shown that a rod‐shaped gammaproteobacterial symbiont living on nematodes constricts asymmetrically during division, initiating FtsZ assembly at the host‐associated pole (Leisch et al, 2016; Appendix Fig S2G).
A model for constriction driven by dynamic FtsZ filaments
Taken together, all these results support a model for FtsZ‐driven cytokinesis in which FtsZ polymerizes into short filaments, initially at one site on the division plane, and these short FtsZ arcs drive initial PG synthesis and constriction at that site (Fig 7A and B). Complete FtsZ rings are not necessary for constriction to start. Our data also show that at least in P. mirabilis and C. crescentus, as cytokinesis proceeds, the number of filaments and their length both increase, until they often (but not always—see C. crescentus cell #34) overlap to form a continuous ring. Near the end of constriction, the number of FtsZ filaments decreases (e.g. cells 34, 36, and 41 in Fig 3), and we define here a “late‐constriction” stage characterized by both the presence of deep furrows and the absence of FtsZ filaments, consistent with the previous observation in E. coli that FtsZ leaves the ring in late‐constriction before other division proteins (Soderstrom et al, 2014).
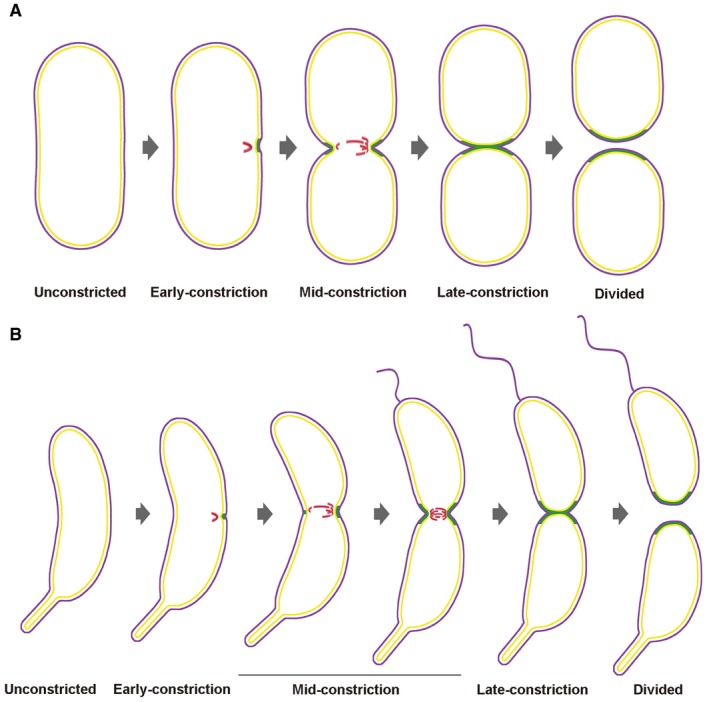
Figure 7. Model of FtsZ‐driven PG synthesis and constriction in P. mirabilis and C. crescentus cytokinesis.
-
A, BThe diagrams show progression through cell division of P. mirabilis (A) and C. crescentus (B). The cell envelope profiles were drawn according to the experimental images. FtsZ filaments are shown in red, new PG incorporation in green, and outer and inner membranes in purple and yellow, respectively. In the early‐constriction stage, short arc‐like FtsZ filaments assemble on one side of the cell, recruiting PG synthesis and driving initial, asymmetric constriction of the cell envelope. Later, FtsZ filaments accumulate, forming a bundle of overlapping filaments that covers the entire division plane in the mid‐constriction stage. Finally, these highly dynamic filaments drive PG synthesis and constriction symmetrically around the division plane until cytokinesis is complete.
This model reconciles the apparently conflicting results from the two previous ECT studies on C. crescentus (Li et al, 2007; Szwedziak et al, 2014), providing a more complete picture of the highly dynamic FtsZ filaments that at various times throughout division take the form either of short isolated filaments or extended bundles. Our ECT “snapshots” agree with the model that FtsZ filaments are dynamic: While a clear pattern emerged (schematized in Fig 7), there were exceptions. In some cells, the location of filaments and membrane indentations did not match (e.g., cells 12, 19, and 29 in Fig 3), and there was not a smooth increase in numbers of filaments with deeper constriction (C. crescentus cells #33, 34, and 38 had 15, 1, and 19 filaments, respectively). This is consistent with constriction occurring on a timescale longer than the lifetime of individual filaments. In fact, fluorescence microscopy studies have shown that the half‐life of FtsZ subunits in division assemblies is on the order of a few seconds in E. coli and B. subtilis (Anderson et al, 2004), and recent studies showed that FtsZ treadmills rapidly (Ramirez et al, 2016; Wagstaff et al, 2016; Bisson‐Filho et al, 2017; Yang et al, 2017).
We did not observe asymmetric early‐constriction in all bacterial species; for example, all of the dividing E. coli and B. subtilis cells in the Caltech Tomography Database appear symmetric. We doubt these phenotypes are the result of different mechanisms, but rather simply variations in the positioning of FtsZ. In C. crescentus, a gradient of MipZ guides positioning of FtsZ (Thanbichler & Shapiro, 2006). Since the cell is curved, the point of lowest MipZ concentration is probably at the center of the outer curvature; this may then serve as a nucleation site for FtsZ to assemble into short arcs and initiate constriction and PG synthesis. E. coli, by contrast, uses spatial oscillations of the Min proteins to inhibit FtsZ polymerization (Raskin & de Boer, 1999). Since E. coli cells are straight rods, this oscillation marks an entire midcell plane rather than a point, likely allowing FtsZ polymer nucleation anywhere around the cell with equal probability, quickly resulting in symmetric constriction. In spherical E. coli mutants (pbpA −, rodA −, and mreB −), a combination of Min oscillation and aberrant nucleoid position likely leads to asymmetric FtsZ nucleation and therefore asymmetric constriction (Iwaya et al, 1978; Wachi et al, 1987; Corbin et al, 2002). It remains unclear why division in the straight‐rod‐shaped P. mirabilis begins asymmetrically. In any case, these morphologically distinct division processes likely reflect differences in FtsZ localization, not function, and all are consistent with the model that complete FtsZ rings are not required for initial constriction, as suggested by Addinall and Lutkenhaus (1996).
Advantages of visualizing native FtsZ structures
Many previous fluorescence microscopy and super‐resolution fluorescence microscopy results support our model that dynamic FtsZ filaments do not necessarily form closed rings in dividing cells (Thanbichler & Shapiro, 2006; Costa et al, 2008; Fu et al, 2010; Schofield et al, 2010; Goley et al, 2011; Jennings et al, 2011; Strauss et al, 2012; Buss et al, 2013, 2015). All of these studies, however, relied on artificially expressed fusion proteins that are not fully functional (Charbon et al, 2011) and, depending on the genetic constructs used, were often expressed too early and arrived at the division plane long before native FtsZ is even normally expressed in the cell cycle (Goley et al, 2011). Thus, these studies did not faithfully reveal the physiological spatial and temporal localization of native FtsZ. Also, unlike ECT, fluorescence microscopy cannot distinguish between concentrated monomers and physically linked polymers (filaments). This is an important consideration when interpreting fluorescent images of FtsZ “rings” at the division plane (Ma et al, 1996; Sun & Margolin, 1998; Thanedar & Margolin, 2004). For example, super‐resolution fluorescence light microscopy showed that FtsZ‐Dendra2 in C. crescentus cells occupies a toroidal volume extending ~250 nm away from the membrane (Biteen et al, 2012). In ECT studies of native cells, however, FtsZ‐like filaments have never been observed at such a distance from the membrane (Li et al, 2007; Szwedziak et al, 2014); it is therefore unlikely that these signals are being produced by filamentous FtsZ. Instead, it must reflect simply a concentration of FtsZ monomers at the midplane. In a recent report, ectopically expressed FtsZ‐mEos2 in E. coli showed a punctate fluorescent volume at the midcell, as well as many non‐midcell fluorescent clusters (Coltharp et al, 2016), but ECT of native cells has not revealed FtsZ‐like filaments anywhere but at midcell. Thus, fluorescence microscopy and ECT are complementary: Fluorescence studies have the advantages of being able to label targets specifically and reveal dynamics (Ramirez et al, 2016; Wagstaff et al, 2016; Bisson‐Filho et al, 2017; Yang et al, 2017), and ECT has the advantage of being able to visualize wild‐type filaments directly in their native state.
Materials and Methods
ECT imaging
The cell strains and culture conditions used in this study are summarized in Appendix Table S3. For ECT imaging, cells growing in cultures were gently centrifuged and resuspended in 50 μl fresh medium. This resuspension was mixed with fiducial markers (10 nm gold beads treated with bovine serum albumin (BSA) to prevent aggregation) and plunge‐frozen on EM grids in a mixture of liquid ethane and propane (Tivol et al, 2008). Images were acquired using a 300 keV Polara transmission electron microscope (FEI) equipped with a GIF energy filter (Gatan) and a K2 Summit direct detector (Gatan). Tilt‐series were collected from −60° to +60° in 1° increments using UCSF Tomography software (Zheng et al, 2007) with a defocus of −8 μm and total dosage of 160 e−/Å2. Tomograms were calculated using IMOD software (Kremer et al, 1996). Segmentation and rendering were performed using the Amira package (FEI) and IMOD software.
Labeling nascent PG incorporation
For fluorescent labeling of PG, the procedure was adapted from (Kuru et al, 2012). HADA (7‐hydroxycoumarin‐3‐carboxylic acid‐amino‐D‐alanine) was provided by Dr. Yves Brun at Indiana University. Briefly, exponentially growing wild‐type C. crescentus NA1000/CB15N cells in M2G medium (OD600 = 0.3) were incubated at room temperature for 1.5 min with 500 μM HADA. Cells were then fixed on ice for 20 min by adding ice‐cold anhydrate ethanol to a final concentration of 85%. Cells were washed three times with PBS buffer (pH 7.4), placed on agarose‐coated slides and imaged with an Eclipse 90i light microscope (Nikon). The same protocol was used for labeling P. mirabilis cells except the cells were incubated at 30°C for 7.5 min. Fluorescence value profiles were measured using ImageJ (Schneider et al, 2012). Length of a dividing cell was calculated by adding the two lengths from each terminus to the division plane. Cell lengths were measured using Photoshop CS6 (Adobe System Incorporated), and figures were generated using the software OriginPro 8.0 (OriginLab Corporation, http://www.originlab.com).
Measurements of cell width, radius of curvature, and indentation length
For data analysis, we wrote a software tool to measure the width and indentation near the constriction site on either side of the cell (Appendix Fig S1). The inner membrane was subsampled at 50‐nm intervals and fitted to a centripetal natural cubic spline. The program uses either of two criteria to define constriction: (i) at the indentation site, if the program can find three curvature maxima, one concave (inner) curvature maximum and two convex (outer) maxima, the site is defined as a constriction; (ii) if the program can detect a site on the inner membrane with r < 300 nm, the program also defines this site as a constriction.
Author contributions
QY and GJJ conceived and designed the experiments. QY, Y‐WC, MB, CVI, AB, and DG performed the experiments. AIJ wrote the software and made measurements. QY, AIJ, CMO, and GJJ analyzed the data. QY, AIJ, Y‐WC, CMO, and GJJ wrote the paper.
Conflict of interest
The authors declare that they have no conflict of interest.
Supporting information
Appendix
Expanded View Figures PDF
Review Process File
Acknowledgements
We thank Dr. Yves Brun and Mr. Erkin Kuru at Indiana University for providing reagents and technical assistance. We thank Prof. Douglas Weibel at University of Wisconsin‐Madison for providing the Proteus mirabilis strain. We thank Dr. Brian Hedlund at the University of Nevada for providing the Belliella baltica‐related strain. We are also grateful to all members of the Jensen laboratory for discussion and technical assistance. This work was supported by the Howard Hughes Medical Institute.
The EMBO Journal (2017) 36: 1577–1589
References
- Adams DW, Errington J (2009) Bacterial cell division: assembly, maintenance and disassembly of the Z ring. Nat Rev Microbiol 7: 642–653 [DOI] [PubMed] [Google Scholar]
- Addinall SG, Lutkenhaus J (1996) FtsZ‐spirals and ‐arcs determine the shape of the invaginating septa in some mutants of Escherichia coli . Mol Microbiol 22: 231–237 [DOI] [PubMed] [Google Scholar]
- Anderson DE, Gueiros‐Filho FJ, Erickson HP (2004) Assembly dynamics of FtsZ rings in Bacillus subtilis and Escherichia coli and effects of FtsZ‐regulating proteins. J Bacteriol 186: 5775–5781 [DOI] [PMC free article] [PubMed] [Google Scholar]
- Bendezu FO, de Boer PA (2008) Conditional lethality, division defects, membrane involution, and endocytosis in mre and mrd shape mutants of Escherichia coli . J Bacteriol 190: 1792–1811 [DOI] [PMC free article] [PubMed] [Google Scholar]
- Bi EF, Lutkenhaus J (1991) FtsZ ring structure associated with division in Escherichia coli . Nature 354: 161–164 [DOI] [PubMed] [Google Scholar]
- Bisson‐Filho AW, Hsu Y‐P, Squyres GR, Kuru E, Wu F, Jukes C, Sun Y, Dekker C, Holden S, VanNieuwenhze MS, Brun YV, Garner EC (2017) Treadmilling by FtsZ filaments drives peptidoglycan synthesis and bacterial cell division. Science 355: 739–743 [DOI] [PMC free article] [PubMed] [Google Scholar]
- Biteen JS, Goley ED, Shapiro L, Moerner WE (2012) Three‐dimensional super‐resolution imaging of the midplane protein FtsZ in live Caulobacter crescentus cells using astigmatism. ChemPhysChem 13: 1007–1012 [DOI] [PMC free article] [PubMed] [Google Scholar]
- Buss J, Coltharp C, Huang T, Pohlmeyer C, Wang SC, Hatem C, Xiao J (2013) In vivo organization of the FtsZ‐ring by ZapA and ZapB revealed by quantitative super‐resolution microscopy. Mol Microbiol 89: 1099–1120 [DOI] [PMC free article] [PubMed] [Google Scholar]
- Buss J, Coltharp C, Shtengel G, Yang X, Hess H, Xiao J (2015) A multi‐layered protein network stabilizes the Escherichia coli FtsZ‐ring and modulates constriction dynamics. PLoS Genet 11: e1005128 [DOI] [PMC free article] [PubMed] [Google Scholar]
- Cabeen MT, Charbon G, Vollmer W, Born P, Ausmees N, Weibel DB, Jacobs‐Wagner C (2009) Bacterial cell curvature through mechanical control of cell growth. EMBO J 28: 1208–1219 [DOI] [PMC free article] [PubMed] [Google Scholar]
- Charbon G, Brustad E, Scott KA, Wang J, Lobner‐Olesen A, Schultz PG, Jacobs‐Wagner C, Chapman E (2011) Subcellular protein localization by using a genetically encoded fluorescent amino acid. ChemBioChem 12: 1818–1821 [DOI] [PMC free article] [PubMed] [Google Scholar]
- Coltharp C, Buss J, Plumer TM, Xiao J (2016) Defining the rate‐limiting processes of bacterial cytokinesis. Proc Natl Acad Sci USA 113: E1044–E1053 [DOI] [PMC free article] [PubMed] [Google Scholar]
- Corbin BD, Yu XC, Margolin W (2002) Exploring intracellular space: function of the Min system in round‐shaped Escherichia coli . EMBO J 21: 1998–2008 [DOI] [PMC free article] [PubMed] [Google Scholar]
- Costa T, Priyadarshini R, Jacobs‐Wagner C (2008) Localization of PBP3 in Caulobacter crescentus is highly dynamic and largely relies on its functional transpeptidase domain. Mol Microbiol 70: 634–651 [DOI] [PMC free article] [PubMed] [Google Scholar]
- Ding HJ, Oikonomou CM, Jensen GJ (2015) The caltech tomography database and automatic processing pipeline. J Struct Biol 192: 279–286 [DOI] [PMC free article] [PubMed] [Google Scholar]
- Egan AJ, Vollmer W (2013) The physiology of bacterial cell division. Ann N Y Acad Sci 1277: 8–28 [DOI] [PubMed] [Google Scholar]
- Erickson HP, Anderson DE, Osawa M (2010) FtsZ in bacterial cytokinesis: cytoskeleton and force generator all in one. Microbiol Mol Biol Rev 74: 504–528 [DOI] [PMC free article] [PubMed] [Google Scholar]
- Farley MM, Hu B, Margolin W, Liu J (2016) Minicells, back in fashion. J Bacteriol 198: 1186–1195 [DOI] [PMC free article] [PubMed] [Google Scholar]
- Fu G, Huang T, Buss J, Coltharp C, Hensel Z, Xiao J (2010) In vivo structure of the E. coli FtsZ‐ring revealed by photoactivated localization microscopy (PALM). PLoS ONE 5: e12682 [DOI] [PMC free article] [PubMed] [Google Scholar]
- Goley ED, Yeh YC, Hong SH, Fero MJ, Abeliuk E, McAdams HH, Shapiro L (2011) Assembly of the Caulobacter cell division machine. Mol Microbiol 80: 1680–1698 [DOI] [PMC free article] [PubMed] [Google Scholar]
- Haeusser DP, Margolin W (2016) Splitsville: structural and functional insights into the dynamic bacterial Z ring. Nat Rev Microbiol 14: 305–319 [DOI] [PMC free article] [PubMed] [Google Scholar]
- Horger I, Velasco E, Mingorance J, Rivas G, Tarazona P, Velez M (2008a) Langevin computer simulations of bacterial protein filaments and the force‐generating mechanism during cell division. Phys Rev E Stat Nonlin Soft Matter Phys 77: 011902 [DOI] [PubMed] [Google Scholar]
- Horger I, Velasco E, Rivas G, Velez M, Tarazona P (2008b) FtsZ bacterial cytoskeletal polymers on curved surfaces: the importance of lateral interactions. Biophys J 94: L81–L83 [DOI] [PMC free article] [PubMed] [Google Scholar]
- Iancu CV, Wright ER, Benjamin J, Tivol WF, Dias DP, Murphy GE, Morrison RC, Heymann JB, Jensen GJ (2005) A “flip‐flop” rotation stage for routine dual‐axis electron cryotomography. J Struct Biol 151: 288–297 [DOI] [PubMed] [Google Scholar]
- Ingerson‐Mahar M, Briegel A, Werner JN, Jensen GJ, Gitai Z (2010) The metabolic enzyme CTP synthase forms cytoskeletal filaments. Nat Cell Biol 12: 739–746 [DOI] [PMC free article] [PubMed] [Google Scholar]
- Iwaya M, Goldman R, Tipper DJ, Feingold B, Strominger JL (1978) Morphology of an Escherichia coli mutant with a temperature‐dependent round cell shape. J Bacteriol 136: 1143–1158 [DOI] [PMC free article] [PubMed] [Google Scholar]
- Jennings PC, Cox GC, Monahan LG, Harry EJ (2011) Super‐resolution imaging of the bacterial cytokinetic protein FtsZ. Micron 42: 336–341 [DOI] [PubMed] [Google Scholar]
- Katzmann E, Muller FD, Lang C, Messerer M, Winklhofer M, Plitzko JM, Schuler D (2011) Magnetosome chains are recruited to cellular division sites and split by asymmetric septation. Mol Microbiol 82: 1316–1329 [DOI] [PubMed] [Google Scholar]
- Kremer JR, Mastronarde DN, McIntosh JR (1996) Computer visualization of three‐dimensional image data using IMOD. J Struct Biol 116: 71–76 [DOI] [PubMed] [Google Scholar]
- Kuru E, Hughes HV, Brown PJ, Hall E, Tekkam S, Cava F, de Pedro MA, Brun YV, VanNieuwenhze MS (2012) In Situ probing of newly synthesized peptidoglycan in live bacteria with fluorescent D‐amino acids. Angew Chem Int Ed Engl 51: 12519–12523 [DOI] [PMC free article] [PubMed] [Google Scholar]
- Lan G, Daniels BR, Dobrowsky TM, Wirtz D, Sun SX (2009) Condensation of FtsZ filaments can drive bacterial cell division. Proc Natl Acad Sci USA 106: 121–126 [DOI] [PMC free article] [PubMed] [Google Scholar]
- Leisch N, Pende N, Weber PM, Gruber‐Vodicka HR, Verheul J, Vischer NO, Abby SS, Geier B, den Blaauwen T, Bulgheresi S (2016) Asynchronous division by non‐ring FtsZ in the gammaproteobacterial symbiont of Robbea hypermnestra . Nat Microbiol 2: 16182 [DOI] [PubMed] [Google Scholar]
- Li Z, Trimble MJ, Brun YV, Jensen GJ (2007) The structure of FtsZ filaments in vivo suggests a force‐generating role in cell division. EMBO J 26: 4694–4708 [DOI] [PMC free article] [PubMed] [Google Scholar]
- Lu C, Reedy M, Erickson HP (2000) Straight and curved conformations of FtsZ are regulated by GTP hydrolysis. J Bacteriol 182: 164–170 [DOI] [PMC free article] [PubMed] [Google Scholar]
- Ma X, Ehrhardt DW, Margolin W (1996) Colocalization of cell division proteins FtsZ and FtsA to cytoskeletal structures in living Escherichia coli cells by using green fluorescent protein. Proc Natl Acad Sci USA 93: 12998–13003 [DOI] [PMC free article] [PubMed] [Google Scholar]
- Makarova KS, Yutin N, Bell SD, Koonin EV (2010) Evolution of diverse cell division and vesicle formation systems in Archaea. Nat Rev Microbiol 8: 731–741 [DOI] [PMC free article] [PubMed] [Google Scholar]
- Margolin W (2005) FtsZ and the division of prokaryotic cells and organelles. Nat Rev Mol Cell Biol 6: 862–871 [DOI] [PMC free article] [PubMed] [Google Scholar]
- Oikonomou CM, Jensen GJ (2016) A new view into prokaryotic cell biology from electron cryotomography. Nat Rev Microbiol 14: 205–220 [DOI] [PMC free article] [PubMed] [Google Scholar]
- Osawa M, Anderson DE, Erickson HP (2008) Reconstitution of contractile FtsZ rings in liposomes. Science 320: 792–794 [DOI] [PMC free article] [PubMed] [Google Scholar]
- Osawa M, Anderson DE, Erickson HP (2009) Curved FtsZ protofilaments generate bending forces on liposome membranes. EMBO J 28: 3476–3484 [DOI] [PMC free article] [PubMed] [Google Scholar]
- Pilhofer M, Ladinsky MS, McDowall AW, Jensen GJ (2010) Bacterial TEM: new insights from cryo‐microscopy. Methods Cell Biol 96: 21–45 [DOI] [PubMed] [Google Scholar]
- Poplawski A, Gullbrand B, Bernander R (2000) The ftsZ gene of Haloferax mediterranei: sequence, conserved gene order, and visualization of the FtsZ ring. Gene 242: 357–367 [DOI] [PubMed] [Google Scholar]
- Ramirez D, Garcia‐Soriano DA, Raso A, Feingold M, Rivas G, Schwille P (2016) Chiral vortex dynamics on membranes is an intrinsic property of FtsZ, driven by GTP hydrolysis. bioRxiv. doi:10.1101/079533 [Google Scholar]
- Raskin DM, de Boer PA (1999) MinDE‐dependent pole‐to‐pole oscillation of division inhibitor MinC in Escherichia coli . J Bacteriol 181: 6419–6424 [DOI] [PMC free article] [PubMed] [Google Scholar]
- Rowlett VW, Margolin W (2014) Asymmetric constriction of dividing Escherichia coli cells induced by expression of a fusion between two min proteins. J Bacteriol 196: 2089–2100 [DOI] [PMC free article] [PubMed] [Google Scholar]
- Sato M, Mogi Y, Nishikawa T, Miyamura S, Nagumo T, Kawano S (2009) The dynamic surface of dividing cyanelles and ultrastructure of the region directly below the surface in Cyanophora paradoxa . Planta 229: 781–791 [DOI] [PubMed] [Google Scholar]
- Schneider CA, Rasband WS, Eliceiri KW (2012) NIH Image to ImageJ: 25 years of image analysis. Nat Methods 9: 671–675 [DOI] [PMC free article] [PubMed] [Google Scholar]
- Schofield WB, Lim HC, Jacobs‐Wagner C (2010) Cell cycle coordination and regulation of bacterial chromosome segregation dynamics by polarly localized proteins. EMBO J 29: 3068–3081 [DOI] [PMC free article] [PubMed] [Google Scholar]
- Soderstrom B, Skoog K, Blom H, Weiss DS, von Heijne G, Daley DO (2014) Disassembly of the divisome in Escherichia coli: evidence that FtsZ dissociates before compartmentalization. Mol Microbiol 92: 1–9 [DOI] [PMC free article] [PubMed] [Google Scholar]
- Strauss MP, Liew AT, Turnbull L, Whitchurch CB, Monahan LG, Harry EJ (2012) 3D‐SIM super resolution microscopy reveals a bead‐like arrangement for FtsZ and the division machinery: implications for triggering cytokinesis. PLoS Biol 10: e1001389 [DOI] [PMC free article] [PubMed] [Google Scholar]
- Sun Q, Margolin W (1998) FtsZ dynamics during the division cycle of live Escherichia coli cells. J Bacteriol 180: 2050–2056 [DOI] [PMC free article] [PubMed] [Google Scholar]
- Sundararajan K, Miguel A, Desmarais SM, Meier EL, Casey Huang K, Goley ED (2015) The bacterial tubulin FtsZ requires its intrinsically disordered linker to direct robust cell wall construction. Nat Commun 6: 7281 [DOI] [PMC free article] [PubMed] [Google Scholar]
- Szwedziak P, Wang Q, Bharat TA, Tsim M, Lowe J (2014) Architecture of the ring formed by the tubulin homologue FtsZ in bacterial cell division. eLife 3: e04601 [DOI] [PMC free article] [PubMed] [Google Scholar]
- Thanbichler M, Shapiro L (2006) MipZ, a spatial regulator coordinating chromosome segregation with cell division in Caulobacter . Cell 126: 147–162 [DOI] [PubMed] [Google Scholar]
- Thanedar S, Margolin W (2004) FtsZ exhibits rapid movement and oscillation waves in helix‐like patterns in Escherichia coli . Curr Biol 14: 1167–1173 [DOI] [PMC free article] [PubMed] [Google Scholar]
- Tivol WF, Briegel A, Jensen GJ (2008) An improved cryogen for plunge freezing. Microsc Microanal 14: 375–379 [DOI] [PMC free article] [PubMed] [Google Scholar]
- Typas A, Banzhaf M, Gross CA, Vollmer W (2011) From the regulation of peptidoglycan synthesis to bacterial growth and morphology. Nat Rev Microbiol 10: 123–136 [DOI] [PMC free article] [PubMed] [Google Scholar]
- Wachi M, Doi M, Tamaki S, Park W, Nakajima‐Iijima S, Matsuhashi M (1987) Mutant isolation and molecular cloning of mre genes, which determine cell shape, sensitivity to mecillinam, and amount of penicillin‐binding proteins in Escherichia coli . J Bacteriol 169: 4935–4940 [DOI] [PMC free article] [PubMed] [Google Scholar]
- Wagstaff JM, Tsim M, Oliva MA, Garcia‐Sanchez A, Kureisaite‐Ciziene D, Andreu JM, Lowe J (2016) A polymerisation‐associated conformational switch in FtsZ that enables treadmilling. bioRxiv. doi:10.1101/093708 [DOI] [PMC free article] [PubMed] [Google Scholar]
- Yang X, Lyu Z, Miguel A, McQuillen R, Huang KC, Xiao J (2017) GTPase activity‐coupled treadmilling of the bacterial tubulin FtsZ organizes septal cell wall synthesis. Science 355: 744–747 [DOI] [PMC free article] [PubMed] [Google Scholar]
- Zheng SQ, Keszthelyi B, Branlund E, Lyle JM, Braunfeld MB, Sedat JW, Agard DA (2007) UCSF tomography: an integrated software suite for real‐time electron microscopic tomographic data collection, alignment, and reconstruction. J Struct Biol 157: 138–147 [DOI] [PubMed] [Google Scholar]
Associated Data
This section collects any data citations, data availability statements, or supplementary materials included in this article.
Supplementary Materials
Appendix
Expanded View Figures PDF
Review Process File