

Abstract
Diatoms are amongst the most important marine microalgae in terms of biomass, but little is known concerning the molecular mechanisms that regulate their versatile metabolism. Here, the pennate diatom Phaeodactylum tricornutum was studied at the metabolite and transcriptome level during nitrogen starvation and following imposition of three other stresses that impede growth. The coordinated upregulation of the tricarboxylic acid (TCA) cycle during the nitrogen stress response was the most striking observation. Through co‐expression analysis and DNA binding assays, the transcription factor bZIP14 was identified as a regulator of the TCA cycle, also beyond the nitrogen starvation response, namely in diurnal regulation. Accordingly, metabolic and transcriptional shifts were observed upon overexpression of bZIP14 in transformed P. tricornutum cells. Our data indicate that the TCA cycle is a tightly regulated and important hub for carbon reallocation in the diatom cell during nutrient starvation and that bZIP14 is a conserved regulator of this cycle.
Keywords: bZIP, diurnal, nitrogen, Phaeodactylum tricornutum, tricarboxylic acid cycle
Subject Categories: Plant Biology
Introduction
Marine environments contain a wealth of photosynthetic micro‐ and macroalgae that are evolutionarily diverse from land plants. Terrestrial and marine organisms fix comparable amounts of carbon, but the diversity of the latter has only recently begun to be explored on the genomic level by a number of high profile marine sampling expeditions (Karsenti et al, 2011; Keeling et al, 2014; Sunagawa et al, 2015). Diatoms are amongst the most important eukaryotes in the ocean and anticipated to include over 100,000 species (Armbrust, 2009). Diatoms thrive in regions of upwelling where they can rapidly outcompete other phytoplankton (Van Oostende et al, 2015).
Diatoms originated from a secondary endosymbiosis event in which a bikont heterotroph engulfed an existing photosynthetic eukaryote, likely a red alga (Tirichine & Bowler, 2011). Currently, there are three completed genome projects for diatoms (Armbrust et al, 2004; Bowler et al, 2008; Mock et al, 2017). Their genomes show signs of frequent horizontal gene transfers resulting in the acquisition of many bacterial genes. Despite the presence of several “green” genes that probably originated from these gene transfers, diatoms have very distinct genomes compared with green algae with a mix of features that were thought to be exclusive to other kingdoms. These include a number of pathways that are unusual for photosynthetic organisms, such as multiple glycolytic pathways, a chimeric sterol biosynthesis pathway and a functional urea cycle (Allen et al, 2011; Fabris et al, 2012, 2014). Notably, diatoms seem to share only a limited set of genes between species. The two model diatom species Phaeodactylum tricornutum and Thalassiosira pseudonana only have 40% of their genes in common. Hence, defining a core diatom gene set, if feasible within this diverse group, will take considerably more sequencing (Bowler et al, 2008). In our study, we will focus on the pennate diatom P. tricornutum, which has a 27.6‐Mb genome containing ~12,178 genes (http://protists.ensembl.org/Phaeodactylum_tricornutum/Info/Annotation/#assembly).
The productivity of diatoms is often capped by nutrient supply. Iron is the limiting nutrient in large tracts of the open ocean, whereas coastal regions are frequently limited in silica, nitrogen or phosphate. Cells lacking these essential nutrients can no longer divide and, as is also the case in most non‐green algae, accumulate lipids as a carbon reserve (Mühlroth et al, 2013). Comprehending how an organism coordinates its response at the molecular level to survive the lack of an essential nutrient is key to understand both the metabolic capabilities and spatiotemporal distribution of diatoms. In addition to their ecological significance, nutrient responses have been investigated for their ability to induce lipid accumulation in diatoms and other algae (Mimouni et al, 2012; Abida et al, 2013). Stress responses in the two model diatoms, P. tricornutum and T. pseudonana, differ in many aspects from green algae such as Chlamydomonas reinhardtii. Unlike green algae, diatoms do not bleach during prolonged periods of darkness and, although they store carbon in the form of chrysolaminarin, they do not accumulate carbohydrates to the same degree (Veuger & van Oevelen, 2011; Yang et al, 2014; Juergens et al, 2016). Diatoms routinely excel at screening programmes for lipid producers (Sheehan et al, 1998). It can thus be anticipated that understanding the control mechanisms that alter the metabolic flux into storage product synthesis will allow the rational improvement of lipid biosynthesis to attain commercially relevant levels in this species.
Transcriptome and proteome profiling following nitrogen or phosphorus starvation in the model diatoms P. tricornutum and T. pseudonana (Hockin, 2011; Dyhrman et al, 2012; Hockin et al, 2012; Valenzuela et al, 2012; Yang et al, 2013, 2014; Alipanah et al, 2015; Feng et al, 2015; Levitan et al, 2015; Longworth et al, 2016) indicated that the response of diatom metabolism to nitrogen starvation is different from that of other photosynthetic eukaryotes and involves remodelling of intermediate metabolism, in particular of the tricarboxylic acid (TCA) and urea cycles (Allen et al, 2011; Hockin et al, 2012; Levitan et al, 2015). A catalogue of all predicted transcription factors (TFs) of P. tricornutum and T. pseudonana has been published (Rayko et al, 2010), and recent reports have identified three diatom TFs involved in blue light signalling and CO2 assimilation (Ohno et al, 2012; Huysman et al, 2013) and one novel TF family upregulated during nitrogen limitation (Matthijs et al, 2016). Nonetheless, transcriptional control mechanisms currently remain poorly understood in diatoms and over 90% of TFs still have no function assigned. Here, we analysed the transcriptional rewiring of P. tricornutum metabolism during nitrogen depletion in order to identify metabolic regulators responding to this stress, leading to the discovery of the TF bZIP14 as a regulator of the TCA cycle.
Results
Profiling of the early responses to stresses that affect P. tricornutum growth and metabolism
Nearly all reported transcriptome studies have focused on P. tricornutum cells subjected to relatively long‐term (2 days or more) nitrogen or phosphorus starvation, thereby investigating the endpoint of transcriptional reprogramming of diatom metabolism (Valenzuela et al, 2012; Yang et al, 2013, 2014; Alipanah et al, 2015; Levitan et al, 2015). Notably, the correspondence between these datasets is poor: the overlap between all genes that are upregulated by a log2 fold of one or more during nitrogen starvation in each study consists of a core set of only 59 genes (Appendix Fig S1), which corresponds to only ca. 5% of the median number of genes reported to be upregulated in the respective studies. A large fraction of this lack of overlap is likely due to differences in culturing conditions and harvesting. Indeed, stress conditions in other model organisms such as the higher plant Arabidopsis thaliana, have been reported to be difficult to replicate even within the same genotype in different laboratories (Massonnet et al, 2010). Moreover, diatoms' response to nitrogen deprivation is a dynamic process and consists of different transcriptional phases depending on how the cells were deprived of nitrogen and for how long.
Therefore, to enable the identification of early transcriptional regulators of this metabolic reprogramming, we focused on early transcriptome changes during the first day after nitrogen depletion, as recently reported (Matthijs et al, 2016). Here, we additionally profiled diatom cells subjected to three other conditions reported to negatively impact growth, allowing the definition of specific regulatory modules of the nitrogen stress response. These samples included P. tricornutum cells, either deprived of phosphate, placed in the dark, or treated with the cell cycle inhibitor nocodazole. Phosphorous, like nitrogen, is a macronutrient, but its absence leads to a much slower cell cycle arrest than nitrogen starvation (Yang et al, 2014). To contrast with the two nutrient starvation conditions, which both cease the cell cycle at G1/S and affect metabolism, cells placed in the dark were also included, because the lack of light also results in a G1/S arrest, however, without resulting in lipid production (Huysman et al, 2013). Similarly, we included the microtubule polymerization inhibitor nocodazole, which has been shown, also in P. tricornutum (Huysman et al, 2010), to halt cell division during the M‐phase.
For all treatments, sampling focused on the transition point from growth to cell division arrest, rather than on cells adapted to the treatment conditions. To determine the optimal time point for transcriptome analysis and to assess the qualitative effect of the different treatments, samples were harvested up to 48 h after medium switch, and growth (Appendix Fig S2) and metabolite accumulation (Appendix Fig S3) were monitored. Although the lipid quantification is to be interpreted with some caution due to the fact that only a single replicate was assessed, overall this indicated that the observed responses were in line with those previously reported for P. tricornutum and/or other diatoms (Hockin, 2011; Alipanah et al, 2015; Levitan et al, 2015).
As described in our recent report, RNA‐sequencing was performed on cells grown for 4, 8, and 20 h in nitrogen starvation and nutrient‐replete medium (Matthijs et al, 2016). Across all time points, nitrogen starvation affected expression of over 2,500 genes (Matthijs et al, 2016) (Dataset EV1). For the three other stresses, samples from one representative time point were sequenced. These included dark treatment for 8 h, nocodazole treatment for 20 h, and phosphate starvation for 36 h, as well as the nutrient‐replete condition at 36 h to complement the dataset with an appropriate control for the phosphate‐starvation condition. For all the investigated conditions, the time points at which RNA‐sequencing was performed coincided with the occurrence of cell cycle arrest and/or altered metabolite accumulation (Appendix Figs S2 and S3). The generation time of P. tricornutum is ~20 h, which lies well within the time frame of the experiment (48 h, Appendix Fig S2), and thus provides sufficient time for the cells to complete at least one round of cell division (Mann & Myers, 1968).
Massive changes on the transcriptome were observed (Dataset EV1). Therefore, we focused on the specificities of each of the stress transcriptomes, in particular with regard to the reprogramming of metabolism. Furthermore, taking magnitude into account as an additional parameter, we considered only the genes showing differential expression with a log2 fold change higher than two in at least one condition and time point, which amounted in total to over 33% of the predicted P. tricornutum genes (Dataset EV1). As such, we assessed and compared reprogramming of metabolism by MapMan (Usadel et al, 2009) analysis for all four stress conditions.
The TCA cycle plays a central role in carbon reallocation during nitrogen starvation
MapMan analysis of the nitrogen starvation response (Fig 1A) corroborated our reported findings (Matthijs et al, 2016), indicating that carbon metabolism was strongly affected, including gluconeogenesis, glycolysis, and the other pathways represented in Fig 1A. Notably, although nitrogen‐starved diatoms accumulated lipids, no clear upregulation of lipid biosynthetic genes or any co‐expression cluster of lipid metabolism or recycling genes was detected. In fact, several lipid biosynthesis genes were downregulated, such as a diacylglycerol transferase (Phatr3_J49462), an elongase (Phatr3_J20508), a desaturase (Phatr3_J46275), and a monoacyl transferase (Phatr3_J43099). Carbohydrates accumulated to levels up to 2.5‐fold higher in nitrogen‐starved cells than in control cells, but already plateaued after 12 h while lipid accumulation continued (Appendix Fig S3A). Eventually, a reduction in sugar biosynthesis was thus expected, because with a declining photosynthetic capacity, less photosynthate needs to be stored.
Figure 1. Nitrogen starvation leads to transcriptional reprogramming of central carbon metabolism.
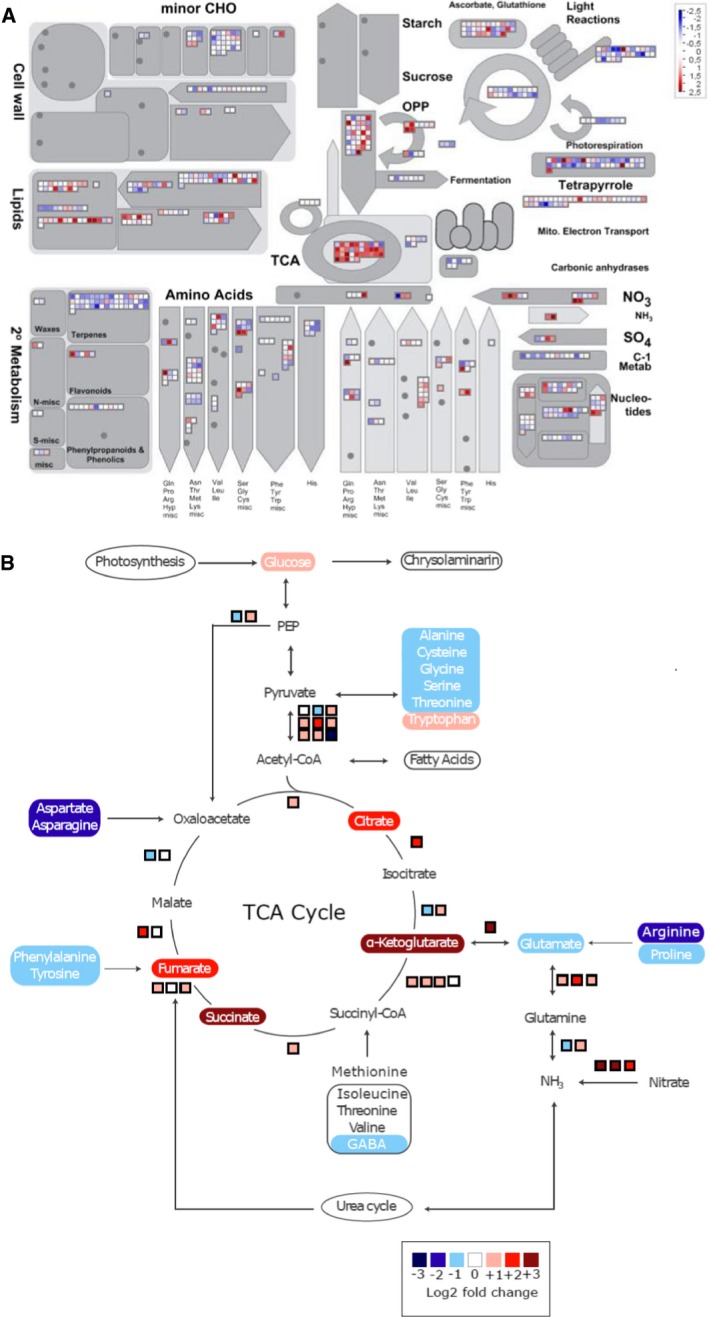
- Overview of reprogramming of primary metabolism as visualized by the MapMan program and using the normalized RNA‐Seq data. Points represent the log2 fold change in gene expression in nitrogen‐starved cells 20 h after medium change versus control cells at the same time point. Red and blue indicate gene induction and repression, respectively.
- Overview of amino acid degradation and central carbon metabolism (adapted from Hockin et al, 2012 and Obata et al, 2013). Not all reaction products are shown, and some arrows represent more than one reaction. Measured metabolites are indicated by rectangles of which the colours indicate relative log2 fold change in nitrogen‐starved versus control cells at 20 h. Pathways are indicated by ovals. Coloured boxes next to arrows indicate mRNA expression changes in log2 fold change of FPKM values of the nitrogen‐starved sample versus the control sample at 20 h.
In contrast, the capacity to absorb and assimilate nutrients strongly increased, reflected by the upregulation of genes encoding nitrate, nitrite and ferric reductases as well as enzymes involved in amino acid breakdown and nitrogen assimilation. This most likely allows the cell to re‐cycle existing intracellular nitrogen and capture any traces of this nutrient from the environment. Simultaneously, the expression of most genes from the TCA cycle was upregulated. Besides those encoding enzymes from the TCA cycle itself, genes encoding the pyruvate dehydrogenase complex (PDC) that converts pyruvate into acetyl‐CoA, the main substrate for the TCA cycle, were also upregulated. Through the action of the methylmalonyl pathway, propionyl‐CoA is converted to succinyl‐CoA, which can also feed the TCA cycle. Of the four enzymes of this pathway, three gradually increased in expression on the cessation of cell division, suggesting the activation of succinyl‐CoA production via this pathway and that at least a portion of the acetyl‐CoA may not be used for lipid biosynthesis, but rather enters the TCA cycle. Finally, transcripts of anaplerotic reactions of the TCA cycle, such as PEPC2 (Phatr3_J27976) and glutamate dehydrogenase (Phatr3_J51092), generally increased in abundance. The urea cycle transcripts were not significantly upregulated, corroborating previous studies reporting that the urea cycle is involved in recovery from nitrogen limitation, rather than in the limitation response itself (Allen et al, 2011).
To assess the activation of the TCA cycle under nitrogen‐deprived conditions, 13C label accumulation in citrate was analysed following 13C‐acetate feeding. Acetate is assumed to be converted into acetyl‐CoA, which is a direct substrate of citrate synthase. This enzyme mediates the first reaction of the TCA cycle to produce citrate. Hence, the label accumulation in citrate likely reflects the in vivo activity of citrate synthase and, further, the metabolic flux into the TCA cycle. The cells grown under control and nitrogen‐starved conditions were incubated with 13C‐acetate, and the time course of label accumulation in citrate was determined for 120 min. The label accumulation in citrate was significantly higher in nitrogen‐depleted cells at 120 min (Fig 2A), which reflected a higher rate of label redistribution in citrate during the period of 60–120 min (Fig 2B), indicating an activation of the TCA cycle in nitrogen‐depleted cells.
Figure 2. Nitrogen starvation alters carbon reallocation.
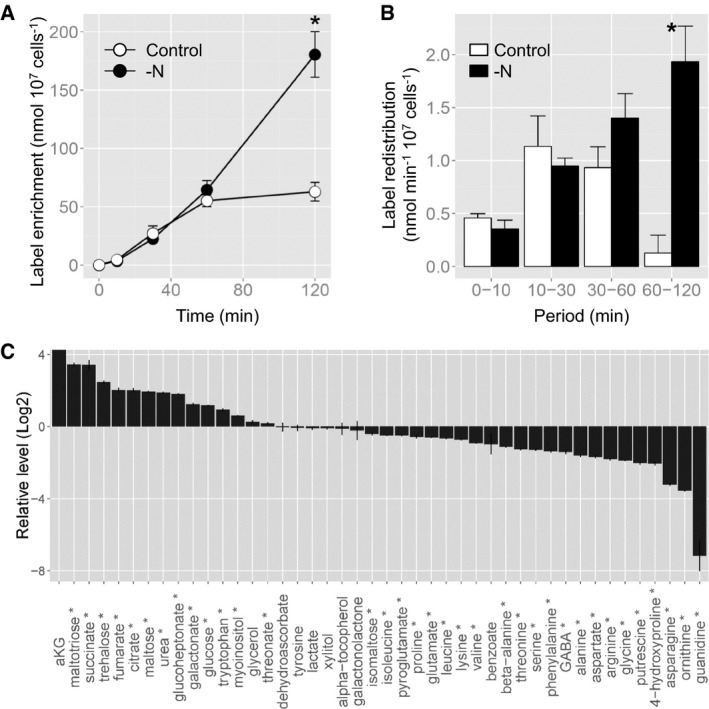
- Time course of 13C enrichment in citrate. The asterisk indicates the time period at which the values are significantly different between nitrogen‐depleted and control cells by a Student's t‐test (P < 0.05).
- Label redistribution in citrate during the periods of 0–10, 10–30, 30–60, and 60–120 min. The asterisk indicates the time period at which the values are significantly different between nitrogen‐depleted and control cells by a Student's t‐test (P < 0.05).
- The log2 fold changes in metabolite levels in nitrogen‐starved versus control cells following 20 h of culturing in nitrogen‐depleted conditions. The metabolites marked by an asterisk were significantly altered between control and nitrogen‐depleted conditions by a Student's t‐test (P < 0.05). α‐ketoglutarate (aKG) was detected only in nitrogen‐starved cells.
Remarkably, the fast and coordinated upregulation of the TCA cycle appears to be one of the most pronounced events of the early transcriptional reprogramming of metabolism during nitrogen starvation and moreover seems to be specific for the response to this stress situation. Indeed, no such upregulation was observed in P. tricornutum cells subjected to light deprivation, nocodazole treatment, or phosphate starvation (Appendix Figs S4, S5, S6 and S7), which all triggered other, often specific, transcriptional reprogramming of metabolism (Appendix Figs S4, S5, S6 and S7), which will however not be further discussed in detail here.
Given its central role in metabolism, the TCA cycle impacts many processes (Fig 1A). Therefore, the observed transcriptional remodelling specific for nitrogen‐starved P. tricornutum cells prompted us to assess intermediate metabolism during nitrogen starvation at the metabolome level as well. Metabolite levels in P. tricornutum cells 20 h after the removal of nitrogen were compared with those in exponentially growing cells (Fig 2C). Nitrogen‐depleted cells showed more than a four times higher accumulation level of all detected TCA cycle intermediates, namely α‐ketoglutarate (aKG), succinate, fumarate, and citrate, than the control. A previous study has reported that the levels of aKG increased over 18‐fold, whereas citrate levels decreased the following 3 days of nitrogen starvation (Guerra et al, 2013). As expected, the levels of most amino acids, except for tryptophan and tyrosine, as well as of other major nitrogen‐containing metabolites, such as ornithine and putrescine, were decreased in nitrogen‐starved cells due to the lack of nitrogen, whereas urea accumulated to a level twice as high under nitrogen deficiency. Some sugars, including maltotriose, maltose and glucose, accumulated to higher levels in nitrogen‐depleted cells, suggesting the redirection of carbon sources from amino acids to carbohydrate synthesis. Overall, the metabolite profile of nitrogen‐starved cells was quite similar to that of an RNAi line with lowered activity of carbamoyl phosphate synthase, the enzyme that mediates the carbon and nitrogen fixation step of the ornithine‐urea cycle (Allen et al, 2011). This is likely the result of inhibition of this pathway due to the lack of ammonium, a substrate of carbamoyl phosphate synthase. Taken together, the metabolite profiling results clearly showed a significantly altered carbon metabolism under nitrogen‐starved conditions, including an increased accumulation of the TCA cycle intermediates.
The transcription factor bZIP14 activates TCA cycle gene expression
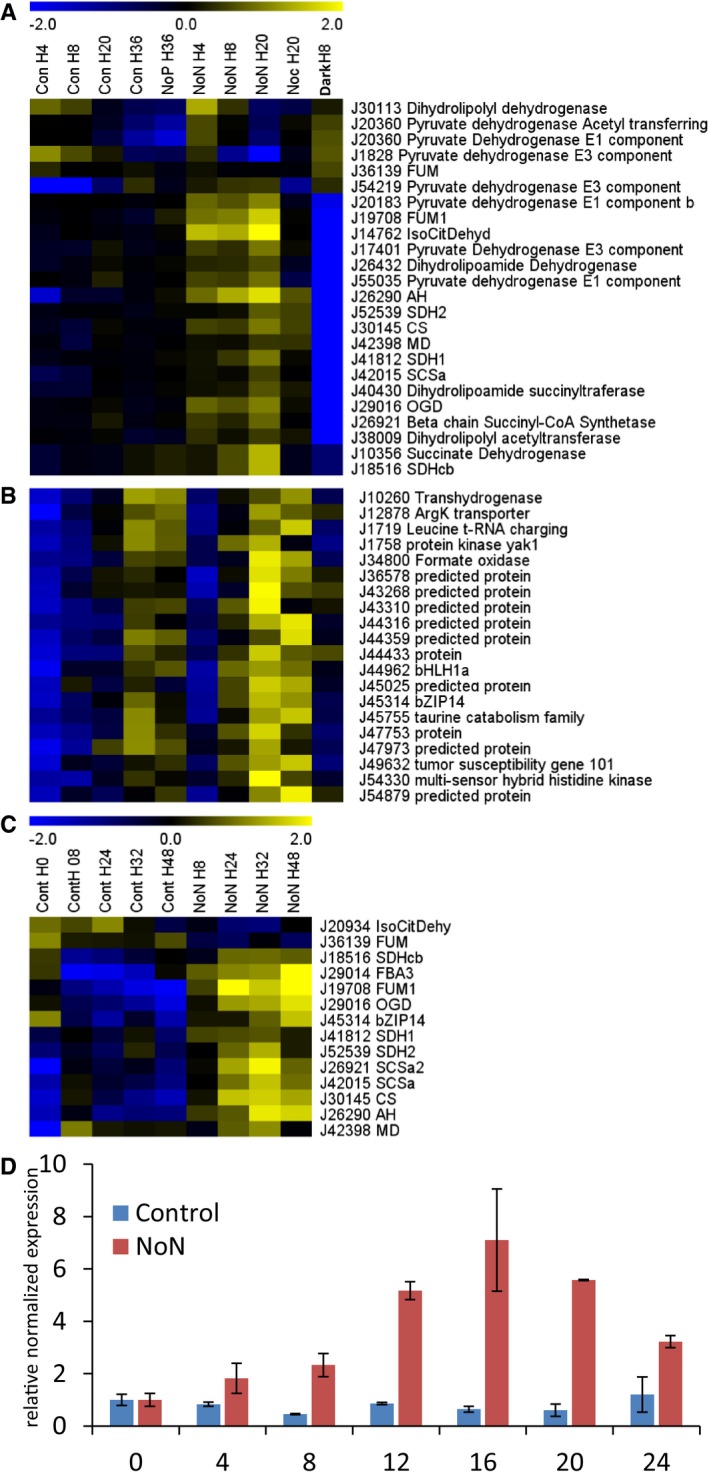
Of the 24 enzyme‐encoding genes annotated as putatively involved in the TCA cycle, 19 were significantly upregulated in a coordinated manner during nitrogen starvation (Fig 3A). This was independently confirmed in a separate qRT–PCR analysis at longer timescales for 13 TCA cycle genes (Fig 3C). TCA transcript levels increased gradually and concurrently during the nitrogen starvation time course. This suggests a common regulation mediated by one or a small set of TFs that are activated early in the nitrogen stress response. In case of plant stress responses, TFs regulating a certain process often show a similar expression pattern as the process they regulate, because they are the precedent step in the signal cascade or, alternatively, part of feedback or amplification loops (De Geyter et al, 2012). Therefore, we examined the expression profiles of all previously identified P. tricornutum TFs (Rayko et al, 2010). By looking for TF‐encoding genes with a maximum expression peak during nitrogen starvation and higher than the median of the entire dataset, the TFs termed bZIP14 (Phatr2_45314), bHLH1a (Phatr3_J44962) and HSF1g (Phatr3_J42514) were retained as promising candidate regulators of the TCA cycle (Fig 3B and Dataset EV1). It should be noted that the gene model of bZIP14 in the Phatr3 annotation is split into two gene models (EG02108 and EG02109); however, there is ample sequence data to support the original Phatr2 model, which is therefore the one we will rely on as well (Appendix Fig S8). Upregulation of all three candidates during nitrogen starvation was also observed in a previous transcriptome study (Valenzuela et al, 2012). The induction of bZIP14 was validated using qRT–PCR (Fig 3D).
Figure 3. Coordinated transcriptional upregulation of TCA cycle genes under nitrogen starvation is accompanied by upregulation of bZIP14 .
-
A, BExpression profile of TCA cycle genes (A) and bZIP14 co‐expression cluster (B) during nitrogen starvation. Cluster analysis was performed based on Fragments Per Kilobase Of Exon Per Million Fragments Mapped (FPKM) values normalized to the average FPKM value across all samples. Yellow and blue indicate gene induction and repression, respectively. Con, control cells; NoN, nitrogen‐depleted cells; NoP, phosphate‐starved cells; Noc, nocodazole‐treated cells; Dark, dark‐placed cells; H, hours.
-
CExpression pattern of TCA cycle genes during nitrogen starvation assessed by qRT–PCR on an independent repeat of the RNA‐Seq time course (n = 3). Cells grown in nitrogen‐repleted and ‐depleted conditions were harvested at the indicated time points to confirm the expression pattern of the TCA cycle genes observed in the RNA‐Seq analysis.
-
DExpression pattern of bZIP14 during nitrogen starvation assessed by qRT–PCR on an independent repeat of the RNA‐Seq time course. Values in the y‐axis represent the relative normalized expression ± SE of two biological repeats (each in three technical repeats) relative to the levels at time point 0 (set at 1). The x‐axis indicates time in hours.
The link between these TFs and the TCA cycle was investigated by the generation of P. tricornutum lines overexpressing these TFs. We were unsuccessful in generating a bHLH1a overexpression line. Several lines overexpressing HSF1g could be generated, but neither a distinctive phenotype, nor any effect on the TCA cycle could be observed. Finally, two lines showing robust overexpression of bZIP14 were obtained (Fig 4A). Median bZIP14 expression in Fragments Per Kilobase Of Exon Per Million Fragments Mapped (FPKM) (Dataset EV1) corresponded to a third of the reported FCP promoter strength used to drive bZIP14 overexpression (Schmittgen & Livak, 2008); hence, the fold change in bZIP14 expression was within expectations. The bZIP14 overexpression lines did not display any visual morphological phenotype either, nor any cellular characteristics associated with nutrient starvation such as the appearance of lipid droplets. However, using qRT–PCR, it was shown that six transcripts of the TCA cycle enzymes had a significantly higher expression level compared with the control lines (Fig 4B). To confirm that this upregulation was not merely due to decreased nitrogen levels, the expression of the Urease (Phatr3_J29702) gene, which shows robust induction upon nitrogen starvation, was determined in parallel and confirmed to be unaltered in comparison with the control lines (Fig 4B).
Figure 4. Overexpression of bZIP14 activates the TCA cycle.
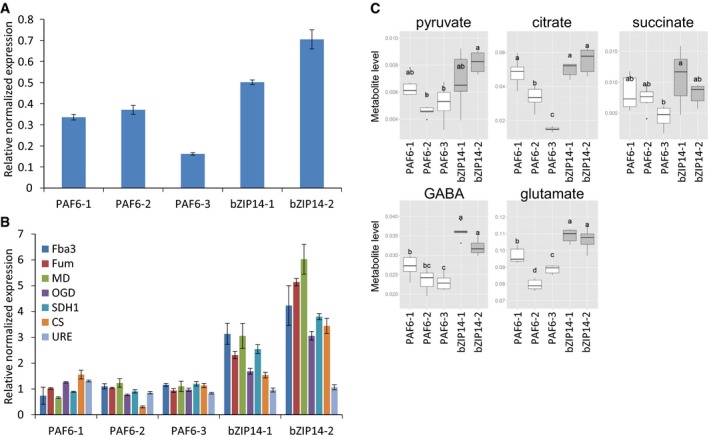
- Verification of bZIP14 overexpression in transformed P. tricornutum cells by qRT–PCR (n = 3). Three control (PAF6) and two bZIP14 OE lines were assessed. The control lines are empty vector transformed. Values in the y‐axis represent the relative normalized expression to the two reference genes used ± SE of three technical repeats.
- Determination of TCA cycle transcript levels in bZIP14 overexpression lines by qRT–PCR (n = 3). During nitrogen starvation, Urease (URE, Phatr3_J29702) transcript levels were over threefold upregulated (Dataset EV1), illustrating that the transformed cell lines did not lack nitrogen in the condition assayed here. FBA3: fructose bisphosphate aldolase 3, Phatr3_J29014; MD: malate dehydrogenase, Phatr3_J42398; FUM: fumarase, Phatr3_J36139; OGD: 2‐oxoglutarate dehydrogenase E1 component, Phatr3_J29016; CS: citrate synthase, Phatr3_J30145; SDH1: succinate dehydrogenase flavoprotein, Phatr3_J41812.
- Metabolite levels of the TCA cycle‐related organic acids (pyruvate, citrate, and succinate), glutamate, and gamma‐butyric acid (GABA) in bZIP14 overexpression lines (n = 6). Box plots show relative metabolite levels. The box and the horizontal line within the box represent the data at first and third quartile and median, respectively. The ends of vertical bars show maximum and minimum values. Letters indicate the results of a Tukey's test comparing metabolite levels amongst genotypes.
Next, primary metabolite abundance was measured in the bZIP14 overexpression lines (Fig 4C). Amino acids were generally present at higher levels in these lines (Appendix Fig S9). Whereas only slightly higher levels of TCA cycle‐related organic acids, such as pyruvate, succinate, and citrate, were seen compared with the controls, a clear difference was observed for γ‐butyric acid (GABA) and glutamate (Fig 4C). These metabolites are intimately associated with the TCA cycle, because glutamate can be interconverted with aKG by a single reaction, and GABA is an intermediate of the GABA shunt pathway that bypasses two reactions of the TCA cycle. Together, these transcript and metabolite profiles strongly support the role of bZIP14 as a regulator of the TCA cycle and nitrogen metabolism.
To analyse how bZIP14 might regulate TCA cycle gene expression, the motif bound by the TF was determined using a protein binding microarray (Godoy et al, 2011). The protein was expressed in Escherichia coli, purified and subsequently incubated with a double‐stranded oligonucleotide array containing all possible combinations of eleven nucleotides. This analysis demonstrated that the bZIP14 protein preferentially binds two motifs with a core ACGT sequence (Fig 5A), namely TGACGT (motif 1) and GTACGTA (motif 2), thus showing similar binding preferences as plant bZIP proteins, which also bind the ACGT core, preferentially as a C‐box (GACGTC, corresponding to motif 2), A‐box (TACGTA, corresponding to motif 2), or G‐box (CACGTG) (Jakoby et al, 2002). The G‐box (called motif 3 hereafter) was not identified as an enriched element in the bZIP14 protein binding microarray analysis (Appendix Fig S10).
Figure 5. bZIP14 binds the ACGT core motif.
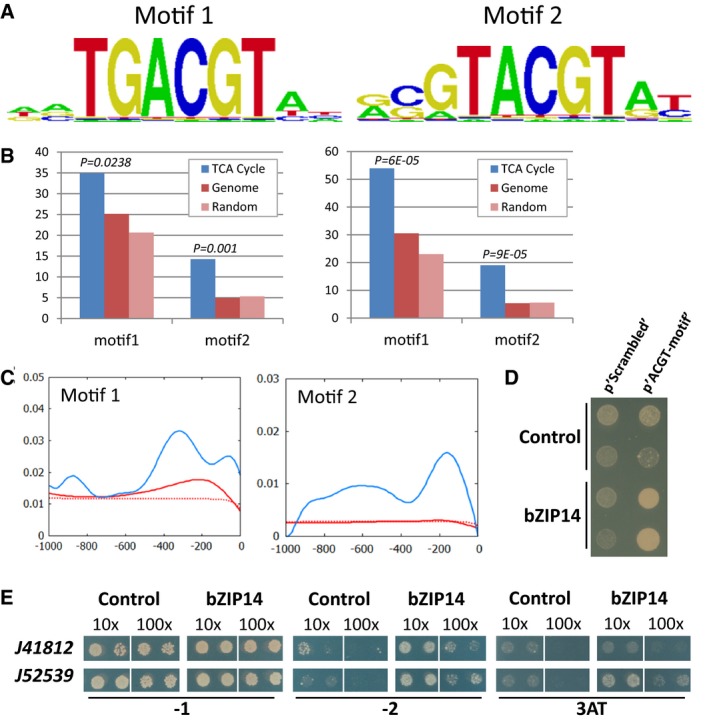
- TF binding sites as predicted by the protein binding array represented as positional weight matrixes. Shown are the two binding motifs obtained by generating the consensus motif from all oligonucleotides bound by the recombinant protein with an E‐score > 0.45.
- Scan for the bZIP14 motifs in all P. tricornutum gene promoters (genome, in red; random promoters, in light red) or only those linked to the TCA cycle (in blue). Left and right panels show the % promoters with motif 1 or 2 and the number of motifs per promoter, respectively, within 0.5 kb upstream of the ORF. P‐values correspond to the comparison between the promoters of the TCA cycle containing the motif and all the promoters of the genome containing the same motif (hypergeometric distribution).
- Histogram showing an increased density of the bZIP14 motifs in the proximal promoter regions of the “TCA cycle genes” (in blue), compared with those in the whole genome (in red) or in random promoters (dashed red). The complete scan of 1.0 kb upstream of the ORF is shown.
- Y1H analysis with a synthetic promoter. The full‐length bZIP14 ORF fused to GAL4AD (bZIP14) or the empty vector control (control) was expressed in reporter strains harbouring the HIS3 gene under control of a synthetic promoter element consisting of both bZIP14 motif1 and motif2 with random nucleotide spacers (p'ACGT‐motif') or a scrambled version (p'Scrambled') thereof. Transformed yeast cultures dropped in serial dilutions (10‐ and 100‐fold) were grown for 6 days on selective medium (minus histidine and plus 3‐AT).
- Y1H analysis with diatom gene promoters. The full‐length bZIP14 ORF fused to GAL4AD (bZIP14) or the empty vector control (control) was expressed in reporter strains harbouring the HIS3 gene under control of a 150‐bp and 219‐bp promoter sequence of the P. tricornutum genes Phatr3_J41812 and (mitochondrial succinate dehydrogenase iron‐sulphur subunit) Phatr3_J52539, respectively. Transformed yeast cultures (two independent transformants) dropped in serial dilutions (10‐ and 100‐fold) were grown for 6 days on control medium (−1) and selective medium (minus histidine (−2) or minus histidine plus 3‐AT (3AT)).
The prevalence of the bZIP14 DNA‐binding motifs in putative P. tricornutum promoters was determined by examining their occurrence in the 1,000 nucleotides upstream of the start codon of each gene (Appendix Table S1). Three sets of gene sequences were scanned and compared, respectively containing the promoters of all P. tricornutum genes, the promoters of only the 63 earmarked by their GO term as “involved in or linked with the TCA cycle” and “random promoters”. Both motifs were significantly overrepresented in the TCA cycle gene set (Fig 5B) and particularly enriched in the proximal promoter regions of the latter genes (Fig 5C), further strengthening a role for bZIP14 as regulator of the TCA cycle. Of the TCA cycle genes, at least nine contain one or more of the bZIP14 motifs (Appendix Table S1), most of which were also significantly upregulated during nitrogen starvation, including malate dehydrogenase (Phatr3_J42398), mitochondrial succinate dehydrogenase iron‐sulphur subunit (Phatr3_J52539), succinate dehydrogenase flavoprotein (Phatr3_J41812), succinate‐CoA ligase (Phatr3_J42015), aconitate hydratase 2 (Phatr3_J26290), and succinyl‐CoA synthetase (Phatr3_J26921) (Fig 3). A discrete enrichment of motif 3 in the promoters of genes involved in the TCA cycle could be observed, possibly pointing to a partial participation of additional TFs (either bZIP or bHLH factors) in the transcriptional regulation of the TCA cycle gene set (Appendix Fig S10). Additionally, the set of genes containing the bZIP14 motifs in their promoter included those encoding several enzymes catalysing anaplerotic reactions, such as phosphoenolpyruvate carboxylases, malic enzymes, and fructose bisphosphate aldolases (Appendix Table S1), all of which showed nitrogen starvation‐inducible expression, similar to the TCA cycle genes (Fig 2 and Dataset EV1). Finally, also the promoter of bZIP14 itself contains motif 1 (Appendix Table S1), supporting the postulated existence of an amplification loop. We did not further scan the promoters of other TCA cycle genes for the presence of slightly deviating motifs or over more than 1,000 nucleotides upstream of the start codon; hence, we will not further speculate about possible direct bZIP14‐mediated regulation of the expression of TCA cycle genes such as fumarase (Phatr3_J36139) or citrate synthase (Phatr3_J30145), which were also induced by nitrogen starvation (Fig 3A) and are upregulated in the bZIP14 overexpression lines (Fig 4B) but do not contain an exact match of either motif 1 or motif 2 in the first 1,000 nucleotides upstream of the start codon.
Binding of bZIP14 to the motifs 1 and 2 in the promoters of the TCA cycle genes was confirmed by yeast one‐hybrid (Y1H) experiments. First, we used a reporter gene under the control of a synthetic promoter element, containing bZIP14 motif 1 and motif 2, which could be bound by bZIP14 in yeast cells (Fig 5D). Next, we cloned the promoter sequences of the P. tricornutum genes encoding succinate dehydrogenase flavoprotein (Phatr3_J41812) and mitochondrial succinate dehydrogenase iron‐sulphur subunit (Phatr3_J52539), which, respectively, contain one or both of the bZIP14 motifs (Appendix Table S1). Y1H analysis with strains in which the reporter gene was fused to each of these promoters indicated that bZIP14 could bind both promoters, with the strongest affinity for the Phatr3_J52539 construct with the two motifs (Fig 5E). Together, all of these data provide strong support for the role of bZIP14 as a direct regulator of the TCA cycle genes.
Diurnal rhythms affect the TCA cycle
The existing literature was searched for other physiological conditions that induce TCA cycle transcripts in P. tricornutum with the aim to further validate the association between bZIP14 and the TCA cycle. In a report by Chauton et al (2013) who investigated transcriptional changes during 16‐h/8‐h light/dark cycles, the TCA cycle was found to be upregulated at the end of the light phase (dusk). In this dataset, the log2 fold change for the bZIP14 transcript between the last and first 8 h of the light phase was estimated to be 1.6. This increase is in line with what is seen during nitrogen starvation (Fig 3 and Dataset EV1). In plants such as Arabidopsis, the TCA cycle is under circadian regulation but changes rather occur on the post‐translational level (Lee et al, 2010). Nonetheless, disruption of circadian control genes results in measurable TCA metabolite changes (Fukushima et al, 2009; Nakamichi et al, 2009).
To further assess the potential link between the TCA cycle and bZIP14 in diurnal regulation, we performed a meta‐analysis of published datasets related to studies of day–night cycles. First, we found that the diurnal pattern of expression was also observed by Smith et al (2016) in a recent study. The bZIP14 transcript, and the TCA cycle genes in general, showed a gradual increase of expression towards dusk followed by a decline during the dark phase (Fig 6A). This co‐expression was unaffected by iron deficiency. Second, RNA‐Seq data for diurnal rhythms are also available for the centric diatom T. pseudonana (Ashworth et al, 2013) and the eustigmatophyte Nannochloropsis oceanica (Poliner et al, 2015). The same expression patterns were found to occur. The T. pseudonana orthologue of bZIP14 (Tp_24189) is progressively more highly expressed when nitrate is being depleted and expression is higher at dusk for each sampled time point. Most of the transcripts of the TCA cycle also follow this pattern. Likewise, the TCA cycle transcripts in N. oceanica also have a strong and transient peak at dusk. Co‐expression analysis shows that the coordination with the orthologue of bZIP14 in this species (CCMP1779|10268) is less strong, but nevertheless, there is correlation with both MD (CCMP1779|7762), SDH1 (CCMP1779|10056), and a succinyl transferase (CCMP1779|6254). Hence, we can postulate that overall there is strong support for a cross‐species role of bZIP14 in the regulation of the TCA cycle during day‐to‐night transitions.
Figure 6. Diurnal rhythms affect the TCA cycle and bZIP14 expression.
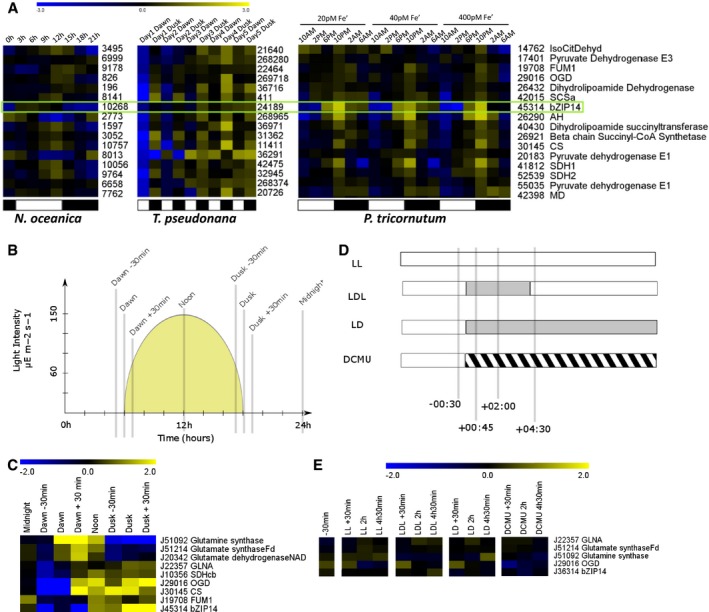
- Meta‐analysis of the expression patterns of bZIP14 orthologues in three different species of heterokonts, derived from independent transcriptomics datasets, that is, from left to right Nannochloropsis oceanica (Poliner et al, 2015), Thalassiosira pseudonana (Ashworth et al, 2013) and P. tricornutum (Smith et al, 2016). The numbers reflect CCMP1779, Thapsdraft3, and Phatr3 identifiers, respectively. FPKM values were log2 transformed and centred for comparison. Yellow and blue indicate gene induction and repression, respectively. The green box highlights the expression of bZIP14 orthologues, suggesting that its diurnal expression pattern is conserved. Representative genes from the TCA cycle were retrieved from the Smith et al (2016) dataset and clustered (Spearman's rank) after normalization. Orthologous genes in T. pseudonana and N. oceanica were identified by BLASTP, normalized, and ranked in the same order. Approximate light regimes are indicated below the clusters as light (white) and dark (black). Enzyme abbreviations are identical to those in Fig 3.
- Cartoon illustrating the growing conditions and sampling points (grey bars) of cells grown in a 12‐h:12‐h diurnal rhythm. The yellow surface indicates the light intensity (values indicated in the y‐axis).
- Heatmap of log2 transformed and centred transcript data for selected nitrogen assimilation and TCA cycle genes. Expression was determined by qRT–PCR (n = 3). Yellow and blue indicate gene induction and repression, respectively. Enzyme abbreviations are identical to those in Fig 3. GLNA, type III glutamine synthase.
- Treatments on continuously illuminated cells. Bars indicate sampling points relative to treatment start. Grey and hatched areas indicate dark and DCMU treatment, respectively. LL, continuous light; LDL, continuous light interrupted by a period of darkness; LD, continuous light followed by darkness; DCMU, DCMU‐treated cells in the light.
- Heatmap of log2 transformed and centred transcript data for selected nitrogen assimilation and TCA cycle genes. Expression was determined by qRT–PCR (n = 3). Yellow and blue indicate gene induction and repression, respectively.
Next, we initiated an additional transcript profiling analysis using cells grown in Algem photobioreactors (Algenuity). Diurnal conditions differed from those in Chauton et al (2013) because the Algem photobioreactors have LED lighting and were programmed to have a gradual increase and decrease of illumination. The photoperiod was set to 12 h:12 h, and cultures were entrained to this light regime for 1 week prior to sampling. The growing conditions and sampling points are illustrated in Fig 6B. The earlier findings by Chauton et al (2013) were confirmed by qRT–PCR in our setup, and the TCA cycle transcripts were found to gradually increase towards the end of the light phase (Fig 6C). The diurnal increase in expression of bZIP14 is similar in amplitude to that shown during nitrogen starvation, and the expression of several genes of the TCA cycle and of GLNA (Phatr3_J22357) encoding glutamine synthase III is highly correlated with that of bZIP14 (Pearson correlation P < 0.01) and anti‐correlated with that of the glutamine and glutamate synthases and glutamate dehydrogenase (Fig 6C). This indicates that the linkage between bZIP14 and the TCA cycle does not depend on the nitrogen status in diurnal rhythms.
Next, a second time series was performed to investigate whether the upregulation of the TCA cycle transcript in diurnal rhythms is due to changes in illumination and a corresponding drop in photosynthetic activity or also requires diurnal training. The sampling schedule and treatments are illustrated in Fig 6D. Cells grown in continuous light (LL) were subjected to either a 4‐h period of darkness and then re‐illuminated (LDL), kept in the dark (LD) or treated with 40 μM 3‐(3,4‐dichlorophenyl)‐1,1‐dimethylurea (DCMU), a well‐established inhibitor of photosystem II in P. tricornutum (Grouneva et al, 2009). These treatments failed to induce upregulation of the TCA cycle genes or bZIP14 (Fig 6E). Hence, decreased energy availability does not appear to be sufficient for the transcriptional modulation of the TCA cycle although diurnal training is a prerequisite.
bZIP14 is an atypical bZIP that is evolutionarily conserved in heterokonts
The bZIP14 TF is a member of the basic leucine zipper family, the third largest TF family in diatoms. The domain organization of bZIP14 is atypical, because it contains two bZIP domains (Fig 7A). This unusual domain organization facilitates the identification of potential bZIP14 orthologues in other species. It was found that the protein is evolutionarily conserved in heterokonts (Fig 7B and Appendix Fig S11). Every sequenced diatom genome appeared to possess at least one “bZIP14” gene copy. Furthermore, surveying the transcriptome assemblies of the “Marine Microbial Eukaryote Transcriptome Sequencing Project”, the biggest repository of eukaryotic algal sequences (Keeling et al, 2014), revealed that each investigated diatom contained a close orthologue of the bZIP14 TF (Fig 7B). The assembly quality can vary in the de novo transcriptome database, and putative peptides were pre‐filtered with CD‐hit (Li & Godzik, 2006; Fu et al, 2012) to remove sequences that were under 200 amino acids or had over 90% identity within the dataset. As such, BLAST analysis identified a total of 137 sequences (with an E‐value cutoff of 10−10), all of them containing two bZIP domains, indicating that the protein is strongly conserved in heterokonts. Amino acid identity was the highest around the two bZIP domains. The most closely related bZIP proteins with a single domain appeared to be the aureochrome proteins (Appendix Fig S11). Because most of the mined diatom transcriptomes possessed a single “bZIP14” copy, this appears to be a unigene. More distantly related heterokonts, such as the macroalgae Ectocarpus siliculosus and the non‐photosynthetic oomycete Albugo candida also contain a protein with a similar structure in a single copy. In contrast, no orthologues were found in green algae or land plants.
Figure 7. bZIP14 is an atypical bZIP that is evolutionarily conserved in heterokonts.
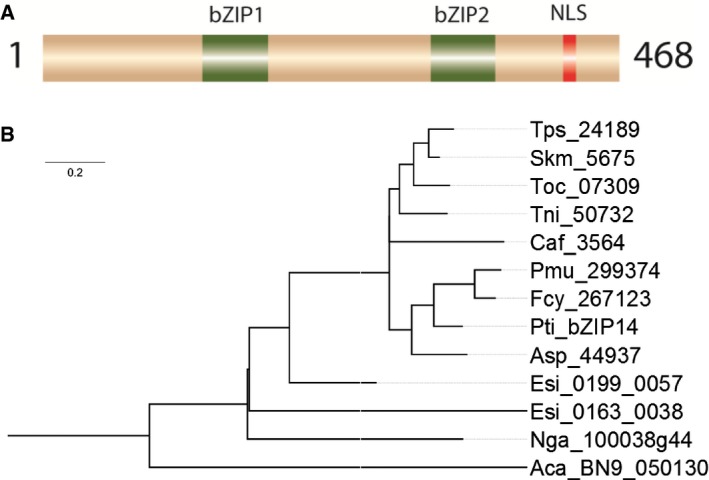
- Schematic representation of bZIP14. NLS, nuclear localization signal; bZIP, basic leucine zipper domain.
- Phylogenetic analysis of heterokont proteins with two bZIP domains. Aca: Albugo candida; Asp: Amphiprora sp.; Caf: Chaetoceros affinis; Esi: Ectocarpus siliculosus; Fcy: Fragilariopsis cylindrus; Nga: Nannochloropsis gaditana; Pmu: Pseudonitzschia multiseries; Pti: Phaeodactylum tricornutum; Skm: Skeletonema‐menzelii; Tni: Thalassiosira nitzschioides; Toc: Thalassiosira oceanica; Tps: Thalassiosira pseudonana.
The bZIP14 transcriptional patterns were also detected in other studies. Transcripts of bZIP14 are more than twofold upregulated in the published datasets of Valenzuela et al (2012) and Yang et al (2013), corroborating our transcriptome analysis. More notably however, mining of publicly available expression data from different diatom species generated from a single laboratory during nitrogen starvation (GEO GSE56132; http://www.ncbi.nlm.nih.gov/geo/query/acc.cgi?acc=GSE56132) indicated that bZIP14 expression was also activated in the nitrogen stress response in those species, including P. tricornutum, T. pseudonana, and Fragiliariopsis cylindrus (Appendix Fig S12). Together, these data support an evolutionarily conserved role of bZIP14 in the reprogramming of carbon metabolism in the nitrogen stress response in diatoms and other heterokonts.
Discussion
The TCA cycle is rapidly and co‐ordinately upregulated in the nitrogen stress response in diatoms
In this study, we performed a detailed analysis of the early transcriptome and metabolome responses of the model diatom P. tricornutum during nitrogen starvation. This resulted in the identification of metabolic pathways that are rapidly affected by nitrogen starvation, as well as candidate transcriptional regulators involved in the signalling cascades activated by nitrogen depletion.
Our work highlights that genes encoding the enzymes of the TCA cycle are highly, rapidly, and simultaneously upregulated during the early stages after sensing nitrogen depletion. While several studies in two independent diatom species have already noted the upregulation of the TCA cycle genes at both the transcriptional and translational levels after nitrogen starvation for several days (Hockin et al, 2012; Valenzuela et al, 2012; Yang et al, 2013; Levitan et al, 2015), our data clearly demonstrate that the transcriptional reprogramming of the TCA cycle and other metabolic pathways is already initiated at very early times.
Given that the TCA cycle is a central pathway in primary metabolism, it is difficult to speculate which metabolic processes are most influenced by it; it can oxidize acetyl‐CoA derived from a variety of sources, supply carbon skeletons for the biosynthesis of many amino acids, or even be used to fix carbon in prokaryotes (Fuchs, 2011). In agreement with previous reports (Guerra et al, 2013; Levitan et al, 2015), our dataset advocates that the TCA cycle likely serves to make carbon available from amino acids, fatty acids, and other carbon‐containing molecules for energy generation. Intriguingly, the cell simultaneously stores carbon as fatty acid during nitrogen starvation, which also requires acetyl‐CoA. Although the photosynthetic apparatus of diatoms is strongly impaired in nitrogen‐starved cells (Alipanah et al, 2015), it appears likely that the cells can satisfy their energy needs for some time by oxidizing carbon storage reserves.
Our findings correlate well with those recently published by Levitan et al (2015), who postulated that the TCA cycle serves as the central carbon reprocessing hub under nitrogen stress. This transcriptional response has been observed both in P. tricornutum and in T. pseudonana. Differently, in the oil‐accumulating diatom Fistulifera solaris subjected to similar stress conditions, the TCA cycle genes are generally very highly expressed but show a slight decrease in transcript levels during stationary phase (Tanaka et al, 2015). This response may be diatom specific, because it has not been observed in green algae (Schmollinger et al, 2014) or the related eustigmatophyte alga Nannochloropsis gaditana, although all these species accumulate high levels of oil during nitrogen starvation (Corteggiani Carpinelli et al, 2014). In cyanobacteria, many genes encoding TCA cycle enzymes are upregulated during nitrogen starvation, although it is thought that this might have a purely anabolic role to capture recycled ammonia (Steinhauser et al, 2012). The fact that a similar remodelling of intermediate metabolism can be observed at the protein level in the distantly related diatom T. pseudonana (Hockin et al, 2012) suggests that this is a conserved response of diatom carbon metabolism to nitrogen starvation, intriguingly distinct from that of other photosynthetic eukaryotes.
Genomics and transcriptomics have delivered insights into the metabolic capabilities of brown microalgae. However, the topology of primary metabolism is still relatively unknown with comprehensive efforts in localization and metabolite transporter characteristics between compartments only just emerging (Moog et al, 2015; Chu et al, 2017). The link between dusk and nitrogen stress is currently unclear and a number of reactions such as the 2‐OG dioxygenases, aspartate‐argininosuccinate, or the GABA shunt could be the link between nitrogen‐containing compounds and the TCA cycle (Allen et al, 2011; Araújo et al, 2014; Michaeli & Fromm, 2015). In plants, for example, GABA accumulates during low light or when carbon is limiting, which is similar to dusk or the reduction in photosynthesis seen during nitrogen deprivation (Michaeli et al, 2011).
Identification of a transcriptional regulator of the TCA cycle genes
Our experiments indicated that many of the TCA cycle transcripts were upregulated in a coordinated fashion, and correlated with an actual increase in the pathway flux, which pointed to regulation mediated by one or a small set of TFs in P. tricornutum. This is notable because primary/intermediate metabolism pathways are often regulated at the post‐transcriptional level, for example, through allosteric regulation of enzyme activities or protein modifications such as phosphorylation. Although unusual, diatoms may not be the only organisms that control enzymes in the TCA cycle at the transcriptional level. Indeed, several TFs in the yeast Saccharomyces cerevisiae are able to influence TCA cycle transcript levels, such as GCN4, HAP2/3/4/5, and RTG1/2/3 (Liu & Butow, 1999; Fendt et al, 2010). Moreover, studies have revealed that the TCA cycle is the sole metabolic cycle that can be affected by TF knockouts (Fendt et al, 2010) in yeast.
In higher plants, TFs regulating a certain process in stress responses often show similar expression patterns as those of the processes they regulate, mostly because they are the preceding step in the signalling cascade or part of an amplification loop (De Geyter et al, 2012). Accordingly, mining the P. tricornutum nitrogen starvation stress transcriptomes for TF genes co‐expressing with the TCA cycle genes led to the discovery of the bZIP14 TF as a regulator of the P. tricornutum TCA cycle. The bZIP14 transcript levels raised slightly later than those of the TCA cycle genes, suggesting that its upregulation might be part of an amplification loop in the nitrogen stress response. In this regard, it is worth noting that bZIP14 had quite high “basal” expression levels (Dataset EV1). Because of the central role of the TCA cycle in metabolism, expression of the corresponding genes is never “off” and it is therefore reasonable to assume that TFs controlling their expression are always kept at certain expression levels as well.
Overexpressing the bZIP14 open reading frame (ORF) under the FcpB promoter resulted in a modest transcript increase of the native transcript, which nonetheless resulted in the increased expression of several TCA cycle enzyme transcripts, indicating a direct involvement of bZIP14 in the regulation of this metabolic pathway. Overexpression of bZIP14 also significantly influenced accumulation of primary metabolites, such as glutamate and GABA, which are derived from 2‐oxoglutarate (2‐OG), supporting a role of bZIP14 as activator of the TCA cycle. It has been suggested that 2‐OG accumulation resulting from the deamination of glutamate could be the metabolic trigger for cells to shift metabolism towards nitrogen conservation (Guerra et al, 2013). The identification of the binding motif through a protein binding assay, which was confirmed by Y1H analysis, strengthens and supports the theory that bZIP14 is a direct TCA cycle regulator. Moreover, mining publicly available expression data indicated that expression of TCA cycle genes, as well as that of the bZIP14 homologues, is also activated during nitrogen stress in other diatom species.
Further in‐depth analysis of bZIP14 function was hampered by technical constraints. Repeated attempts to generate bZIP14 knockdown lines through an RNAi strategy did not yield any line that showed significant downregulation of the bZIP14 mRNA transcript. Similarly, we did not succeed in detecting a tagged bZIP14 protein in immunoblotting despite trying N‐ and C‐terminal tags and both the native promoter as well as the established H4 and FcpB promoters to generate transgenic P. tricornutum lines. Finally, we also tried to assess whether bZIP14 could transactivate reporter constructs in two heterologous systems, that is, yeast cells and tobacco protoplasts. Earlier studies showed the ability of some diatom transcription factors to drive transcriptional activation in yeast cells when fused to the DNA‐binding domain of the GAL4 transcription factor (Matthijs et al, 2016). However, this was not the case for bZIP14. Likewise, transient transactivation assays in tobacco protoplasts of a reporter construct driven by the malate dehydrogenase (Phatr3_J42398), mitochondrial succinate dehydrogenase iron‐sulphur subunit (Phatr3_J52539), and DHLTA (Phatr3_J17401) promoters, which all contain both bZIP14 motifs, were attempted but failed to yield results, even when the diatom promoters were fused to a minimal pCaMV35S cassette, which guarantees a basal expression. We assume these failures are likely due to the evolutionary distance between diatoms and plants or yeasts and the consequent lack of the correct interacting partners needed to drive transcription, which could be either general transcriptional regulators such as RNA‐polymerase complexes or specific partners of bZIP14 in the nitrogen starvation response.
Interestingly, expression of the TCA cycle genes, as well as of bZIP14, was also found to be subjected to diurnal regulation, suggesting a functional link beyond the nitrogen starvation response. It appears that a diurnal input is required for the induction of bZIP14 at dusk, but this is not a requirement for cells during nitrogen limitation. The trigger for this transcriptional process has not been revealed in this study. However, given the correlation between the TCA cycle, amino acid synthesis and nitrogen assimilation, this signal is likely to be linked to nitrogen metabolism. Finally, bZIP14 also shows a higher expression level 20 h after nocodazole treatment. The significance of this remains to be determined, but correlates with the expression pattern of several TCA cycle genes, which were also upregulated by nocodazole treatment and possess the bZIP14 DNA‐binding motifs in their proximal promoter region.
bZIP14 is an atypical bZIP that is evolutionarily conserved in heterokonts and reminiscent of the yeast GCN4 bZIP factor
To date, only three diatom TFs have been characterized. Coincidently, two of them are members of the bZIP protein family, one of which is implied in CO2 sensing and the other in blue light signalling (Ohno et al, 2012; Huysman et al, 2013). bZIP14 is an atypical family member, because it contains two distinct bZIP domains. Phylogenetic analysis indicated that an orthologous gene with an identical domain organization as the bZIP14 gene is prevalent in many species throughout the heterokont kingdom. Accordingly, the core bZIP14 DNA‐binding motif was also found in the promoters of the TCA genes in these other diatom species. This supports an evolutionarily conserved role of bZIP14 in the reprogramming of carbon metabolism in the nutrient stress response in diatoms. No orthologues were found in green algae or land plants.
Notably, using the software tool Phyre2 (http://www.sbg.bio.ic.ac.uk/phyre2/) (Kelley & Sternberg, 2009) to find structural homologues of bZIP14, homology was found with the GCN4 protein from S. cerevisiae, a major regulatory bZIP‐type TF involved in the amino acid deficiency response and reported to alter expression of the TCA cycle genes (Fendt et al, 2010). Conversely, reverse PSI‐BLASTP searches with the GCN4 amino acid sequence against the P. tricornutum and T. pseudonana sequences yielded the bZIP14 sequences in the top two hits for both species, suggesting either a conserved involvement or a recurrent recruitment of bZIP factors in the regulation of intermediate carbon metabolism under nutrient stress that goes well beyond the heterokont lineage.
The recent transcriptome studies cited in this work show that, although not necessarily all changes are consistent between studies, there is a very clear role for transcriptional regulation of the primary metabolism. The primary drivers for these changes are likely to be TFs, at least in part. Co‐expression studies and clustering have been instrumental here to narrow down the list of candidate TFs, but, ultimately, the throughput for a thorough analysis of candidate diatom TFs for their involvement in the regulation of a particular process remains low. Nonetheless, the arrival of gene editing technology is likely to make an impact for those TFs which are non‐essential.
Diatoms are very successful organisms that are able to outcompete most other phyla when nutrients are abundant. Their ecological success has placed them at the centre of several foodwebs as the primary producer, which makes them important for both fishery and the global carbon cycle. It is clear that both the regulation of the diurnal rhythms and the primary metabolism are regulated in a manner distinct from that of green algae. For example, while the photosynthesis, TCA and the urea cycle are ubiquitous in eukaryotes, their combination is not and the cell has likely evolved a specific regulatory network to control their interactions and functioning. The bZIP14 TF is one of the first TFs in this distinct regulatory network that has been uncovered but understanding the differences in pathway regulation is likely a key factor in explaining where this evolutionary success comes from.
Materials and Methods
Diatom culturing
All experiments used the Phaeodactylum tricornutum (Pt1) Bohlin Strain 8.6 obtained from the diatom culture collection available at Ghent University. Cells were grown in triplicate in 500 ml Erlenmeyer flasks with artificial sea water (ESAW) medium containing 7.5 mg sodium nitrate per litre and other nutrients (Berges et al, 2001). For stress treatments, the pre‐cultured cells were diluted twofold daily to maintain exponential growth. Cells were harvested by centrifugation for 30 min at 6,000× g and washed with nitrogen‐ and phosphate‐free ESAW. This starter culture was split into equal parts and used to inoculate ESAW with and without added nitrogen. Growth was monitored in triplicate by OD measurements at 405 nm. The diurnal experiments were performed in triplicate in Algem photobioreactors (Algenuity, UK), with the optional light filter screen to obtain gradual light increases and decreases. Temperature was kept constant at 21°C, the photoperiod was set to 12:12 with a peak intensity of 150 μM, and the light profile was set to sunlight. Cultures were agitated at a constant 120 rpm.
Flow cytometry analysis
Two‐ml aliquots were taken from the cell culture in triplicate and subsequently centrifuged at 6,000× g for 2 min. The supernatant was decanted and the cells resuspended in 70% ethanol and stored at 4°C until analysis. Prior to DNA staining with 4′,6‐diamidino‐2‐phenylindole (DAPI) for 15 min at a final concentration of 1 ng/ml, cells were pelleted as described above and washed twice with phosphate‐buffered saline (PBS). Flow cytometry analysis was performed on a Partec CyFlow ML using the Flomax software tool (Partec). A minimum of 104 cells were processed for each replicate.
Metabolite profiling and label accumulation analysis
Lipids were analysed with a one‐step extraction/methylation procedure in a single replicate. Dried biomass was incubated for 1 h at 100°C with hexane, methanolic HCl, and methanol in a 1:2:2 ratio. Methanolic HCl was prepared by the addition of acetyl chloride. Fatty acid esters were collected from the organic phase after addition of one volume of hexane and water.
Soluble glucans were extracted as described (Granum & Myklestad, 2002). Briefly, cells were harvested in triplicate by centrifugation, and cell pellets were extracted using 0.05 M of H2SO4 by incubating 10 min at 60°C. Debris was pelleted by centrifugation and the extract was evaporated under vacuum. Carbohydrate content was measured using the phenol‐sulphuric acid method (DuBois et al, 1956).
Gas chromatography‐mass spectrometry (GC‐MS)‐based metabolite profiling was conducted with six biological replicates as described (Obata et al, 2013) with some modifications. Cells were collected onto a filter, transferred to 1.5 ml Eppendorf tubes to gain an OD600 value of around 2.0 and snap frozen. Metabolites were extracted in 1 ml of 90% (v/v) methanol‐containing 0.1 μg/ml palatinose as an internal standard by vortexing for 10 s, sonication for 1 min in ice‐cold water, and incubation for 1 h at 4°C with shaking. After removing cell debris by centrifugation, 900 μl of supernatant was dried, derivatized by methoxyamination and trimethylsilylation, and analysed by GC‐MS. Relative levels of a metabolite were calculated by normalizing the peak signal intensity (i.e. ion count) of a representative fragment from a metabolite by that of palatinose and the OD600 value. The parameters used for annotation are listed in Appendix Table S2.
For label accumulation analysis, cells were grown under control and nitrogen starvation regimes for 20 h and resuspended in fresh medium to gain an OD600 value of around 1.0 following centrifugation. An aliquot of 2.5 ml culture was fed with 13C2‐sodium acetate (Campro scientific, Berlin, Germany) to gain a 1 mM final concentration. Following 0, 10, 30, 60, and 120 min of incubation in the same growth condition as the preculture, cells were harvested in six replicates and subjected to GC‐MS analysis. The absolute amount of citrate was calculated with a calibration curve obtained from the synthetic compound with known amounts. Atom per cent 13C enrichment in a specific fragment (m/z = 273) was calculated following correction of signal intensity for naturally abundant isotopes by CORRECTOR software (Huege et al, 2014). Fractional 13C enrichment was calculated by multiplying atom per cent enrichment with the absolute amount of citrate. Label redistribution was calculated by dividing the accumulation of fractional label during a certain time period.
Expression profiling
For each condition and time point, cells from three biological repeats were captured and RNA extraction and RNA‐Seq analysis were conducted as described by Matthijs et al (2016). Here, additional visualization of the data was performed using the MapMan program (Usadel et al, 2009). Initial mapping was performed with the Mercator webserver (Lohse et al, 2014) and manually refined using DiatomCyc data (www.diatomcyc.org) (Fabris et al, 2012). The JGI functional annotation was supplemented with BLAST2GO, Pico‐Plaza, and DiatomCyc data (Conesa et al, 2005; Fabris et al, 2012; Vandepoele et al, 2013).
qRT–PCR was also carried out as described, using PUA, VTC4, and RP3A as reference genes (Matthijs et al, 2016) with primers listed in Appendix Table S3.
Molecular cloning
Expression clones were generated as previously described (Matthijs et al, 2016). A list of primers used for cloning and qRT–PCR analysis is available in Appendix Table S3. Picking up gene sequences was performed with Primestar DNA polymerase (TaKaRa Biosciences), whereas diagnostic PCR was carried out with GoTaq (Promega).
Transformation of P. tricornutum
Transformants of P. tricornutum were generated using microparticle bombardment according to the protocol of Kroth (2007). Zeocin resistance was introduced on the paf6 plasmid, while genes of interest were cloned into pDEST‐FCP as described previously (Siaut et al, 2007). Resistant colonies were replated on selective medium and afterwards brought into liquid culture.
Recombinant protein production for protein binding microarray analysis
The bZIP14 protein was expressed in E. coli BL21‐AI (Life Technologies). The full‐length ORF of bZIP14 was Gateway‐recombined into pDEST‐HisMBP, which resulted in an N‐terminal fusion product with the His tag and the Maltose Binding Protein (Nallamsetty et al, 2005). Cells were grown to an OD600 of 0.4–0.8 and induced with 0.4 mM IPTG and 0.2% arabinose. After induction, cells were transferred to 21°C and incubated for 4 h. Protein expression was checked by SDS–PAGE on Coomassie‐stained 4–15% Mini Protean TGX precast SDS–PAGE gels (Bio‐Rad). Cells from a 25‐ml induced culture were pelleted and flash frozen for further incubation with the protein binding microarray with soluble extracts for the identification of DNA‐binding specificities, as described (Godoy et al, 2011). Briefly, cells were resuspended in 1 ml 1× binding buffer prior to the DNA binding assay on an nPBM11 design array containing 167,773 different oligonucleotide probes. Synthesis of double‐stranded microarray, protein incubation and immunological detection of DNA–protein complexes were performed as described (Godoy et al, 2011). DNA microarray was scanned in a DNA Microarray Scanner at 2‐μm resolution and quantified with Feature Extraction 9.0 software (Agilent Technologies). Normalization of probe intensities and calculation of the enrichment scores (E‐scores) of all the possible 8‐mers were carried out with the PBM Analysis Suite (Berger & Bulyk, 2009). 8‐mer motifs with E‐score higher than 0.45 (considered as bound with high affinity) were grouped into two different sets, corresponding to motif 1 and motif 2, and aligned to obtain their corresponding positional weight matrixes and logos, using enoLOGOS (http://www.benoslab.pitt.edu/cgi-bin/enologos/enologos.cgi).
Promoter regions (1 kb upstream the ATG codon) were extracted from the P. tricornutum genome sequence (version 2) and scanned for the presence of motifs 1, 2, and 3 using the DNA‐Pattern tool in RSAT (Medina‐Rivera et al, 2015). For the analysis of random promoters, ten complete sets of randomized sequences with identical number, length, and GC content as the “promoter” set were generated with the Random Sequence Tool in RSAT, scanned as described above and averaged.
Y1H analysis
Y1H was performed as described and using pDEST22‐bZIP14 transformed into yeast strain YM4271 (Deplancke et al, 2006).
Construction of phylogenetic trees
The consensus coding sequences of nine diatoms were downloaded from the CAMERA MMETSP website (http://marinemicroeukaryotes.org/) and used to construct a local BLAST database. The tBLASTN program was used to find homologous sequences, using only the highest scoring hit for each sequence. For tree construction, the default method was chosen on phylogeny.fr (Dereeper et al, 2008). Briefly, alignment was performed using MUSCLE 3.7 set at highest accuracy. Poorly aligned regions and gaps were removed using Gblocks v0.91b by eliminating all unconserved positions longer than eight amino acids with a minimum remaining block length of ten, not allowing any gaps in the final alignment and ensuring at least 85% of the sequences present in any flanking region. The maximum‐likelihood method was used as implemented in the PhyML program v3.0 aRLT, using the WAG substitution model assuming an estimated proportion of invariant sites and four gamma‐distributed rate categories with an estimated parameter of 1.293. Branch reliability was tested using the aLRT test. Graphics were generated with TreeDyn v198.3.
Data deposition
The raw RNA‐Seq reads reported in this paper have been submitted to the NCBI Short Read Archive with accession number PRJEB11970.
Author contributions
MM, IF, RS, ARF, WV, and AG conceived the study and designed experiments. MM, MF, TO, IF, and JMF‐Z performed experiments. MM, TO, JMFZ, IF, RS, ARF, and AG analysed experiments. MM, ARF, and AG wrote the manuscript with support from all authors.
Conflict of interest
The authors declare that they have no conflict of interest.
Supporting information
Appendix
Dataset EV1
Review Process File
Acknowledgements
We thank Gino Baart for helpful discussions, Sophie Carbonelle, Rebecca De Clercq, Robin Vanden Bossche, Eline Ryckebosch, Gavin Lowe, Thomas Butler, and Romina Termote‐Verhalle for excellent technical assistance and Annick Bleys for help in preparing the manuscript. This work was supported by funding from the Agency for Innovation by Science and Technology in Flanders (“Strategisch Basisonderzoek” grant no. 80031 and by a predoctoral fellowship to MM), the Short‐Term Scientific Missions (STSM) programme from the European Union COST Action FA1006‐PlantEngine (to MM), and by the Max Planck Society (to ARF).
The EMBO Journal (2017) 36: 1559–1576
References
- Abida H, Ruchaud S, Rios L, Humeau A, Probert I, De Vargas C, Bach S, Bowler C (2013) Bioprospecting marine plankton. Mar Drugs 11: 4594–4611 [DOI] [PMC free article] [PubMed] [Google Scholar]
- Alipanah L, Rohloff J, Winge P, Bones AM, Brembu T (2015) Whole‐cell response to nitrogen deprivation in the diatom Phaeodactylum tricornutum . J Exp Bot 66: 6281–6296 [DOI] [PMC free article] [PubMed] [Google Scholar]
- Allen AE, Dupont CL, Obornik M, Horák A, Nunes‐Nesi A, McCrow JP, Zheng H, Johnson DA, Hu H, Fernie AR, Bowler C (2011) Evolution and metabolic significance of the urea cycle in photosynthetic diatoms. Nature 473: 203–207 [DOI] [PubMed] [Google Scholar]
- Araújo WL, Martins AO, Fernie AR, Tohge T (2014) 2‐Oxoglutarate: linking TCA cycle function with amino acid, glucosinolate, flavonoid, alkaloid, and gibberellin biosynthesis. Front Plant Sci 5: 552 [DOI] [PMC free article] [PubMed] [Google Scholar]
- Armbrust EV, Berges JA, Bowler C, Green BR, Martinez D, Putnam NH, Zhou S, Allen AE, Apt KE, Bechner M, Brzezinski MA, Chaal BK, Chiovitti A, Davis AK, Demarest MS, Detter JC, Glavina T, Goodstein D, Hadi MZ, Hellsten U et al (2004) The genome of the diatom Thalassiosira pseudonana: ecology, evolution, and metabolism. Science 306: 79–86 [DOI] [PubMed] [Google Scholar]
- Armbrust EV (2009) The life of diatoms in the world's oceans. Nature 459: 185–192 [DOI] [PubMed] [Google Scholar]
- Ashworth J, Coesel S, Lee A, Armbrust EV, Orellana MV, Baliga NS (2013) Genome‐wide diel growth state transitions in the diatom Thalassiosira pseudonana . Proc Natl Acad Sci USA 110: 7518–7523 [DOI] [PMC free article] [PubMed] [Google Scholar]
- Berger MF, Bulyk ML (2009) Universal protein‐binding microarrays for the comprehensive characterization of the DNA‐binding specificities of transcription factors. Nat Protoc 4: 393–411 [DOI] [PMC free article] [PubMed] [Google Scholar]
- Berges JA, Franklin DJ, Harrison PJ (2001) Evolution of an artificial seawater medium: improvements in enriched seawater, artificial water over the last two decades. J Phycol 37: 1138–1145 [Google Scholar]
- Bowler C, Allen AE, Badger JH, Grimwood J, Jabbari K, Kuo A, Maheswari U, Martens C, Maumus F, Otillar RP, Rayko E, Salamov A, Vandepoele K, Beszteri B, Gruber A, Heijde M, Katinka M, Mock T, Valentin K, Verret F et al (2008) The Phaeodactylum genome reveals the evolutionary history of diatom genomes. Nature 456: 239–244 [DOI] [PubMed] [Google Scholar]
- Chauton MS, Winge P, Brembu T, Vadstein O, Bones AM (2013) Gene regulation of carbon fixation, storage and utilization in the diatom Phaeodactylum tricornutum acclimated to light/dark cycles. Plant Physiol 161: 1034–1048 [DOI] [PMC free article] [PubMed] [Google Scholar]
- Chu L, Gruber A, Ast M, Schmitz‐Esser S, Altensell J, Neuhaus HE, Kroth PG, Haferkamp I (2017) Shuttling of (deoxy‐) purine nucleotides between compartments of the diatom Phaeodactylum tricornutum . New Phytol 213: 193–205 [DOI] [PubMed] [Google Scholar]
- Conesa A, Götz S, García‐Gómez JM, Terol J, Talón M, Robles M (2005) Blast2GO: a universal tool for annotation, visualization and analysis in functional genomics research. Bioinformatics 21: 3674–3676 [DOI] [PubMed] [Google Scholar]
- Corteggiani Carpinelli E, Telatin A, Vitulo N, Forcato C, D'Angelo M, Schiavon R, Vezzi A, Giacometti GM, Morosinotto T, Valle G (2014) Chromosome scale genome assembly and transcriptome profiling of Nannochloropsis gaditana in nitrogen depletion. Mol Plant 7: 323–335 [DOI] [PubMed] [Google Scholar]
- De Geyter N, Gholami A, Goormachtig S, Goossens A (2012) Transcriptional machineries in jasmonate‐elicited plant secondary metabolism. Trends Plant Sci 17: 349–359 [DOI] [PubMed] [Google Scholar]
- Deplancke B, Vermeirssen V, Arda HE, Martinez NJ, Walhout AJM (2006) Gateway‐compatible yeast one‐hybrid screens. Cold Spring Harb Protoc 2006: pdb.prot4590. [DOI] [PubMed] [Google Scholar]
- Dereeper A, Guignon V, Blanc G, Audic S, Buffet S, Chevenet F, Dufayard J‐F, Guindon S, Lefort V, Lescot M, Claverie J‐M, Gascuel O (2008) Phylogeny.fr: robust phylogenetic analysis for the non‐specialist. Nucleic Acids Res 36: W465–W469 [DOI] [PMC free article] [PubMed] [Google Scholar]
- DuBois M, Gilles KA, Hamilton JK, Rebers PA, Smith F (1956) Colorimetric method for determination of sugars and related substances. Anal Chem 28: 350–356 [Google Scholar]
- Dyhrman ST, Jenkins BD, Rynearson TA, Saito MA, Mercier ML, Alexander H, Whitney LP, Drzewianowski A, Bulygin VV, Bertrand EM, Wu Z, Benitez‐Nelson C, Heithoff A (2012) The transcriptome and proteome of the diatom Thalassiosira pseudonana reveal a diverse phosphorus stress response. PLoS ONE 7: e33768 [DOI] [PMC free article] [PubMed] [Google Scholar]
- Fabris M, Matthijs M, Rombauts S, Vyverman W, Goossens A, Baart GJE (2012) The metabolic blueprint of Phaeodactylum tricornutum reveals a eukaryotic Entner‐Doudoroff glycolytic pathway. Plant J 70: 1004–1014 [DOI] [PubMed] [Google Scholar]
- Fabris M, Matthijs M, Carbonelle S, Moses T, Pollier J, Dasseville R, Baart GJE, Vyverman W, Goossens A (2014) Tracking the sterol biosynthesis pathway of the diatom Phaeodactylum tricornutum . New Phytol 204: 521–535 [DOI] [PubMed] [Google Scholar]
- Fendt S‐M, Oliveira AP, Christen S, Picotti P, Dechant RC, Sauer U (2010) Unraveling condition‐dependent networks of transcription factors that control metabolic pathway activity in yeast. Mol Syst Biol 6: 432 [DOI] [PMC free article] [PubMed] [Google Scholar]
- Feng T‐Y, Yang Z‐K, Zheng J‐W, Xie Y, Li D‐W, Murugan SB, Yang W‐D, Liu J‐S, Li H‐Y (2015) Examination of metabolic responses to phosphorus limitation via proteomic analyses in the marine diatom Phaeodactylum tricornutum . Sci Rep 5: 10373 [DOI] [PMC free article] [PubMed] [Google Scholar]
- Fu L, Niu B, Zhu Z, Wu S, Li W (2012) CD‐HIT: accelerated for clustering the next‐generation sequencing data. Bioinformatics 28: 3150–3152 [DOI] [PMC free article] [PubMed] [Google Scholar]
- Fuchs G (2011) Alternative pathways of carbon dioxide fixation: insights into the early evolution of life? Annu Rev Microbiol 65: 631–658 [DOI] [PubMed] [Google Scholar]
- Fukushima A, Kusano M, Nakamichi N, Kobayashi M, Hayashi N, Sakakibara H, Mizuno T, Saito K (2009) Impact of clock‐associated Arabidopsis pseudo‐response regulators in metabolic coordination. Proc Natl Acad Sci USA 106: 7251–7256 [DOI] [PMC free article] [PubMed] [Google Scholar]
- Godoy M, Franco‐Zorrilla JM, Pérez‐Pérez J, Oliveros JC, Lorenzo Ó, Solano R (2011) Improved protein‐binding microarrays for the identification of DNA‐binding specificities of transcription factors. Plant J 66: 700–711 [DOI] [PubMed] [Google Scholar]
- Granum E, Myklestad SM (2002) A simple combined method for determination of β‐1,3‐glucan and cell wall polysaccharides in diatoms. Hydrobiologia 477: 155–161 [Google Scholar]
- Grouneva I, Jakob T, Wilhelm C, Goss R (2009) The regulation of xanthophyll cycle activity and of non‐photochemical fluorescence quenching by two alternative electron flows in the diatoms Phaeodactylum tricornutum and Cyclotella meneghiniana . Biochim Biophys Acta ‐ Bioenerg 1787: 929–938 [DOI] [PubMed] [Google Scholar]
- Guerra LT, Levitan O, Frada MJ, Sun JS, Falkowski PG, Dismukes GC (2013) Regulatory branch points affecting protein and lipid biosynthesis in the diatom Phaeodactylum tricornutum . Biomass Bioenerg 59: 306–315 [Google Scholar]
- Hockin NL (2011) A proteomic approach to metabolism in the diatom Thalassiosira pseudonana. University of East Anglia.
- Hockin NL, Mock T, Mulholland F, Kopriva S, Malin G (2012) The response of diatom central carbon metabolism to nitrogen starvation is different from that of green algae and higher plants. Plant Physiol 158: 299–312 [DOI] [PMC free article] [PubMed] [Google Scholar]
- Huege J, Goetze J, Dethloff F, Junker B, Kopka J (2014) Quantification of stable isotope label in metabolites via mass spectrometry. Methods Mol Biol 1056: 213–223 [DOI] [PubMed] [Google Scholar]
- Huysman MJJ, Martens C, Vandepoele K, Gillard J, Rayko E, Heijde M, Bowler C, Inzé D, Van de Peer Y, De Veylder L, Vyverman W (2010) Genome‐wide analysis of the diatom cell cycle unveils a novel type of cyclins involved in environmental signaling. Genome Biol 11: R17 [DOI] [PMC free article] [PubMed] [Google Scholar]
- Huysman MJJ, Fortunato AE, Matthijs M, Schellenberger Costa B, Vanderhaeghen R, Van den Daele H, Sachse M, Inzé D, Bowler C, Kroth PG, Wilhelm C, Falciatore A, Vyverman W, De Veylder L (2013) AUREOCHROME1a‐mediated induction of the diatom‐specific cyclin dsCYC2 controls the onset of cell division in diatoms (Phaeodactylum tricornutum). Plant Cell 25: 215–228 [DOI] [PMC free article] [PubMed] [Google Scholar]
- Jakoby M, Weisshaar B, Dröge‐Laser W, Vicente‐Carbajosa J, Tiedemann J, Kroj T, Parcy F (2002) bZIP transcription factors in Arabidopsis . Trends Plant Sci 7: 106–111 [DOI] [PubMed] [Google Scholar]
- Juergens MT, Disbrow B, Shachar‐Hill Y (2016) The relationship of triacylglycerol and starch accumulation to carbon and energy flows during nutrient deprivation in Chlamydomonas reinhardtii . Plant Physiol 171: 2445–2457 [DOI] [PMC free article] [PubMed] [Google Scholar]
- Karsenti E, Acinas SG, Bork P, Bowler C, De Vargas C, Raes J, Sullivan M, Arendt D, Benzoni F, Claverie J‐M, Follows M, Gorsky G, Hingamp P, Iudicone D, Jaillon O, Kandels‐Lewis S, Krzic U, Not F, Ogata H, Pesant S et al (2011) A holistic approach to marine eco‐systems biology. PLoS Biol 9: e1001177 [DOI] [PMC free article] [PubMed] [Google Scholar]
- Keeling PJ, Burki F, Wilcox HM, Allam B, Allen EE, Amaral‐Zettler LA, Armbrust EV, Archibald JM, Bharti AK, Bell CJ, Beszteri B, Bidle KD, Cameron CT, Campbell L, Caron DA, Cattolico RA, Collier JL, Coyne K, Davy SK, Deschamps P et al (2014) The Marine Microbial Eukaryote Transcriptome Sequencing Project (MMETSP): Illuminating the functional diversity of eukaryotic life in the oceans through transcriptome sequencing. PLoS Biol 12: e1001889 [DOI] [PMC free article] [PubMed] [Google Scholar]
- Kelley LA, Sternberg MJE (2009) Protein structure prediction on the Web: a case study using the Phyre server. Nat Protoc 4: 363–371 [DOI] [PubMed] [Google Scholar]
- Kroth PG (2007) Genetic transformation: a tool to study protein targeting in diatoms. Methods Mol Biol 390: 257–267 [PubMed] [Google Scholar]
- Lee CP, Eubel H, Millar AH (2010) Diurnal changes in mitochondrial function reveal daily optimization of light and dark respiratory metabolism in Arabidopsis . Mol Cell Proteomics 9: 2125–2139 [DOI] [PMC free article] [PubMed] [Google Scholar]
- Levitan O, Dinamarca J, Zelzion E, Lun DS, Guerra LT, Kim MK, Kim J, Van Mooy BAS, Bhattacharya D, Falkowski PG (2015) Remodeling of intermediate metabolism in the diatom Phaeodactylum tricornutum under nitrogen stress. Proc Natl Acad Sci USA 112: 412–417 [DOI] [PMC free article] [PubMed] [Google Scholar]
- Li W, Godzik A (2006) Cd‐hit: a fast program for clustering and comparing large sets of protein or nucleotide sequences. Bioinformatics 22: 1658–1659 [DOI] [PubMed] [Google Scholar]
- Liu Z, Butow RA (1999) A transcriptional switch in the expression of yeast tricarboxylic acid cycle genes in response to a reduction or loss of respiratory function. Mol Cell Biol 19: 6720–6728 [DOI] [PMC free article] [PubMed] [Google Scholar]
- Lohse M, Nagel A, Herter T, May P, Schroda M, Zrenner R, Tohge T, Fernie AR, Stitt M, Usadel B (2014) Mercator: a fast and simple web server for genome scale functional annotation of plant sequence data. Plant Cell Environ 37: 1250–1258 [DOI] [PubMed] [Google Scholar]
- Longworth J, Wu D, Huete‐Ortega M, Wright PC, Vaidyanathan S (2016) Proteome response of Phaeodactylum tricornutum, during lipid accumulation induced by nitrogen depletion. Algal Res 18: 213–224 [DOI] [PMC free article] [PubMed] [Google Scholar]
- Mann JE, Myers J (1968) Photosynthetic enhancement in the diatom Phaeodactylum tricornutum . Plant Physiol 43: 1991–1995 [DOI] [PMC free article] [PubMed] [Google Scholar]
- Massonnet C, Vile D, Fabre J, Hannah MA, Caldana C, Lisec J, Beemster GTS, Meyer RC, Messerli G, Gronlund JT, Perkovic J, Wigmore E, May S, Bevan MW, Meyer C, Rubio‐Díaz S, Weigel D, Micol JL, Buchanan‐Wollaston V, Fiorani F et al (2010) Probing the reproducibility of leaf growth and molecular phenotypes: a comparison of three Arabidopsis accessions cultivated in ten laboratories. Plant Physiol 152: 2142–2157 [DOI] [PMC free article] [PubMed] [Google Scholar]
- Matthijs M, Fabris M, Broos S, Vyverman W, Goossens A (2016) Profiling of the early nitrogen stress response in the diatom Phaeodactylum tricornutum reveals a novel family of RING‐domain transcription factors. Plant Physiol 170: 489–498 [DOI] [PMC free article] [PubMed] [Google Scholar]
- Medina‐Rivera A, Defrance M, Sand O, Herrmann C, Castro‐Mondragon JA, Delerce J, Jaeger S, Blanchet C, Vincens P, Caron C, Staines DM, Contreras‐Moreira B, Artufel M, Charbonnier‐Khamvongsa L, Hernandez C, Thieffry D, Thomas‐Chollier M, van Helden J (2015) RSAT 2015: regulatory sequence analysis tools. Nucleic Acids Res 43: W50–W56 [DOI] [PMC free article] [PubMed] [Google Scholar]
- Michaeli S, Fait A, Lagor K, Nunes‐Nesi A, Grillich N, Yellin A, Bar D, Khan M, Fernie AR, Turano FJ, Fromm H (2011) A mitochondrial GABA permease connects the GABA shunt and the TCA cycle, and is essential for normal carbon metabolism. Plant J 67: 485–498 [DOI] [PubMed] [Google Scholar]
- Michaeli S, Fromm H (2015) Closing the loop on the GABA shunt in plants: are GABA metabolism and signaling entwined? Front Plant Sci 6: 419 [DOI] [PMC free article] [PubMed] [Google Scholar]
- Mimouni V, Ulmann L, Pasquet V, Mathieu M, Picot L, Bougaran G, Cadoret J‐P, Morant‐Manceau A, Schoefs B (2012) The potential of microalgae for the production of bioactive molecules of pharmaceutical interest. Curr Pharm Biotechno 13: 2733–2750 [DOI] [PubMed] [Google Scholar]
- Mock T, Otillar RP, Strauss J, McMullan M, Paajanen P, Schmutz J, Salamov A, Sanges R, Toseland A, Ward BJ, Allen AE, Dupont CL, Frickenhaus S, Maumus F, Veluchamy A, Wu T, Barry KW, Falciatore A, Ferrante MI, Fortunato AE et al (2017) Evolutionary genomics of the cold‐adapted diatom Fragilariopsis cylindrus . Nature 541: 536–540 [DOI] [PubMed] [Google Scholar]
- Moog D, Rensing SA, Archibald JM, Maier UG, Ullrich KK (2015) Localization and evolution of putative triose phosphate translocators in the diatom Phaeodactylum tricornutum . Genome Biol Evol 7: 2955–2969 [DOI] [PMC free article] [PubMed] [Google Scholar]
- Mühlroth A, Li K, Røkke G, Winge P, Olsen Y, Hohmann‐Marriott MF, Vadstein O, Bones AM (2013) Pathways of lipid metabolism in marine algae, co‐expression network, bottlenecks and candidate genes for enhanced production of EPA and DHA in species of Chromista. Mar Drugs 11: 4662–4697 [DOI] [PMC free article] [PubMed] [Google Scholar]
- Nakamichi N, Fukushima A, Kusano M, Sakakibara H, Mizuno T, Saito K (2009) Linkage between circadian clock and tricarboxylic acid cycle in Arabidopsis . Plant Signal Behav 4: 660–662 [DOI] [PMC free article] [PubMed] [Google Scholar]
- Nallamsetty S, Austin BP, Penrose KJ, Waugh DS (2005) Gateway vectors for the production of combinatorially‐tagged His6‐MBP fusion proteins in the cytoplasm and periplasm of Escherichia coli . Protein Sci 14: 2964–2971 [DOI] [PMC free article] [PubMed] [Google Scholar]
- Obata T, Fernie AR, Nunes‐Nesi A (2013) The central carbon and energy metabolism of marine diatoms. Metabolites 3: 325–346 [DOI] [PMC free article] [PubMed] [Google Scholar]
- Ohno N, Inoue T, Yamashiki R, Nakajima K, Kitahara Y, Ishibashi M, Matsuda Y (2012) CO2‐cAMP‐responsive cis‐elements targeted by a transcription factor with CREB/ATF‐like basic zipper domain in the marine diatom Phaeodactylum tricornutum . Plant Physiol 158: 499–513 [DOI] [PMC free article] [PubMed] [Google Scholar]
- Poliner E, Panchy N, Newton L, Wu G, Lapinsky A, Bullard B, Zienkiewicz A, Benning C, Shiu S‐H, Farré EM (2015) Transcriptional coordination of physiological responses in Nannochloropsis oceanica CCMP1779 under light/dark cycles. Plant J 83: 1097–1113 [DOI] [PubMed] [Google Scholar]
- Rayko E, Maumus F, Maheswari U, Jabbari K, Bowler C (2010) Transcription factor families inferred from genome sequences of photosynthetic stramenopiles. New Phytol 188: 52–66 [DOI] [PubMed] [Google Scholar]
- Schmittgen TD, Livak KJ (2008) Analyzing real‐time PCR data by the comparative C T method. Nat Protoc 3: 1101–1108 [DOI] [PubMed] [Google Scholar]
- Schmollinger S, Mühlhaus T, Boyle NR, Blaby IK, Casero D, Mettler T, Moseley JL, Kropat J, Sommer F, Strenkert D, Hemme D, Pellegrini M, Grossman AR, Stitt M, Schroda M, Merchant SS (2014) Nitrogen‐sparing mechanisms in Chlamydomonas affect the transcriptome, the proteome, and photosynthetic metabolism. Plant Cell 26: 1410–1435 [DOI] [PMC free article] [PubMed] [Google Scholar]
- Sheehan J, Dunahay T, Benemann J, Roessler P (1998) A look back at the U.S. Department of Energy's aquatic species program: biodiesel from algae. National Renewable Energy Laboratory Report NREL/TP‐580‐24190
- Siaut M, Heijde M, Mangogna M, Montsant A, Coesel S, Allen A, Manfredonia A, Falciatore A, Bowler C (2007) Molecular toolbox for studying diatom biology in Phaeodactylum tricornutum . Gene 406: 23–35 [DOI] [PubMed] [Google Scholar]
- Smith SR, Gillard JTF, Kustka AB, McCrow JP, Badger JH, Zheng H, New AM, Dupont CL, Obata T, Fernie AR, Allen AE (2016) Transcriptional orchestration of the global cellular response of a model pennate diatom to diel light cycling under iron limitation. PLoS Genet 12: e1006490 [DOI] [PMC free article] [PubMed] [Google Scholar]
- Steinhauser D, Fernie AR, Araújo WL (2012) Unusual cyanobacterial TCA cycles: not broken just different. Trends Plant Sci 17: 503–509 [DOI] [PubMed] [Google Scholar]
- Sunagawa S, Coelho LP, Chaffron S, Kultima JR, Labadie K, Salazar G, Djahanschiri B, Zeller G, Mende DR, Alberti A, Cornejo‐Castillo FM, Costea PI, Cruaud C, d'Ovidio F, Engelen S, Ferrera I, Gasol JM, Guidi L, Hildebrand F, Kokoszka F et al (2015) Structure and function of the global ocean microbiome. Science 348: 1261359 [DOI] [PubMed] [Google Scholar]
- Tanaka T, Maeda Y, Veluchamy A, Tanaka M, Abida H, Marechal E, Bowler C, Muto M, Sunaga Y, Tanaka M, Yoshino T, Taniguchi T, Fukuda Y, Nemoto M, Matsumoto M, Wong PS, Aburatani S, Fujibuchi W (2015) Oil accumulation by the oleaginous diatom Fistulifera solaris as revealed by the genome and transcriptome. Plant Cell 27: 162–176 [DOI] [PMC free article] [PubMed] [Google Scholar]
- Tirichine L, Bowler C (2011) Decoding algal genomes: tracing back the history of photosynthetic life on Earth. Plant J 66: 45–57 [DOI] [PubMed] [Google Scholar]
- Usadel B, Poree F, Nagel A, Lohse M, Czedik‐Eysenberg A, Stitt M (2009) A guide to using MapMan to visualize and compare Omics data in plants: a case study in the crop species, Maize. Plant Cell Environ 32: 1211–1129 [DOI] [PubMed] [Google Scholar]
- Valenzuela J, Mazurie A, Carlson RP, Gerlach R, Cooksey KE, Peyton BM, Fields MW (2012) Potential role of multiple carbon fixation pathways during lipid accumulation in Phaeodactylum tricornutum . Biotechnol Biofuels 5: 40 [DOI] [PMC free article] [PubMed] [Google Scholar]
- Vandepoele K, Van Bel M, Richard G, Van Landeghem S, Verhelst B, Moreau H, Van de Peer Y, Grimsley N, Piganeau G (2013) pico‐PLAZA, a genome database of microbial photosynthetic eukaryotes. Environ Microbiol 15: 2147–2153 [DOI] [PubMed] [Google Scholar]
- Van Oostende N, Dunne JP, Fawcett SE, Ward BB (2015) Phytoplankton succession explains size‐partitioning of new production following upwelling‐induced blooms. J Mar Syst 148: 14–25 [Google Scholar]
- Veuger B, van Oevelen D (2011) Long‐term pigment dynamics and diatom survival in dark sediment. Limnol Oceanogr 56: 1065–1074 [Google Scholar]
- Yang Z‐K, Niu Y‐F, Ma Y‐H, Xue J, Zhang M‐H, Yang W‐D, Liu J‐S, Lu S‐H, Guan Y, Li H‐Y (2013) Molecular and cellular mechanisms of neutral lipid accumulation in diatom following nitrogen deprivation. Biotechnol Biofuels 6: 67 [DOI] [PMC free article] [PubMed] [Google Scholar]
- Yang Z‐K, Zheng J‐W, Niu Y‐F, Yang W‐D, Liu J‐S, Li H‐Y (2014) Systems‐level analysis of the metabolic responses of the diatom Phaeodactylum tricornutum to phosphorus stress. Environ Microbiol 16: 1793–1807 [DOI] [PubMed] [Google Scholar]
Associated Data
This section collects any data citations, data availability statements, or supplementary materials included in this article.
Supplementary Materials
Appendix
Dataset EV1
Review Process File