Abstract
Oligomeric amyloid‐β (Aβ) 1‐42 disrupts synaptic function at an early stage of Alzheimer's disease (AD). Multiple posttranslational modifications of Aβ have been identified, among which N‐terminally truncated forms are the most abundant. It is not clear, however, whether modified species can induce synaptic dysfunction on their own and how altered biochemical properties can contribute to the synaptotoxic mechanisms. Here, we show that a prominent isoform, pyroglutamated Aβ3(pE)‐42, induces synaptic dysfunction to a similar extent like Aβ1‐42 but by clearly different mechanisms. In contrast to Aβ1‐42, Aβ3(pE)‐42 does not directly associate with synaptic membranes or the prion protein but is instead taken up by astrocytes and potently induces glial release of the proinflammatory cytokine TNFα. Moreover, Aβ3(pE)‐42‐induced synaptic dysfunction is not related to NMDAR signalling and Aβ3(pE)‐42‐induced impairment of synaptic plasticity cannot be rescued by D1‐agonists. Collectively, the data point to a scenario where neuroinflammatory processes together with direct synaptotoxic effects are caused by posttranslational modification of soluble oligomeric Aβ and contribute synergistically to the onset of synaptic dysfunction in AD.
Keywords: amyloid‐β1‐42, amyloid‐β3(pE)‐42, Jacob, N‐methyl‐d‐aspartate‐receptor, TNFα
Subject Categories: Molecular Biology of Disease; Neuroscience; Post-translational Modifications, Proteolysis & Proteomics
Introduction
Numerous studies indicate that soluble Aβ oligomers play a key role in the onset of synaptic dysfunction in early stage AD 1, 2. However, the molecular identity of the Aβ peptides that cause synapse loss and impair synaptic plasticity is still largely unclear. Multiple posttranslationally modified (PTM) Aβ peptides were found in brains of AD patients 3, 4, 5 and among these, N‐terminally modified peptides are the most prominent species 3, 6, 7. In particular, the amino‐terminally truncated, pyroglutamated form of Aβ (Aβ3(pE)‐42) is abundant 8, 9, 10 and was shown to seed highly toxic co‐oligomers with conventional Aβ1‐42 11, 12, 13. Aβ3(pE)‐42 exhibits distinct structural features that might carry specific neurotoxic activity 9, 11, 13, 14, 15.
Although a plethora of different Aβ1‐42 targets have been identified, relatively little is known about target interactions of PTM Aβ peptides and molecular mechanisms of their action. A pressing matter is whether PTM Aβ species can induce synaptic dysfunction on their own and if yes whether they induce neuronal pathology by different means. One influential view of the molecular mechanism that underlies synaptic dysfunction induced by full‐length Aβ1‐42 focuses on N‐methyl‐d‐aspartate‐receptor (NMDAR) 16, 17, 18, 19 and metabotropic glutamate receptor‐5 (mGlu5) signalling 20, 21, 22. This signalling is likely modulated through an association of Aβ oligomers to the prion protein (PrP) 23, 24, 25. Binding of Aβ1‐42 to the extracellular domain of the PrP results in abnormal activation of Fyn tyrosine kinase, a signalling event that has been shown to play an important role in Aβ‐induced synaptic pathology 23, 24, 25. Aβ1‐42‐PrP‐dependent Fyn activation is mediated by mGlu5‐activation 26, and Aβ1‐42‐induced synaptic dysfunction most likely depends upon a functional and possibly also physical interaction of NMDAR, PrP and mGlu5.
In addition, inflammatory processes are thought to further aggravate synaptic loss already at the early stages of sporadic AD. Numerous cytokines such as TNFα, IL‐1β or IL‐6 were reported to be upregulated in AD brain and could potentially aggravate disease progression 27, 28, 29. In particular, TNFα was shown to influence Aβ production, increase oligomer‐induced apoptosis and mediate Aβ‐induced long‐term potentiation (LTP) 28. To address the question whether PTM Aβ species might contribute to early synaptic dysfunction by divergent mechanisms, we utilised the conceptual framework outlined above.
Results
Characterisation of Aβ oligomers
Aβ monomers, oligomers and fibrils have different effects on neuronal function, and mainly higher‐order oligomers are synaptotoxic and induce early synaptic dysfunction in AD 1, 2, 3. Aβ1‐42 and Aβ3(pE)‐42 oligomer production was monitored and controlled by different means. SDS–PAGE (Fig EV1A) followed by immunodetection with antibodies detecting the N‐terminus of Aβ oligomers (82E1 for Aβ1‐42 and Abeta‐pE3 for Aβ3(pE)‐42) indicated that both preparations resulted in a spectrum of oligomeric Aβ species, from low (2–4mers) to high‐n oligomers (12–48mers) in accordance with other studies 2, a result that was confirmed by size‐exclusion chromatography and subsequent ELISA quantification (Fig EV1E). A similar pattern with a slight shift towards higher molecular weight forms was observed for Aβ3(pE)‐42 (Fig EV1A). Transmission electron microscopy (TEM) of both preparations revealed globular, oligomeric structures of various sizes. In both preparations, no fibrillar or protofibrillar species were observed (Fig EV1B). The preparation was further characterised by dynamic light scattering (DLS), showing that both Aβ1‐42 and Aβ3(pE)‐42 oligomers form a broad range of species, distinct from monomers and fibrils (Fig EV1C). Furthermore, 8‐anilino‐1‐naphthalenesulfonic acid (ANS) fluorescence spectroscopy revealed conformational differences between oligomeric, monomeric and fibrillar preparations for both species (Fig EV1D). Aβ preparations were also separated by native PAGE which revealed a similar distribution pattern of both species (Fig EV1F). Thus, both preparations yielded comparable larger oligomers that are considered to be most synaptotoxic in the onset of AD. We also used Aβ1‐42 and Aβ3(pE)‐42 fibril preparations as a control in some experiments outlined below as well as a control for DLS and ANS studies (Fig EV1C and D). Fibril production was additionally monitored by a Thioflavin T (ThT) assay (Fig EV2A).
Figure EV1. Characterisation of oligomeric preparation.
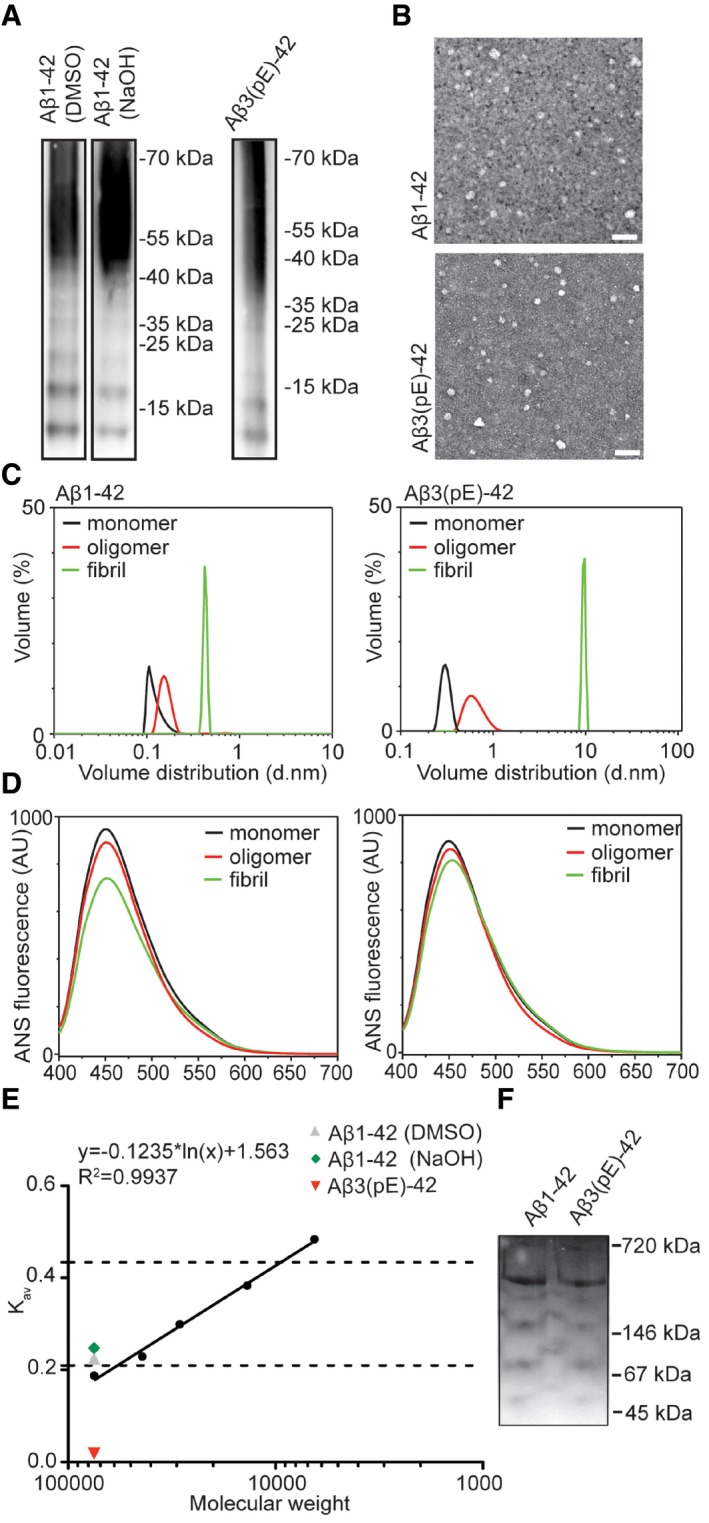
- SDS–PAGE revealed a similar distribution of Aβ3(pE)‐42 and Aβ1‐42 species prepared with two different protocols with low (from 12 to 65 kDa) and higher molecular weight oligomers. The oligomerisation method does not significantly influence the distribution of Aβ1‐42.
- Images from TEM revealed globular but not fibrillar structures for both peptide preparation. Scale bar, 50 nm.
- Volume distribution of monomeric (black line), oligomeric (red line) and fibrillar (green line) preparations measured by dynamic light scattering shows distinct size distributions for all preparations.
- ANS spectroscopy measurements revealed different surface hydrophobicity for monomeric (black line), oligomeric (red line) and fibrillar (green line) preparations of both peptides.
- Graph representing gel filtration column calibration and the highest amount of eluted oligomers detected by an ELISA assay. Dashed lines indicate low‐n oligomer range (12–65 kDa).
- Image of native PAGE gel reveals that both preparations have similar migration pattern.
Source data are available online for this figure.
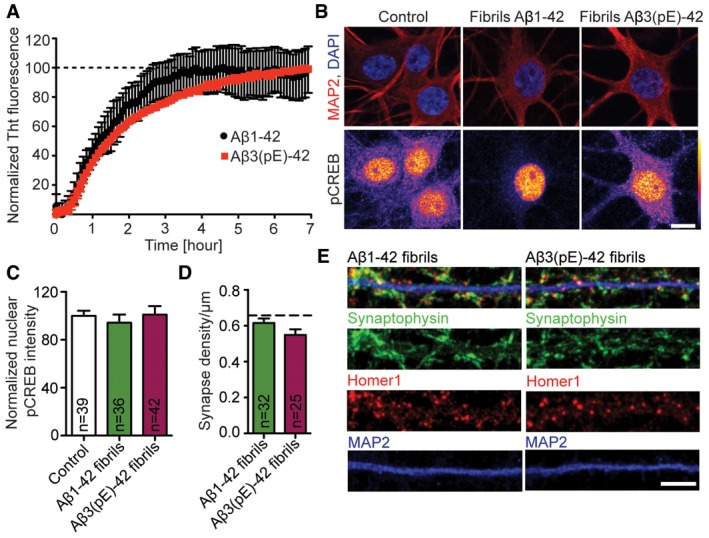
Figure EV2. Fibrilar forms of Aβ1‐42 or Aβ3(pE)‐42 do not cause significant synapse loss and CREB shut‐off.
-
AGraph showing fibrillisation kinetics of Aβ1‐42 (n = 3) and Aβ3(pE)‐42 (n = 2). The fluorescence increases over time until reaching a plateau (dashed line) indicating formation of stable fibrils used in further experiments.
-
B, CTreatment with Aβ1‐42 fibrils and Aβ3(pE)‐42 fibrils do not alter pCREB nuclear levels. (B) Confocal images averaged from two sections of the nucleus of DIV18, primary, hippocampal neurons stained for MAP2, DAPI and pCREB. Original pixel intensities from 0 to 255 are represented as a gradient lookup table. Scale bar, 10 μm. (C) Bar graph representing mean nuclear pCREB staining intensity. n corresponds to the number of nuclei from different neurons analysed from at least four independent coverslips and at least two independent cell cultures.
-
D, ENeither Aβ1‐42 nor Aβ3(pE)‐42 fibrils cause synaptic loss. (D) Bar plot representing synaptic density of DIV20 neurons stained for Synaptophysin, Homer1 and MAP2 after Aβ1‐42 and Aβ3(pE)‐42 treatment compared to not treated control, represented in Fig 1B. Dashed line indicates mean control synapse density from Fig 1B. n corresponds to the number of separate dendritic segments on different neurons analysed from at least three independent coverslips and at least two independent cell cultures. (E) Representative confocal images of dendrites used for quantification. Scale bar, 5 μm.
Aβ1‐42 and Aβ3(pE)‐42 oligomers induce both synapse loss and dysfunction
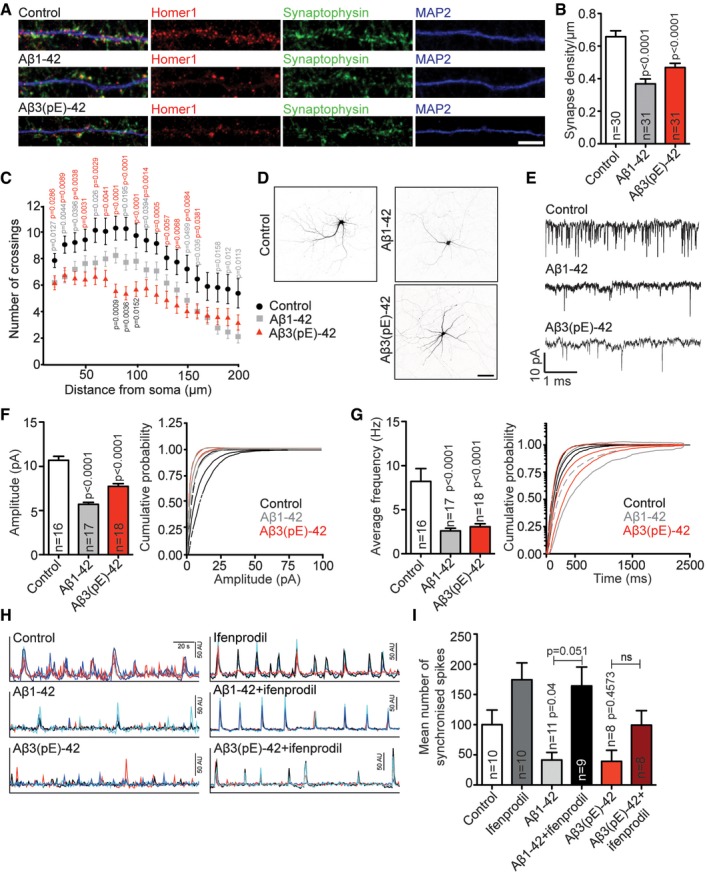
Synapse loss in the hippocampus is an early neuropathological hallmark in AD that strongly correlates with cognitive impairment. In the first set of experiments, we wanted to address whether application of both, oligomeric Aβ1‐42 and Aβ3(pE)‐42, to hippocampal primary neurons impacts in a comparable manner on synapse number. We indeed found that treatment of either Aβ oligomer species at a concentration of 500 nM applied to DIV17 neurons for 3 days resulted in a reduced number of synapses (Fig 1A and B). Fibrils of both Aβ species had no effect on synapse number as compared to non‐treated cultures (Fig EV2D and E). Interestingly, both Aβ oligomers also induced a clear reduction in dendrite complexity as evidenced by Sholl analysis (Fig 1C and D), and in this case, the effect of Aβ3(pE)‐42 was more pronounced than those of Aβ1‐42 (Fig 1C and D).
Figure 1. Effects of Aβ oligomers on synapse density, dendritic tree complexity, mEPSC amplitude and frequency, and neuronal network activity.
-
ABoth Aβ1‐42 and Aβ3(pE)‐42 cause synaptic loss. Representative confocal images of dendrites used for quantification. Scale bar, 5 μm.
-
BBar plot representing synaptic density of DIV20 neurons stained for Homer1, Synaptophysin and MAP2 after treatment with 500 nM Aβ1‐42 or Aβ3(pE)‐42 for 3 days compared to non‐treated controls. n corresponds to the number of separate dendritic segments on different neurons analysed from at least three independent coverslips and at least two independent cell cultures.
-
CBoth Aβ1‐42 and Aβ3(pE)‐42 cause simplification of the dendritic tree. The graph represents the results of a Sholl analysis of GFP‐transfected neurons treated with Aβ1‐42 (n = 23) or Aβ3(pE)‐42 (n = 25) and corresponding controls (n = 25). n corresponds to the number of neurons analysed from at least three independent coverslips and at least three independent cell cultures.
-
DImages of representative neurons. Scale bar, 100 μm.
-
EAβ1‐42 and Aβ3(pE)‐42 cause a decrease in mEPSC amplitude and frequency. Example traces of mEPSCs in neurons treated with Aβ1‐42 and Aβ3(pE)‐42.
-
F, GCumulative probability plot and bar graph illustrating effects of Aβ1‐42 and Aβ3(pE)‐42 treatment on mean amplitude (F) or frequency of mEPSCs (G). n corresponds to the number of neurons analysed from at least four independent cell cultures.
-
HExample traces from Ca2+ imaging. Four to six cells from the same scan are depicted with different colours.
-
ITreatment for 3 days with Aβ1‐42 or Aβ3(pE)‐42 caused a decrease in the frequency of synchronised calcium waves. Co‐application of ifenprodil rescues the phenotype caused by Aβ1‐42 but not those of Aβ3(pE)‐42 application. n corresponds to the number of independent coverslips from at least four independent cell cultures.
Additionally, acute application of Aβ3(pE)‐42 like Aβ1‐42 significantly reduced the mEPSC frequency and amplitude of hippocampal primary neurons patched in the whole‐cell mode (Fig 1E–G), indicating that both oligomeric Aβ species induce acute synaptic dysfunction and depression to a comparable extent. Similar results were obtained when we looked at spontaneous Ca2+ spikes with Ca2+ imaging in hippocampal primary neurons after bath application of both oligomers for 3 days. Aβ1‐42 and Aβ3(pE)‐42 both reduced the number of synchronous Ca2+ spikes as evidenced by Fluo‐4 AM Ca2+ imaging (Fig 1H and I). Thus, both oligomers also suppress neuronal network activity (Fig 1H and I).
Oligomeric Aβ1‐42 and Aβ3(pE)‐42 induce CREB shut‐off and nuclear accumulation of Jacob
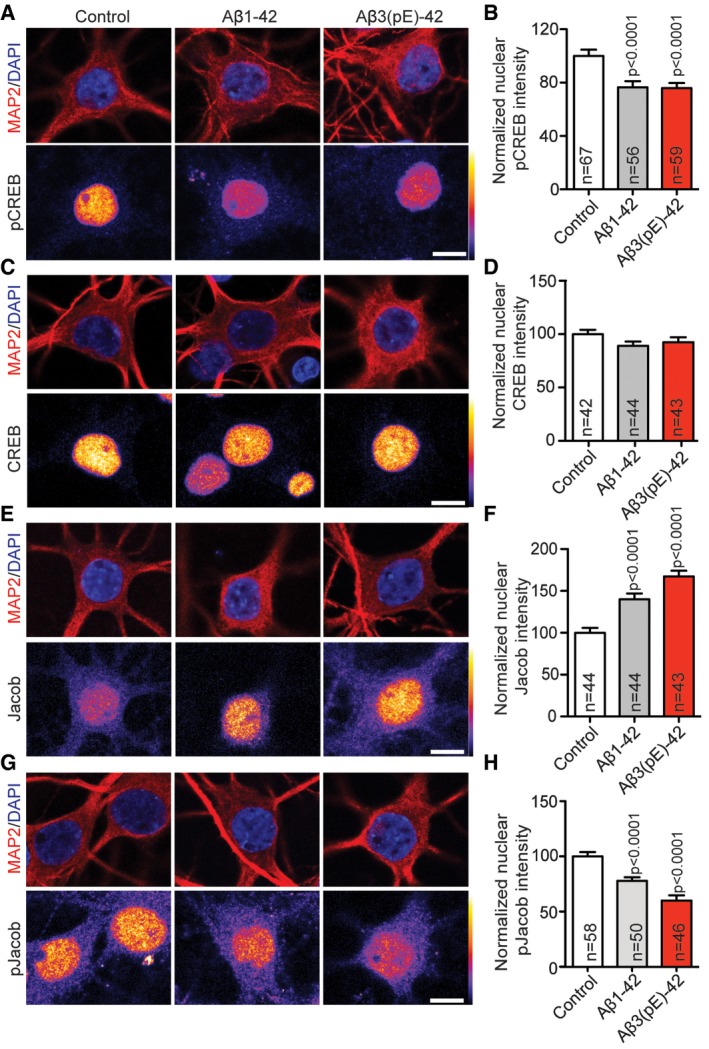
The subcellular localisation of NMDAR profoundly and differentially affects the nuclear response following activation. Stimulation of synaptic NMDAR induces the expression of cell survival and plasticity genes, while their extrasynaptic counterparts primarily drive the expression of cell death genes, linking the latter pathway to disease 30, 31. One hallmark of extrasynaptic NMDAR signalling in AD is a de‐phosphorylation and transcriptional inactivation of the transcription factor cAMP response element binding protein (CREB) 32. Jacob is a protein that encodes the synaptic and extrasynaptic origin of NMDAR signals to the nucleus 33, and in previous work, we found that Jacob links extrasynaptic Aβ1‐42‐GluN2B signalling to altered CREB‐dependent gene expression 34, 35. Nuclear import of Jacob following extrasynaptic NMDAR stimulation results in sustained de‐phosphorylation of CREB, a stripping of synaptic contacts, simplification of the dendritic tree and finally cell death 33, 36. In case of Aβ1‐42, CREB shut‐off depends on the sustained activation of extrasynaptic GluN2B‐containing NMDAR 35, 37, 38 and the subsequent nuclear import of Jacob 34, 35. We next asked whether also Aβ3(pE)‐42 is capable of inducing CREB shut‐off and indeed found significantly reduced pCREB immunofluorescence (Fig 2A and B), whereas nuclear CREB immunofluorescence was not altered (Fig 2C and D). Interestingly, oligomeric Aβ3(pE)‐42 also induced nuclear accumulation of Jacob like it was shown previously for Aβ1‐42 35 (Fig 2E and F). Moreover, treatment with both Aβ peptides resulted in significantly reduced pJacob immunostaining intensity in the nucleus (Fig 2G and H), indicating nuclear import of non‐phosphorylated Jacob, capable of inducing CREB shut‐off following activation of GluN2B‐containing extrasynaptic NMDAR 33. Application of fibrils of both Aβ isoforms had no effect on CREB phosphorylation, indicating that only oligomeric Aβ1‐42 and Aβ3(pE)‐42 trigger pathological signalling to the nucleus (Fig EV2B and C).
Figure 2. Aβ1‐42 and Aβ3(pE)‐42 induce CREB shut‐off, drive Jacob in the nucleus and decrease nuclear pJacob levels.
-
A, B(A) Neurons were co‐stained for pCREB (Ser133) and (B) the quantification revealed the decrease in nuclear pCREB immunoreactivity after treatment with Aβ1‐42 and Aβ3(pE)‐42.
-
C, DNo change of total CREB levels was observed in nucleus of neurons co‐stained for pan‐CREB.
-
E–HThere is an increase in nuclear Jacob immunoreactivity of neurons co‐stained with a pan‐Jacob antibody upon Aβ oligomers treatment (E, F) as well as a decrease in nuclear pJacob immunoreactivity (G, H). For the quantified channel (pCREB, CREB, pan‐Jacob and pJacob), original pixel intensities from 0 to 255 are represented as a gradient lookup table.
The D1‐agonist SKF38393 rescues Aβ1‐42 but not Aβ3(pE)‐42‐induced impairment of LTP
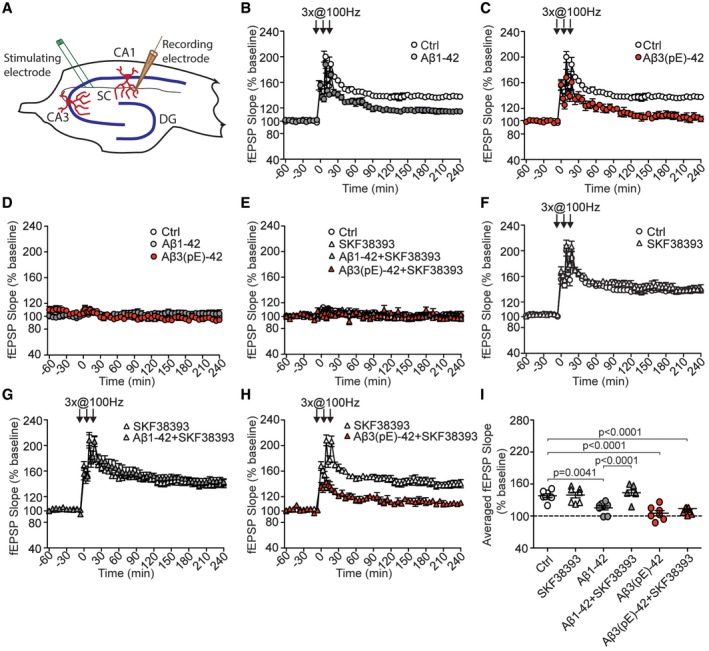
Collectively, the data so far show that both Aβ oligomers have comparable effects on synapse loss, synaptic dysfunction, network activity and signalling to the nucleus. One well‐documented consequence of Aβ1‐42‐induced synaptic dysfunction that supposedly contributes to cognitive dysfunction in AD is an impairment of LTP at hippocampal CA1 synapses 35, 37, 39, 40, 41. We therefore next evaluated whether both peptides might also limit synaptic plasticity in this cellular model of learning and memory. Bath perfusion of Aβ3(pE)‐42 like Aβ1‐42 2 h prior to high frequency stimulation caused a significantly reduced LTP after tetanisation (Fig 3A–C and I). Both oligomers had no effect on baseline recordings of fEPSP (Fig 3D), did not prevent induction of early LTP and reduced the magnitude of late LTP to a similar degree (Fig 3B, C and I). In previous studies, it was shown that administration of dopamine D1/D5 receptor agonists prevents the LTP impairment induced by conventional Aβ1‐42 39, 41. In accord with these results, co‐perfusion of the D1/D5 agonist SKF38393 during tetanisation prevented the Aβ1‐42‐induced decline in late LTP (Fig 3F, G and I). In contrast and much to our surprise, the D1R/D5R agonist failed to rescue LTP in slices treated with Aβ3(pE)‐42 under identical conditions (Fig 3H and I). This result indicates that Aβ1‐42 and Aβ3(pE)‐42 might activate distinct synaptic signalling pathways that interfere with the expression of LTP at hippocampal CA1 synapses.
Figure 3. An agonist of dopamine D1/D5 receptors selectively rescues late LTP impaired by Aβ1‐42, but not Aβ3(pE)‐42.
-
A–C(A) Schematic representation of electrode positioning in acute hippocampal slice. LTP recordings revealed that both (B) Aβ1‐42 (n = 8) and (C) Aβ3(pE)‐42 (n = 7) cause impairment of late phase LTP compared to control measurements (n = 8).
-
DBasal synaptic transmission is not affected by bath application of Aβ1‐42 (n = 8) or Aβ3(pE)‐42 (n = 7) oligomers.
-
EBasal synaptic transmission is not affected by dopamine D1/D5 receptor agonist SKF38393 (n = 7) applied alone or together with Aβ oligomers (n = 7 in each group).
-
FApplication of SKF38393 in control conditions does not alter tetanisation‐triggered LTP.
-
G, HActivation of D1/D5 receptors by SKF38393 restores the CA1 LTP in Aβ1‐42‐treated (n = 7), but not Aβ3(pE)‐42‐treated slices (n = 7).
-
IDot plot representing averaged fEPSP slope. P‐values versus control by one‐way ANOVA.
Aβ3(pE)‐42 does not bind to the PrP and pre‐blocking with anti‐PrP antibody does not prevent Aβ3(pE)‐42‐induced CREB shut‐off
We therefore asked next about the signalling pathways that might be activated differentially by both Aβ species. The PrP protein plays a documented role for synaptic dysfunction induced by full‐length oligomeric Aβ1‐42 23, 24, 25 and is considered to be an important high‐affinity Aβ receptor at synaptic membranes 23, 24, 26, 42. Previous work has shown that binding of Aβ1‐42 drives an interaction of the PrP with mGlu5 to emanate a signal that causes activation of Fyn, an essential player in a cascade of events that ultimately leads to NMDAR‐mediated excitotoxicity and hyper‐phosphorylation of tau 23. Surprisingly, we found that in contrast to Aβ1‐42, Aβ3(pE)‐42 did not associate with PrP heterologously expressed at the cell surface of HEK293T cells (Fig 4A). We therefore wondered whether association with the PrP is also instrumental for long‐distance signalling of Aβ1‐42 to the nucleus. Support for this notion came from experiments where we could block Aβ1‐42‐induced CREB shut‐off with a PrP blocking antibody that masks the Aβ1‐42 binding site in the protein (Fig 4B and C). No CREB shut‐off was visible after co‐application of Aβ1‐42 oligomers and 30 min pre‐blocking with the PrP antibody in hippocampal primary neurons (Fig 4B and C). In contrast, bath application of this antibody could not prevent Aβ3(pE)‐42‐induced CREB shut‐off (Fig 4B and C).
Figure 4. Aβ3(pE)‐42 neurotoxic effects do not involve PrP‐dependent signalling pathways.
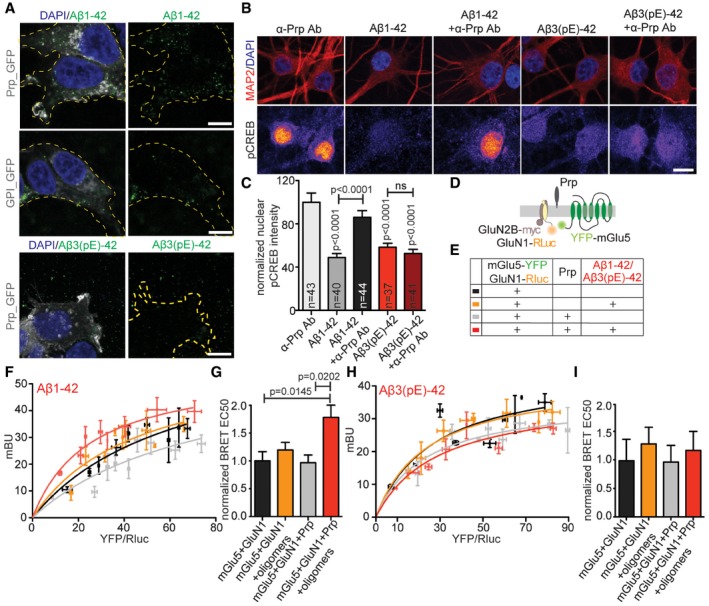
- Confocal images of HEK293T cells overexpressing GPI‐GFP or PrP‐GFP treated with Aβ1‐42 or Aβ3(pE)‐42. Only Aβ1‐42 specifically associates with cells overexpressing PrP. Scale bar, 10 μm.
- Images averaged from two confocal sections of the nucleus of primary hippocampal neurons (DIV18) stained for pCREB and MAP2. Original pixel intensities from 0 to 255 are represented as a gradient lookup table. Scale bar, 10 μm.
- Pre‐treatment with antibody (Ab) blocking PrP‐Aβ binding site rescued Aβ1‐42‐, but not Aβ3(pE)‐42‐, mediated CREB shut‐off. n corresponds to the number of nuclei from different neurons analysed from at least four independent coverslips and at least two independent cell cultures.
- Scheme representing BRET experiments performed to assess the influence of PrP and Aβ oligomers on mGlu5 and GluN1.
- Colour code and explanation of transfection and treatment combinations for experimental groups analysed in (F–I).
- BRET curves showing amount of energy transfer (mBU) depending on growing donor/acceptor ratio for cells treated with Aβ1‐42.
- Bar plots representing mean BRET EC50 values. Only in presence of PrP‐Aβ1‐42 causes significant increase in energy transfer kinetics.
- BRET curves showing the amount of energy transfer (mBU) depending on growing donor/acceptor ratio for cells treated with Aβ3(pE)‐42.
- Bar plots representing mean BRET EC50 values. Aβ3(pE)‐42 does not enhance the kinetics of mGluR5‐GluN1 interaction.
It was also reported that Aβ1‐42 clusters mGlu5 20 and might displace NMDAR from synaptic sites, in a manner that might involve a cis‐interaction between the GluN1 subunit of NMDAR and mGlu5 43. We therefore investigated whether binding of Aβ1‐42 to the PrP might affect this interaction and whether all three proteins might interact in cis. To address this question, we performed a bioluminescence resonance energy transfer (BRET) assay (Fig 4D) in HEK293T cells and we indeed found that application of Aβ1‐42 triggered an increase in BRET efficiency, indicating a stronger interaction between NMDAR and mGlu5 only in presence of PrP (Fig 4D–F). This increase was not evident after administration of Aβ3(pE)‐42 (Fig 4H and I), suggesting that the PrP is not a high‐affinity receptor for Aβ3(pE)‐42 and will not induce synaptic dysfunction via aberrant PrP‐mGlu5‐NMDAR signalling.
Aβ3(pE)‐42‐induced CREB shut‐off, impaired network oscillation and synapse loss cannot be rescued by the GluN2B antagonist ifenprodil
Collectively, these data suggest that both Aβ peptides have different primary targets and will induce synaptic dysfunction by different mechanisms. To learn more about these mechanisms, we next focussed on extrasynaptic GluN2B‐containing NMDAR. Previous studies have shown that bath application of oligomeric Aβ1‐42 decreases spontaneous neuronal network activity and induces retraction of synaptic contacts and dendrites and CREB shut‐off in a manner that requires signalling of extrasynaptic GluN2B‐containing NMDAR 35. We therefore asked first whether the detrimental immediate effects of oligomeric Aβ3(pE)‐42 administration can be prevented by bath application of a GluN2B antagonist. In contrast to Aβ1‐42, inclusion of the GluN2B antagonist ifenprodil did not completely block the effect of Aβ3(pE)‐42 application on neuronal network activity as evidenced by Fluo‐4 AM Ca2+ imaging (Fig 1H and I). As reported previously 35, Aβ1‐42‐induced CREB shut‐off can be blocked with the GluN2B‐NMDAR antagonist ifenprodil confirming that activation of downstream effectors of these receptors is involved in early detrimental actions of this oligomer (Appendix Fig S1A and B). However, co‐application of ifenprodil could not prevent de‐phosphorylation of CREB following inclusion of oligomeric Aβ3(pE)‐42 in the medium (Appendix Fig S1A and B). Similarly, Aβ1‐42‐ but not Aβ3(pE)‐42‐induced loss of synaptic contacts could be blocked by ifenprodil (Appendix Fig S1C and D), indirectly suggesting that also the structural damage caused by oligomeric Aβ3(pE)‐42 is not mediated by activation of GluN2B‐containing NMDAR. Thus, Aβ3(pE)‐42 oligomers induce early neuronal dysfunction neither by activation of GluN2B‐containing NMDARs nor the PrP.
Aβ3(pE)‐42 does not associate with neuronal membranes and is efficiently taken up by astrocytes
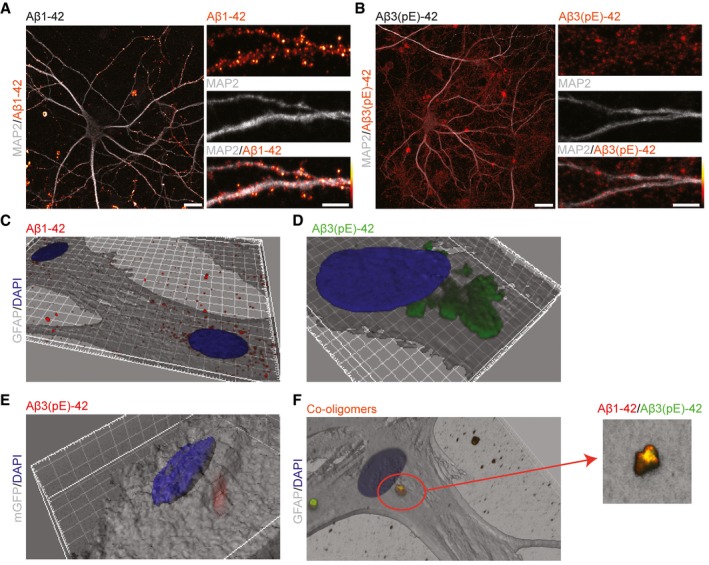
The primary cultures that we used in all previous experiments contain neurons and astrocytes. In the light of the findings above, we next examined with antibody staining how both oligomers are localised after bath application for 40 min in hippocampal primary cultures. Immunostaining with antibodies directed against the N‐terminus of Aβ oligomers (82E1 for Aβ1‐42 and Abeta‐pE3 for Aβ3(pE)‐42) revealed that oligomeric Aβ1‐42 expectedly associates prominently with neuronal membranes (Fig 5A). This was in contrast to the diffuse staining of oligomeric Aβ3(pE)‐42 (Fig 5B). On the contrary, Aβ1‐42 does not associate prominently with astroglia (Fig 5C), while the majority of Aβ3(pE)‐42 was present in somatic inclusions within astrocytes, as revealed by three‐dimensional reconstruction of confocal images (Fig 5D). This was further confirmed in experiments where we transfected astrocytes with myristoylated GFP as a cell membrane marker (Fig 5E). Next, we asked whether co‐oligomers of Aβ1‐42 and Aβ3(pE)‐42 will also associate with glia. The immunostainings followed by three‐dimensional reconstruction revealed that some co‐oligomers form also somatic inclusions in astrocytes (Fig 5F).
Figure 5. Aβ3(pE)‐42 does not bind prominently to neuronal membranes but is instead taken up efficiently by astrocytes.
-
A, BConfocal images of DIV18 neurons stained for (A) Aβ1‐42 or (B) Aβ3(pE)‐42 after 40 min of treatment demonstrate that Aβ1‐42 associates preferentially with neuronal membranes, whereas Aβ3(pE)‐42 is rather diffusely distributed in mixed neuronal culture. Scale bars, 10 μm (images of a whole neuron) and 5 μm (zoomed in panels).
-
C, D3D reconstructions (based on GFAP) of confocal images of astrocytes indicate that Aβ3(pE)‐42, but not Aβ1‐42, is taken up by astrocytes after 40 min of treatment.
-
E3D reconstruction of an astrocyte transfected with mGFP revealed that Aβ3(pE)‐42 localises within the cell 40 min following application.
-
FCo‐oligomerisation of Aβ1‐42 and Aβ3(pE)‐42 causes association of both species in one structure and leads to astrocytic uptake not only of Aβ3(pE)‐42 but also Aβ1‐42.
Aβ3(pE)‐42 does not induce synapse loss, nuclear translocation of Jacob and CREB shut‐off in hippocampal cultures with low glia content
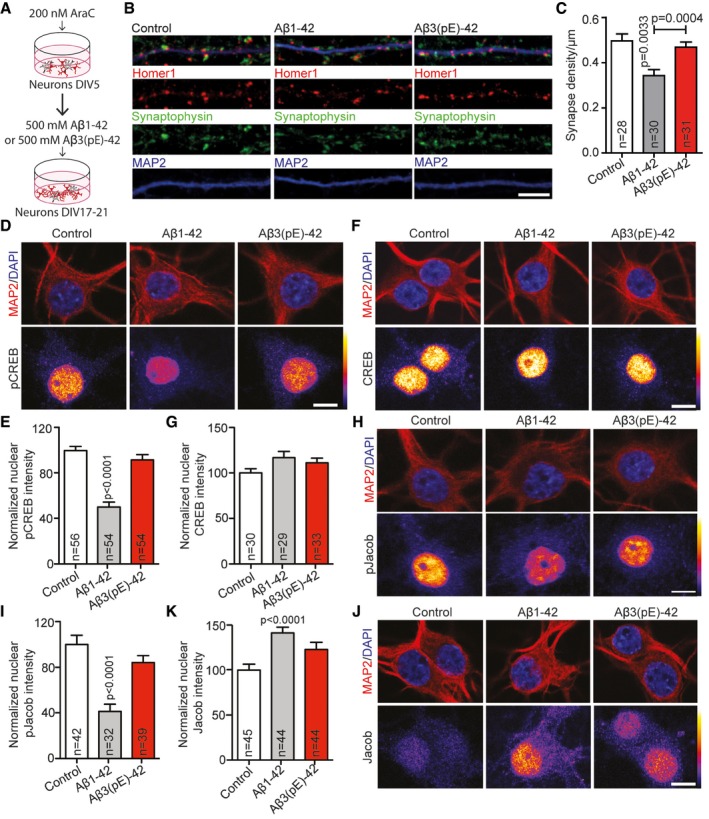
The preparation protocol for hippocampal primary cultures includes several steps that are not in favour of microglia attachment. We indeed found no evidence for the presence of microglia in these cultures before and after treatment with oligomers by means of immunocytochemistry (ICC) or immunoblotting using Iba‐1 as a marker (Appendix Fig S2C and D). The tight association of Aβ3(pE)‐42 with glial cells led us then to reason that astroglia might also contribute to Aβ3(pE)‐42‐induced pathology. To test this notion, we treated hippocampal primary cultures on DIV5 with 200 nM cytosine arabinoside (AraC) to suppress mitosis and glia proliferation (Appendix Fig S2A and B). This treatment resulted in an approximately 11‐fold reduction in astrocyte content in these mixed cultures (Appendix Fig S2A and B). Remarkably, oligomeric Aβ3(pE)‐42‐induced synapse loss was absent in cultures with a low astroglia content (Fig 6A–C). Following AraC treatment, we also observed no longer a significant effect of Aβ3(pE)‐42 administration on CREB phosphorylation, nuclear accumulation of Jacob or on the decrease in nuclear pJacob immunofluorescence (Fig 6D–K). On the contrary, Aβ1‐42 treatment induced nuclear translocation of non‐phosphorylated Jacob, CREB shut‐off and a reduction in synapse number irrespective of the astroglia content of the primary cultures (Fig 6B–K).
Figure 6. In AraC‐treated cultures Aβ3(pE)‐42 does not cause synapse loss, de‐phosphorylation of pCREB and accumulation of non‐phosphorylated Jacob in the nucleus.
-
AScheme representing the AraC treatment regime of neuronal cultures at DIV5.
-
BConfocal images of representative dendrites, stained for Homer1, Synaptophysin and MAP2, demonstrating that the decrease in synaptic density in AraC‐treated cultures was evident only after Aβ1‐42 application. Scale bar, 5 μm.
-
CTreatment with AraC selectively prevents the decrease in the mean synaptic density after Aβ3(pE)‐42 application. n corresponds to the number of separate dendritic segments on different neurons analysed from at least three independent coverslips and at least two independent cell cultures.
-
D–K(D, E) In AraC‐treated cultures, only Aβ1‐42, but not Aβ3(pE)‐42, causes decrease in pCREB nuclear staining intensity with (F, G) unchanged CREB levels. Also (H, I) the pJacob nuclear levels and (J, K) Jacob accumulation significantly changes only in case of Aβ1‐42 treatment. Original pixel intensities from 0 to 255 are represented as a gradient lookup table. Scale bar, 10 μm.
Aβ3(pE)‐42 causes stronger microglia activation and astroglia proliferation in organotypic hippocampal slices than Aβ1‐42
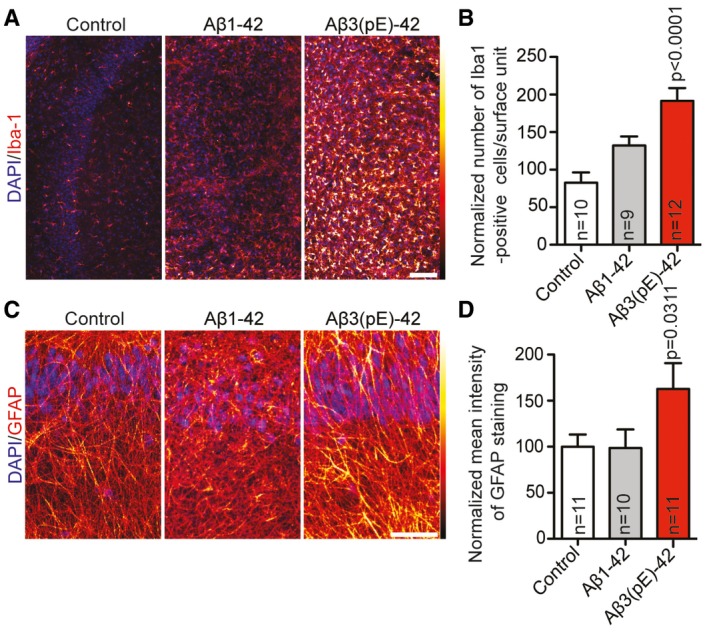
Reactive astrocytes are an integral part of the neuroinflammatory response in AD. We corroborated these findings in organotypic hippocampal slice cultures treated with either of the two oligomeric Aβ isoforms. Immunohistochemical staining for reactive microglia with an antibody directed against Iba‐1, a marker of activated microglia, revealed that Aβ3(pE)‐42 caused a much more prominent microglia activation than administration of Aβ1‐42 (Fig EV3A and B). We next quantified astroglia proliferation with GFAP immunohistochemistry in slices following addition of Aβ oligomers to the medium, and we found that the presence of Aβ3(pE)‐42 resulted in increased GFAP staining intensity, while Aβ1‐42 applied at the same concentration had only a minor effect (Fig EV3C and D). Taken together, these results suggest that microglia activation and astroglial proliferation in AD is prominently triggered by Aβ3(pE)‐42 and might be linked to early neuronal dysfunction.
Figure EV3. Aβ3(pE)‐42 causes prominent microglia and astroglia activation.
-
A–DMurine organotypic slices were treated with Aβ1‐42 or Aβ3(pE)‐42 for 3 days. Confocal images of slices stained for (A) Iba‐1 or (C) GFAP indicate that there is an increased activation of microglia and astrocytes. Scale bar, 100 μm. Bar graphs show quantification of (B) Iba‐1‐positive cells and (D) mean GFAP fluorescence intensity. Original pixel intensities from 0 to 255 are represented as a gradient lookup table. Scale bar, 10 μm. n corresponds to the number of slices from at least two independent experiments. P‐values versus control by one‐way ANOVA. Data are represented as mean ± s.e.m.
The astrocytic release of TNFα is increased in response to Aβ3(pE)‐42 and less to Aβ1‐42
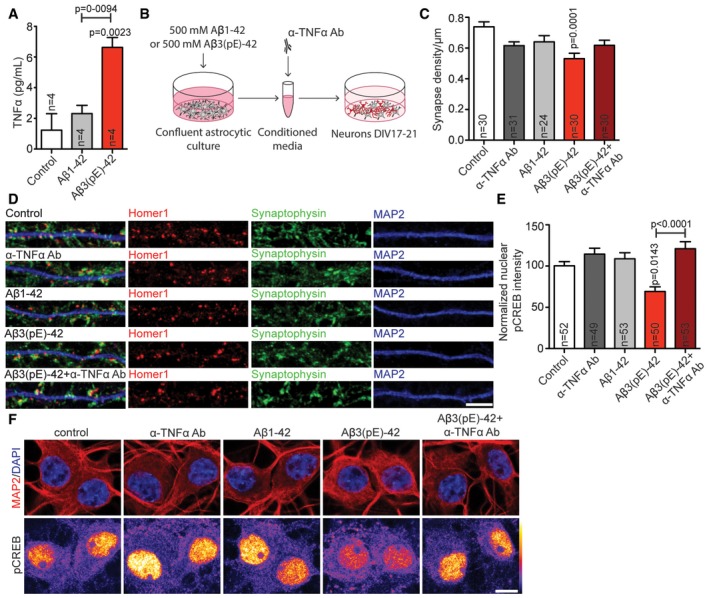
Microglia is rare in hippocampal primary cultures and staining with an Iba‐1 antibody or SDS–PAGE of cell culture extract yielded negative results (Appendix Fig S2C and D). To gain further mechanistic insights, we therefore investigated astrocytic release of potential synaptotoxic factors. We focussed on TNFα because this cytokine is released from micro‐ and astroglia in the primary stage of neuroinflammation in AD and has a documented role in synaptic downscaling and alterations 44, 45, 46, 47. A TNFα ELISA to quantify this proinflammatory cytokine revealed elevated TNFα levels in the astrocyte lysate treated for 13 h with Aβ3(pE)‐42, whereas Aβ1‐42 induced a much smaller increase (Fig 7A).
Figure 7. Aβ3(pE)‐42 causes astrocytic TNFα‐driven synaptic dysfunction.
-
ABar plot representing TNFα content in astrocytic lysate after treatment with Aβ1‐42 or Aβ3(pE)‐42 measured by ELISA. Only in case of Aβ3(pE)‐42, there is significant increase in TNFα. n corresponds to the number of flasks from 2 different experiments.
-
BScheme representing stimulation with glia‐conditioned media.
-
C, DMedium from astrocytes treated with Aβ1‐42 or Aβ3(pE)‐42 cause decrease in synaptic density only in case of Aβ3(pE)‐42. The depletion with anti‐TNFα antibody prevents synaptic loss. n corresponds to the number of separate dendritic segments on different neurons analysed from at least three independent coverslips and at least two independent cell cultures. (D) Confocal images of representative dendrites stained for Homer1, Synaptophysin and MAP2. Scale bar, 5 μm.
-
EThe decrease in nuclear pCREB intensity occurs only in case of media from astrocytes treated with Aβ3(pE)‐42 and can be rescued by depletion with an anti‐TNFα antibody (Ab). n corresponds to the number of nuclei from different neurons analysed from at least four independent coverslips and at least two independent cell cultures.
-
FConfocal images of DIV18 neurons stained for pCREB. Original pixel intensities from 0 to 255 are represented as a gradient lookup table. Scale bar, 10 μm.
Conditioned medium from astrocytes treated with Aβ3(pE)‐42 causes synapse loss and CREB shut‐off
We next directly tested the hypothesis that glial release of TNFα following stimulation of Aβ3(pE)‐42 is crucial for subsequent synapse loss and CREB shut‐off. To this end, we treated primary astrocyte cultures with Aβ3(pE)‐42 or conventional Aβ1‐42 oligomers for 40 min. Conditioned media was then collected, and hippocampal neurons were supplemented with this medium for 40 min (Fig 7B). The Aβ concentration in the media was below the detection limit (< 12.5 pg/ml) of an ELISA that is suitable for quantification of both peptide species. Treatment of primary hippocampal cultures with conditioned medium induced statistically significant synapse loss only in case of Aβ3(pE)‐42. Most important, synapse loss induced by Aβ3(pE)‐42 conditioned medium was rescued by application of a TNFα neutralising antibody (Fig 7C and D). Moreover, neurons treated with media from astrocyte cultures that were stimulated with Aβ3(pE)‐42 showed a significant decrease in nuclear pCREB immunofluorescence (Fig 7E and F). Conditioned medium from astrocyte cultures treated with similar concentrations of Aβ1‐42 had no effect (Fig 7E and F).
We next sought to determine whether the neutralising antibody is effective in mixed neuronal/glia cultures. Synapse loss caused by both Aβ oligomers could be fully rescued by co‐application of the TNFα neutralising antibody only in case of Aβ3(pE)‐42‐treated neurons (Fig 8A and B). Accordingly, the neutralising anti‐TNFα antibody did not prevent CREB shut‐off induced by Aβ1‐42 (Fig 8C and D), while it completely blocked Aβ3(pE)‐42‐induced CREB shut‐off (Fig 8C and D) without changing total CREB levels (Appendix Fig S3A and B). In addition, a TNFR1 peptide antagonist that blocks the interaction site of TNFα in TNFR1 48, 49 also prevented Ab3(pE)‐42‐ but not Aβ1‐42‐induced CREB shutoff (Fig EV4A and B). Finally, we could rescue the detrimental effect of oligomeric Aβ3(pE)‐42 on the maintenance of LTP in CA1 of acute mouse hippocampal slices when we co‐applied the neutralising anti‐TNFα antibody (Fig 9A–F). The same treatment had very little effect on the Aβ1‐42‐induced impairment of LTP (Fig 9A–F).
Figure 8. Co‐application of anti‐TNFα antibody prevents Aβ3(pE)‐42‐caused synaptic loss and decrease in pCREB .
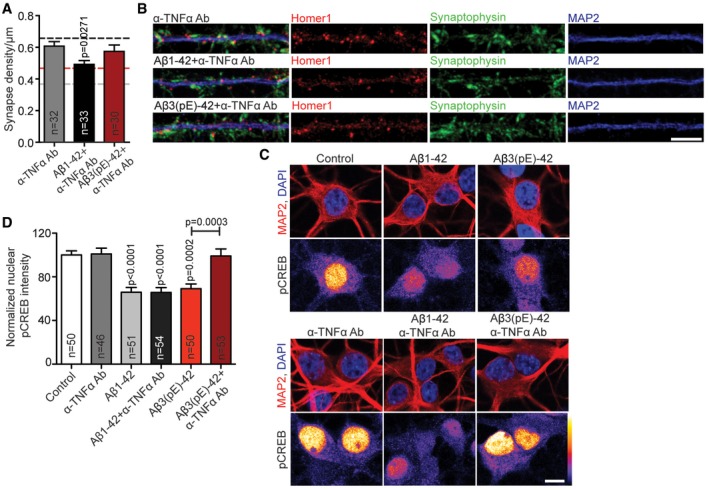
- Bar plots representing mean synapse density after treatment with anti‐TNFα antibody alone or with Aβ1‐42 or Aβ3(pE)‐42 co‐application. Anti‐TNFα antibody fully prevents synaptic loss only in case of Aβ3(pE)‐42. In case of Aβ1‐42 application, the antibody treatment provides a partial rescue. Dashed lines indicate mean synapse density from Fig 1B: black, control; grey, Aβ1‐42 treatment; red, Aβ3(pE)‐42 treatment. n corresponds to the number of nuclei from different neurons analysed from at least four independent coverslips and at least two independent cell cultures.
- Confocal images of representative dendrites stained for Homer1, Synaptophysin and MAP2. Scale bar, 5 μm.
- Anti‐TNFα antibody does not cause CREB shut‐off and prevents Aβ1‐42‐ or Aβ3(pE)‐42‐caused decrease in nuclear pCREB levels. Original pixel intensities from 0 to 255 are represented as a gradient lookup table. Scale bar, 10 μm.
- Bar plot representing mean nuclear pCREB staining intensity. n corresponds to the number of nuclei from different neurons analysed from at least four independent coverslips and at least two independent cell cultures.
Figure EV4. Co‐application of TNFR antagonist rescues Aβ3(pE)‐42‐caused decrease in pCREB .
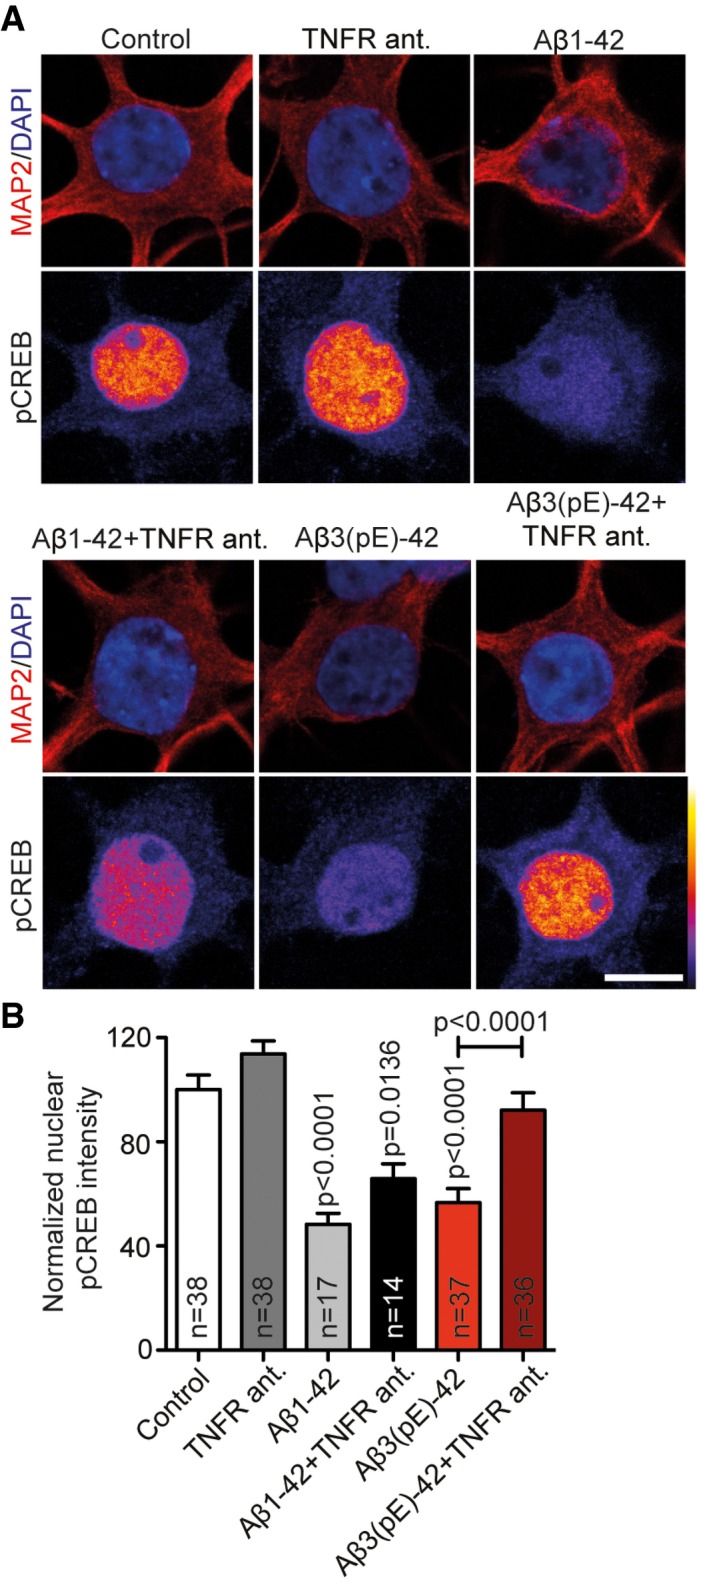
- Confocal images averaged from two sections of the nucleus of DIV18 primary hippocampal neurons stained for MAP2, DAPI and pCREB (Ser133) treated with Aβ1‐42 or Aβ3(pE)‐42 for 40 min with or without the TNFR antagonist. Original pixel intensities from 0 to 255 are represented as a gradient lookup table. Scale bar, 10 μm.
- Only in case of Aβ3(pE)‐42 co‐application of the TNFR antagonist prevents CREB shut‐off. n corresponds to the number of nuclei from different neurons analysed from at least four independent coverslips from two independent cell cultures. P‐values versus control by one‐way ANOVA. Data are represented as mean ± s.e.m.
Figure 9. Anti‐TNFα antibody rescues Aβ3(pE)‐42‐ but not Aβ1‐42‐induced LTP impairment.
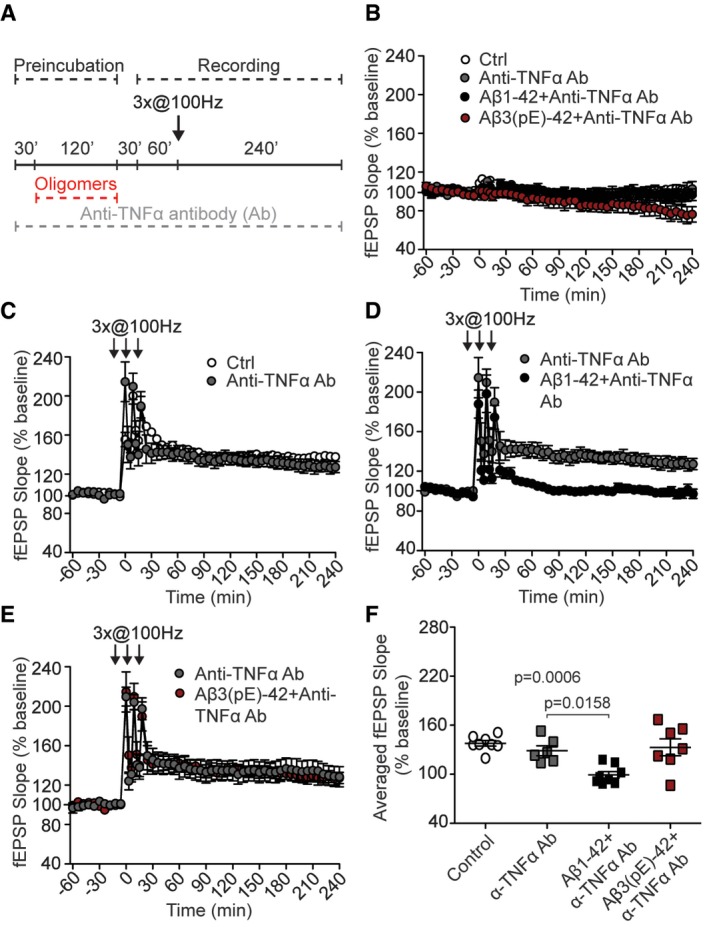
-
AScheme representing experimental design. Acute slices were preincubated with anti‐TNFα antibody (Ab); then Aβ oligomers were added for 120 min. High‐frequency stimulation (HFS) trains lasting 1 s at 100 Hz followed by 30‐min resting period and 60‐min baseline recording.
-
BAnti‐TNFα antibody, with or without Aβ oligomers, does not alter basal synaptic transmission (for control n = 6, for anti‐TNFα antibody n = 8, for Ab1‐42 co‐application n = 8, and for Ab(3)pE‐42 co‐application n = 7).
-
CAnti‐TNFα antibody (n = 6) does not change LTP compared to control (n = 8).
-
D, E(D) Anti‐TNFα antibody does not rescue Aβ1‐42‐ (n = 8) but (E) Aβ3(pE)‐42‐caused (n = 7) impairment.
-
FDot plot representing averaged fEPSP slope. n corresponds to the number of slices from at least three mice.
Collectively, these data point to a prominent role of TNFα in neuronal dysfunction induced by oligomeric Aβ3(pE)‐42. To directly test whether TNFα on its own can in principal induce structural damage in primary neurons, we bath‐applied the cytokine and quantified synapse number and dendrite complexity (Fig EV5A–C). It turned out that application of TNFα indeed induced synapse loss and simplification of dendrites (Fig EV5A–C).
Figure EV5. 1.8 nM TNFα causes synapse loss and reduction in dendritic tree complexity.
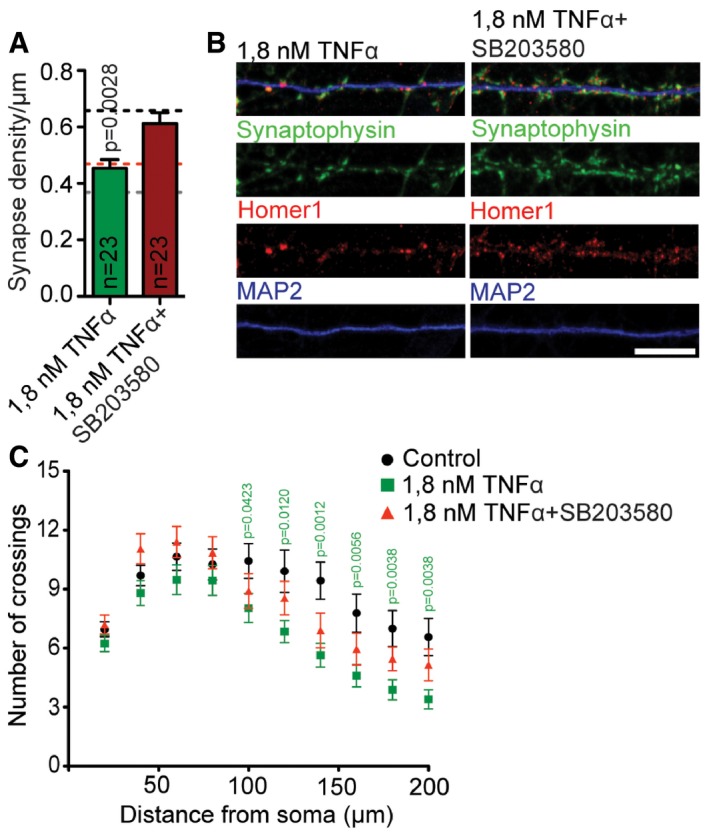
- Bar plots representing mean synapse density after treatment with 1.8 nM TNFα with or without co‐application of SB203580. 1.8 nM TNFα causes synaptic loss that can be rescued by SB203580 application. Dashed lines indicate mean synapse density from Fig 1B: black, control; grey, Aβ1‐42 treatment; red, Aβ3(pE)‐42 treatment. n corresponds to the number of different dendritic segments from different neurons analysed from at least four independent coverslips and at least two independent cell cultures.
- Confocal images of representative dendrites stained for Homer1, Synaptophysin and MAP2. Scale bar, 10 μm.
- 1.8 nM TNFα causes dendritic tree simplification that can be rescued by SB203580 application. Graph representing results of Sholl analysis of RFP‐transfected neurons treated with 1.8 nM TNFα (n = 25) with or without SB203580 (n = 20) and control (n = 23). n corresponds to the number of neurons analysed from at least three independent coverslips and at least two independent cell cultures.
We then assessed whether intervention with TNFα signalling has a protective effect against synaptic dysfunction in mouse models of AD. To this end, we chose 5XFAD mice that express mutant APP and PSEN1 and accumulate high levels of Aβ1‐42. LTP is normal in young animals, but becomes impaired around 6 months 50. Expectedly the fEPSP slope as a readout of LTP strength was therefore lower in acute hippocampal slices of 8‐month‐old 5XFAD mice than in corresponding control slices (Figs 10D–F and 3B, C and I). Application of the neutralising anti‐TNFα antibody had no effect on the fEPSP slope (Fig 10E and F). In the TBA2.1 mouse model, Aβ3(pE)‐42 (expressed under control of a Thy‐1 promoter) rapidly accumulates in the hippocampus, which results in synaptic dysfunction and memory impairment already in mice at the age 8–10 weeks 51. Accordingly, the fEPSP slope and maintenance of late LTP are severely affected in these mice (Fig 10A–C). Most important, in contrast to 5XFAD mice, inclusion of the neutralising anti‐TNFα antibody almost restored late LTP and increased the fEPSP slope amplitude (Fig 10B and C). Collectively, these data point to a prominent role of TNFα in neuronal dysfunction induced by oligomeric Aβ3(pE)‐42 as compared to Aβ1‐42. Interestingly, the D1‐agonist SKF38393 could not rescue LTP impairment in TBA2.1 which corroborates the finding that SKF38393 rescues Aβ1‐42‐ but not Aβ3(pE)‐42‐induced LTP impairment (Fig 3G–I).
Figure 10. Anti‐TNFα antibody rescues LTP impairment in TBA2.1 but not 5XFAD mice.
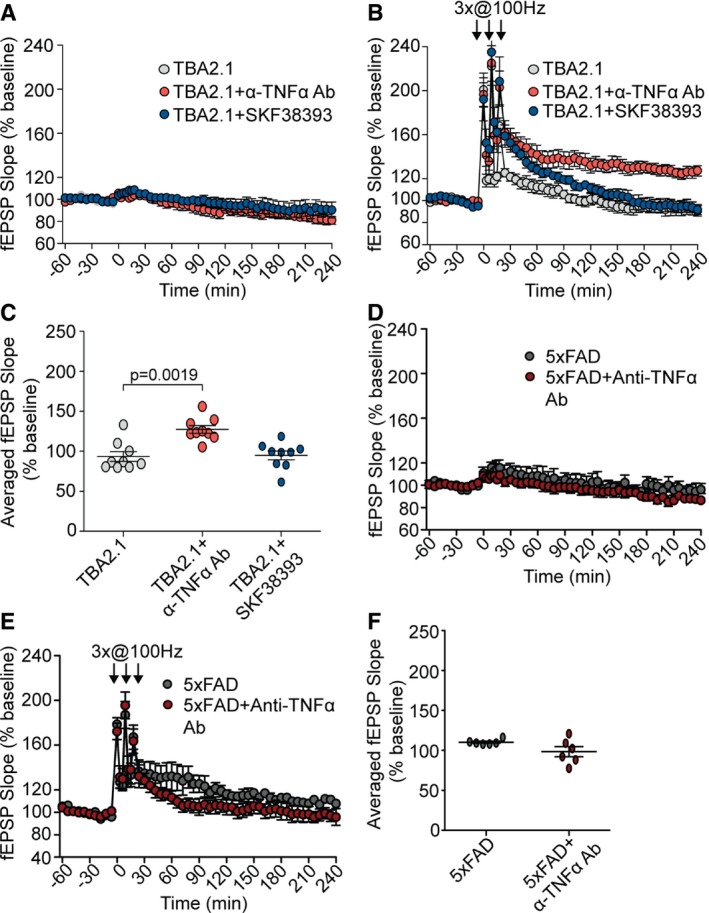
- Anti‐TNFα (n = 9) antibody and SKF38393 (n = 7) do not change the basal synaptic transmission in TBA2.1 mice (n = 9).
- Anti‐TNFα antibody (n = 9) but not SKF38393 (n = 7) rescues LTP impairment in TBA2.1 mice (n = 9).
- Dot plot representing averaged fEPSP slope of values measured 210–240 min posttetanisation for TBA2.1 with and without anti‐TNFα antibody (n = 9) or SKF38393 (n = 7).
- Anti‐TNFα antibody does not change the basal synaptic transmission in 5XFAD mice (n = 6).
- The anti‐TNFα antibody (n = 6) treatment does not rescue LTP impairment in 5XFAD mice (n = 6).
- Dot plot representing averaged fEPSP slope of values measured 210–240 min posttetanisation for 5XFAD mice with and without anti‐TNFα antibody (n = 6). n corresponds to the number of slices from at least five TBA2.1 mice and 4 5XFAD mice.
Aβ3(pE)‐42 and Aβ1‐42 induce neuronal dysfunction via a p38MAP kinase pathway
We finally asked how pathological Aβ3(pE)‐42 and Aβ1‐42 signalling might converge to induce synapse loss and CREB shut‐off. Published work demonstrates that TNFα and conventional Aβ1‐42 can both activate p38MAPK and that enhanced p38MAPK signalling is involved in synaptic dysfunction and impaired plasticity in caused by Aβ oligomers 52, 53. We therefore hypothesised that p38MAPK signalling might be a point of convergence for both Aβ pathways. To test this idea, we treated hippocampal primary neurons with Aβ3(pE)‐42 or Aβ1‐42 and co‐applied the p38MAPK inhibitor SB203580 or a vehicle control. We then determined synapse loss, dendrite retraction and CREB shut‐off. It turned out that treatment with both oligomers is sensitive to SB203580 application and that inhibition of p38MAPK attenuated synapse loss (Appendix Fig S4A and B) CREB shut‐off (Appendix Fig S4C and D) as well as dendrite retraction (Appendix Fig S4E). Moreover, the p38MAPK inhibitor also attenuated TNFα‐induced synapse loss and dendrite retraction (Fig EV5A–C). Finally, bath application of both oligomers resulted in enhanced phosphorylation and activation of p38MAPK (Appendix Fig S4F and G), while this treatment had no effect on p38MAPK protein levels (Appendix Fig S4H and I). Thus, activation of p38MAPK is a nodal point for pathological signalling evoked by both oligomers.
Discussion
Several posttranslational modifications have been reported for Aβ, and heterogeneous Aβ species have been found in AD brain. Nonetheless, the role and abundance of numerous PTM Aβ have been a matter of controversy. In the present study, we focused on N‐terminally modified oligomeric pyroglutamated Aβ that is highly neurotoxic, efficiently nucleates Aβ oligomer formation and is abundant in AD 13, 14, 54. The nature of the toxic role of different PTM Aβ species and here in particular of pyroglutamated oligomers is not clear. In consequence, it was important to learn whether propensity for oligomerisation alone, or distinct pathological signalling or a combination of both contribute to their impact on the onset of AD. In this study, we provide evidence that Aβ3(pE)‐42 induces synaptic dysfunction by clearly different mechanisms than Aβ1‐42. Application of both oligomers resulted in synapse loss, dendrite retraction, reduced mEPSC amplitude and frequency, impairment of LTP, reduced frequency of synchronised Ca2+ waves, CREB shut‐off and nuclear import of non‐phosphorylated Jacob (Appendix Fig S5). Thus, we found that Aβ3(pE)‐42 can induce synaptic dysfunction on its own without co‐oligomerisation with Aβ1‐42. Many findings indicate that Aβ1‐42 acutely evokes synaptotoxicity by an abnormal interaction of PrP, mGlu5 and NMDAR 17, 18, 20, 22, 23, 24, 25, 37, 38. Accordingly, we found evidence for binding of Aβ1‐42 to the PrP and that Aβ1‐42 application results in a tight association of mGlu5 and NMDAR to the PrP, thereby extending previous work and providing first evidence for an interaction in a trimeric complex (Appendix Fig S5). However, we found no evidence of Aβ3(pE)‐42 binding to the PrP and Aβ3(pE)‐42 had no effect on the assembly of a macromolecular complex consisting of the PrP with mGlu5 and NMDAR. In addition, it did not accumulate at neuronal membranes and did not induce neuronal dysfunction via activation of extrasynaptic GluN2B‐containing NMDAR. Furthermore, blocking of the PrP with an antibody that also targets the binding site for conventional Aβ oligomers 23 rescued only Aβ1‐42‐dependent CREB shut‐off but was ineffective in case of Aβ3(pE)‐42 application. Finally, in contrast to Aβ1‐42, Aβ3(pE)‐42‐induced impairment of LTP could not be rescued with a dopamine D1R/D5R‐agonist (Appendix Fig S5). Instead, the data suggest that synaptic dysfunction caused by Aβ3(pE)‐42 requires glial uptake and increased release of the proinflammatory cytokine TNFα from activated astrocytes. Supporting evidence for this hypothesis came from LTP experiments performed in transgenic mice lines where blockage of TNFα was only effective in TBA2.1 mice that produce larger amounts of Aβ3(pE)‐42. Indirectly, these experiments also suggest that endogenous Aβ1‐42 and Aβ3(pE)‐42 oligomers have similar properties like those prepared in vitro.
TNFα was identified as the principle neurotoxic agent resulting from Aβ‐induced proinflammatory transcriptional changes 27, 44, 55, 52. The cytokine contributes to impairment of synaptic plasticity 53, and it was shown that levels of TNFα correlate with the risk of development of mild cognitive impairment in AD 53. Mounting evidence supports the hypothesis that inflammatory mediators can also affect neuronal functioning long before structural damage and cell death are observed. Indeed, several cytokines, including IL‐1β, IL‐18, IFN‐γ and TNFα, have been shown to suppress LTP in the hippocampus 28, 53. In addition, evidence was provided that astrocytes have a potential role in internalisation and degradation of Aβ 56, 57 as well as they are a main source of ApoE whose polymorphism (ε‐4 version) is the main genetic risk factor in AD 58. It is important to note, however, that astrocytes are not the only source of proinflammatory signalling in brain. Microglia is able to bind soluble Aβ oligomers, which results in increased production of proinflammatory cytokines, including TNFα 28. In the present study, we have used primary culture system that eases investigation but lacks microglia. The experiments with organotypic slices, however, clearly showed microglia activation which was more prominent in case of Aβ3(pE)‐42 than the one induced by Aβ1‐42, a finding that has been previously reported 51. Thus, it is highly likely that in AD brain both astrocytes and microglia contribute to the proinflammatory effects of Aβ3(pE)‐42 oligomers.
In summary, the present study highlights the possibility that a variety of PTM Aβ oligomers might not only contribute to different rates of oligomerisation, protofibril and fibril production, which results in distinct Aβ‐deposits in AD brain at the late stage of the disease, but that they can also trigger synaptic dysfunction on their own via different pathological signalling pathways. Collectively, the data point to a scenario where neuroinflammatory processes together with direct synaptotoxic effects are caused by soluble amyloid oligomers and contribute synergistically to the onset of AD 1, 2, 3, 27, 28, 29, 47. An intriguing question is how mixed Aβ oligomer species will impact on the early stage of AD and trigger synaptic dysfunction and which type of oligomer will dominate in the progression of the disease in terms of abundance and pathological impact. Since signalling evoked by mixed Aβ species can be different, it is possible, if not likely, that there is a considerable variability in the levels of PTM Aβ isoforms between AD patients, resulting in different oligomerisation rates and signalling mechanisms, and we speculate that this aspect could lead to different clinical trajectories. A nodal point in pathological signalling of both oligomers appears to be p38MAPK that is upstream of CREB shut‐off and possibly also immediate synaptic dysfunction. Thus, downstream targets of synaptic signalling induced by Aβ1‐42 and Aβ3(pE)‐42 might be shared and are interesting targets for pharmacological interventions (Appendix Fig S5).
Materials and Methods
Aβ‐oligomer production
Human Aβ‐oligomers (Anaspec, Cat. No. AS‐20276) were prepared according to previously established protocol 59. Briefly, the lyophilised Aβ1‐42 was disaggregated in 1,1,1,3,3,3‐hexafluoro‐2‐propanol (HFIP, Sigma‐Aldrich, St Louis, MO, USA, Cat. No. B2517) to 0.5 mg/ml. The solution was aliquoted. After evaporating of HFIP, the peptide film was stored at −80°C. Twenty‐four hours before use, the peptide film was dissolved in DMSO (1:1,000, Sigma‐Aldrich, Cat. No. 276855), sonicated, diluted to 50 μM concentration in F12 medium (Gibco; Cat. No. 21765‐029) and kept for oligomerisation at 4°C for 24 h. Aβ3(pE)‐42 oligomers (kind gift from H. Demuth) were prepared according to previously established protocol 12. The peptide was disaggregated in HFIP, and the aliquots were stored at −80°C. HFIP was evaporated for 24 h at room temperature. The peptide was dissolved in 0.1 M NaOH, vortexed, diluted in neurobasal medium (Gibco, Cat. No. 21103049) and 0.1 M HCl to a final concentration of 5 μM. Oligomers were formed during incubation for 24 h. Since we used two different preparation protocols, for initial characterisation, part of Aβ1‐42 was prepared according to the Aβ3(pE)‐42 protocol. The oligomerisation procedure was verified by SDS–PAGE (10% Tricine gels). Membranes were probed with antibodies detecting the N‐terminus of Aβ peptide—82E1 (1:1,000, IBL, Cat. No. 10323) and Aβ pE‐3 (1:1,000, SySy, Cat. No. 218003), for Aβ1‐42 and Aβ3(pE)‐42, respectively. To prepare co‐oligomers, 5% Aβ3(pE)‐42 and 95% Aβ1‐42 were mixed to a final 5 μM concentration and incubated for 24 h like described in 12. For every independent experiment, the fresh preparation of oligomers was used.
Size‐exclusion chromatography and ELISA assay
To further determine the distribution of different oligomer species, the oligomer solution (5 μM) was fractioned on a Superdex‐75 column (GE Healthcare, Cat. No. 17‐5174‐01). Fractions of 1.5 ml were collected, and the amount of oligomers in each fraction was quantified by enzyme immunoassay x‐42, with an antibody targeted against the C‐terminus of Aβ peptides (IBL International, Cat. No. RE59721). A 23.56 ml Superdex column was calibrated with protein standards (aprotinin, MW 6,500; ribonuclease, MW 13,700; bovine erythrocyte carbonic anhydrase, MW 29,000; ovalbumin, MW 44,000; and conalbumin, MW 75,000; Sigma‐Aldrich). Equation describing relation between elution volume and MW was obtained by plotting K av (K av = (V e−V o)/(V t−V o); V e, elution volume; V o, column void volume; V t, total column volume) versus MW. Elution volumes were determined by measuring absorbance at 280 nm.
Native PAGE
Both peptide solutions were mixed with equivolume native gel sample buffer (Bio‐Rad, Cat. No. 1610738) and loaded onto native polyacrylamide gel (Mini‐PROTEAN TGX, 4–20%; Bio‐Rad, Cat. No. 4561096). Bands were resolved using 25 mM Tris running buffer containing 192 mM glycine followed by staining with Coomassie G250.
Dynamic light scattering measurement
Particle volume distribution based on intensity was obtained for monomer, oligomer and fibril of both peptides in 50 mM Tris buffer (pH 7.4) containing 100 mM NaCl postcentrifugation and filtration using Zetasizer Nano S DLS instrument (Malvern Instruments).
ANS spectroscopy
Fluorescence emission spectra of ANS were measured on a Hitachi F7000 spectrofluorometer. All spectra were recorded in correct spectrum mode of the instrument using excitation and emission band passes of 5 nm. 50 μM ANS was added to peptide solution (prepared in neural basal media), incubated for 2 min, and spectra were recorded between 400 and 700 nm by exciting the solution at 370 nm.
Transmission electron microscopy
Solutions were prepared as described above and stored at −20°C. Samples (5 μl) dropped on parafilm, and Formvar/carbon‐coated 200‐mesh copper grids (Plano, Germany) were incubated for 5 min onto the solution. After three washing steps with distilled water, the liquid was removed with wet filter paper, and the samples were negatively stained with 2% uranyl acetate for 30 s and left to dry. The samples were examined with a Zeiss 902 electron microscope operating at an excitation voltage of 80 kV equipped with a TRS 2K digital camera (A. Tröndle, Moorenweis, Germany).
Amyloid fibrils preparation and Thioflavin T assay
Amyloid peptides (Aβ1‐42 or Aβ3(pE)‐42) were diluted to 40 μM concentration and mixed with 20 μM Thioflavin T (Sigma‐Aldrich, Cat. No. T3516) aqueous solution or neurobasal medium in a 1:1 ratio. Dilutions were prepared in 96‐well plates (Corning). Fluorescence intensity (excitation 440 nm, emission 475–30 nm) was measured every 5 min for 7 h using a FLUOstar Omega Microplate Reader (BMG Labtechnologies, Offenburg, Germany). After successful fibril formation judged by wells containing ThT, Aβ fibrils diluted in neurobasal were applied to neurons for control experiments.
Primary rat hippocampal cell culture and transfection
Dissociated hippocampal neurons were prepared like described in 33. Briefly, from Sprague Dawley rat embryos (E18) were plated on 18‐mm glass coverslips coated with poly‐D‐lysine. For transfection, neurons were plated at a density of 60,000 and for ICC 40,000 in 12‐well plate. Neurons were plated in 1 ml of DMEM supplemented with 10% FBS, 2 mM glutamine and 1% of penicillin/streptomycin. After first day in culture, medium was changed to 1 ml of neurobasal with B27, 1% of penicillin/streptomycin and 0.8 mM glutamine. Cultures were kept at 37°C, 5% CO2 and 95% humidity. After 5 DIV, some cultures were treated with 200 nM AraC. For Sholl analysis, neurons were transfected with GFP or RFP with Lipofectamine 2000 (Thermo Fisher Scientific, Cat. No. 11668027).
Primary rat glial culture
Glia culture was prepared from P0 rat forebrain. Following trypsinisation, cells were mechanically dissociated and plated in DMEM (Gibco, Cat. No. 41966‐029) supplemented with 10% FBS, 1% penicillin/streptomycin and 0.5 mM glutamine. After 1 week when the culture reached confluency, the plate was shaken to remove microglia. For splitting, the cultures were washed with HBSS and trypsinised for 5 min at 37°C. Cells were suspended in 10 ml of supplemented DMEM and plated in 1:1 dilution in 6‐well plate (for conditioned media experiments) or 12‐well plates with poly‐D‐lysine‐coated coverslips (for imaging experiments). The cells used in experiments were passaged 2–3 times. For part of the 3D reconstruction, astrocytes were transfected with myristoylated GFP with Lipofectamine 2000 (Thermo Fisher Scientific, Cat. No. 11668027).
Neuronal stimulation
Aβ oligomers or fibrils were added to the culture at DIV17–21 for 40 min or 3 days at 500 nM final concentrations (DMSO control diluted 1:10,000). To block binding site of PrP to Aβ oligomers, cells were incubated for 30 min with anti‐PrP (6D11) mouse monoclonal antibody (Covance, Cat. No. SIG‐39810) diluted 1:500 prior to treatment with Aβ oligomers. In TNFα neutralising experiments, a TNFα neutralisation antibody (1:5,000, R&D Systems, Cat. No. AF‐510‐NA) or 20 μM of WP9QY (Bachem, Cat. No. N‐1685) (TNFR antagonist 48) was co‐applied with Aβos. To block GluN2B, 5 μM ifenprodil (Tocris, Cat. No. 0545) was co‐applied together with Aβ oligomers. For TNF stimulation, 1.8 nM rat TNFα (PeproTech, Cat. No. 400‐14) was applied to the culture for 40 min. For inhibition of p38MAPK, 10 μM SB203580 (Cell Signaling, Cat. No. 5633) was applied 30 min prior to Aβ oligomer or 1.8 nM TNFα treatment. For experiments with glia‐conditioned media, astrocytic cultures were treated for 40 min with Aβ oligomers, cells were fixed and stained, and the medium was used for neuronal stimulation or ELISA assay. For TNFα experiments, conditioned media was incubated for 24 h with or without anti‐TNFα antibody at 4°C. Afterwards, the medium was brought to 37°C and applied to neurons in a ratio of 400 μl of neuronal media and 350 μl of glia‐conditioned media per well of 12 well plate.
TNFα ELISA
For TNFα ELISA, astrocytes were plated on T75 flask. Prior to application of Aβ oligomers, the supplemented DMEM was changed to serum‐free DMEM. 500 nM of Aβ1‐42 or Aβ3(pE)‐42 was added to the cultures. After 13 h, the medium was collected and cells were lysed in 3 ml of hypotonic buffer (10 mM HEPES, 1.5 mM MgCl2, 10 mM KCl) for 20 min. The lysate was briefly spun down and assayed with rat TNFα Quantikine ELISA (R&D Systems, Cat. No. RTA00) according to the manufacturer's protocol.
HEK293T transfection
Confluent HEK293T cells were transfected with calcium phosphate method with PrP‐GFP or GPI‐GFP (kind gift from M. Heine). One day after transfection, cells were treated with Aβ oligomers for 40 min, fixed and stained as described below.
Neuronal extracts preparation and immunoblotting
Dissociated, rat, hippocampal cell cultures at DIV17–19 were treated for 40 min with Aβ1‐42 or Aβ3(pE)‐42 oligomers. The coverslips were washed with ice‐cold Tris‐buffered saline (TBS), and the neurons were scrapped in TBS with protease inhibitor cocktail (Sigma‐Aldrich, Cat. No. 000000011836170001) and phosphatase inhibitor cocktail (Sigma‐Aldrich, Cat. No. 00000004906845001). The extracts were separated on 5–20% gradient gels by SDS–PAGE. For p38MAPK activation, the membranes were probed with antibodies detecting rabbit (rb) anti‐phospho‐p38MAPK (1:1,000, Cell Signaling, Cat. No. 9211) or rb anti‐p38MAPK (1:1,000, Cell Signaling, Cat. No. 9212). All membranes were subsequently probed with rb anti‐histone 3 (1:1,000, New England Biolabs, Cat. No. 4499) antibody as a loading control. To test for presence of microglia, the membranes were cut and probed with antibodies detecting guinea pig (gp) anti‐Iba‐1 (1:1,000, SySy, Cat. No. 234 004), rb anti‐GFAP (1:1,000, Sigma‐Aldrich, Cat. No. G‐9269) or mouse (ms) anti‐NeuN (1:1,000, Millipore, Cat. No. MAB 377) with organotypic slices extract prepared in similar way as neuronal extract as positive control.
Immunocytochemistry
Following stimulation, cells were fixed in 4% paraformaldehyde (PFA) for 10 min at room temperature. After washing in PBS, cells were blocked for 1 h at room temperature in blocking buffer (2% glycine, 2% BSA, 0.2% gelatine and 50 mM NH4Cl). The primary antibodies were applied rb anti‐pJacob‐Ser180 33 (1:500), rb anti‐Jacob 60 (1:300), rb anti‐pCREB Ser133 (1:500, Cell Signalling, Cat. No. 9198), rb anti‐CREB (1:500, Cell Signalling, Cat. No. 4820), ms anti‐Aβ1‐42, clone 82E1 (1:1,000, IBL, Cat. No. 10323), rb anti‐Aβ3(pE)‐42 (1:1,000, SySy, Cat. No. 218 003), gp anti‐Synaptophysin (1:500, SySy, Cat. No. 101 004), ms anti‐Homer1 (1:500, SySy, Cat. No. 160 001), gp anti‐Iba‐1 (1:500, SySy, Cat. No. 234 004), rb anti‐GFAP (1:1,000, Sigma‐Aldrich, Cat. No. G‐9269) and were diluted in blocking buffer and incubated overnight at 4°C. Following incubation with primary antibody, coverslips were washed in PBS and incubated for 1 h at room temperature with secondary antibodies diluted 1:1,000 in blocking buffer conjugated with Alexa Fluor (AF); donkey anti‐rabbit AF568 (1:750, Invitrogen, Cat. No. A10042), goat anti‐mouse AF647 (1:750, Invitrogen, Cat. No. A‐21235). After washing for 1 h, cells were incubated with pre‐labelled (AF488) anti‐MAP2 antibody (1:1,000, Millipore, Cat. No. AB2290A4) or phalloidin conjugated with AF488 (1:1,000, Thermo Fisher Scientific, Cat. No. A12379). The coverslips were extensively washed and incubated with 1 μg/ml DAPI (Sigma‐Aldrich, Cat. No. D9542) in PBS. Coverslips were mounted in Mowiol (Polysciences Inc., Cat. No. 17951) and kept at 4°C.
Confocal laser scan microscopy and quantitative ICC
Images were acquired using Leica TCS SP5. To quantify changes of pCREB, CREB, pJacob and Jacob in the nucleus cell somas were scanned sequentially with detection of AF568, AF488 (for MAP2) and DAPI. The optical sections were acquired along Z‐axis with 0.42 μm Z resolution. Fiji program 61 was used for intensity quantification. Two nuclear sections were overlaid, and staining intensity (in arbitrary units of pixel intensity) was measured within regions of interest (ROI) defined by DAPI staining. The images showing localisation of Aβ oligomers in glial or neuronal culture were also acquired with confocal microscope. The cells were selected on the basis of phalloidin (glia culture) or MAP2 staining and scanned sequentially with detection of AF568 (Aβ3(pE)‐42) or AF647 (Aβ1‐42). The scan parameters were set based on control cells stained without primary antibody. For representative images, linear contrast enhancement was applied. Final figures were prepared with Adobe Illustrator software. For 3D reconstruction of astrocytes, images were acquired with 0.250 μm Z resolution and processed with Imaris (Bitplane) software. For visualisation purpose, the phalloidin or myristoylated GFP (mGFP) channel was used to create a semi‐transparent surface.
Synapse quantification and Sholl analysis
On DIV21 500 nM Aβ oligomers were applied for 3 days. To quantify synapse number, images of secondary dendrites (MAP2), Synaptophysin and Homer1 were acquired with fluorescent microscope (Zeiss Imager A2, 63× objective). The images were processed in Fiji software, applying 0.1% histogram normalisation (synaptic staining channel, all analysed pictures). After creating composite image for Homer1 and Synaptophysin, colocalising signals were counted on the dendritic branches of ca. 30 μm length. To ensure better image quality, representative images were acquired with Leica TCS SP5 microscope. For Sholl analysis, images of GFP‐ or RFP‐transfected neurons were acquired with fluorescence microscope (Zeiss Imager A2, 10× objective). The concentric circles (radius step 10 μm) were drawn with Concentric Circles Fiji plug‐in. The crossings of dendrites with each circle were counted manually by a researcher blind to the experimental conditions.
Whole‐cell voltage‐clamp recording of mEPSCs
Miniature excitatory postsynaptic currents (mEPSCs) of hippocampal primary neurons (DIV16–18) were recorded under whole‐cell voltage‐clamp conditions using 3–5 MΩ pipettes filled with an intracellular solution containing (in mM): KCl 135, EGTA 1, HEPES 10, Mg2+‐ATP 4, Na‐GTP 1, pH 7.4 with KOH (290 mOsm). 0.5 μM tetrodotoxin (TTX, Tocris, Cat. No. 1078) and 5 μM bicuculline were routinely added to the extracellular solution containing (in mM): NaCl 140, KCl 5, CaCl2 2, MgCl2 0.8, HEPES 10, glucose 10, pH 7.4 with NaOH (300 mOsm), to block spontaneous action potential generation and GABAA receptors. Neurons plated on coverslips were transferred to a RC26 GLP recording chamber (Warner Instruments, USA) mounted on a Leica TCS SP2 microscope equipped with 40× water dipping objective and were perfused with extracellular solution at a rate of 1 ml/min. The temperature in the recording chamber (25°C) was controlled by a TC344B dual temperature controller (Warner Instruments). The perfusion of external solution was switched off to add DMSO or Aβ oligomers to the chamber. The volume of the external solution inside the chamber was kept at 1 ml, and 10 μl DMSO, 10 μl Aβ1‐42 and 100 μl Aβ3(pE)‐42 were added to achieve the final concentrations of 500 nM amyloid Aβ1‐42 and Aβ3(pE)‐42. mEPSCs were recorded between 10 and 45 min after the addition of DMSO or the peptides mentioned. Axopatch 200B (Molecular Devices, USA) amplifier controlled with Clampex 10 software (Molecular Devices) was used for recording the mEPSC current traces. Membrane potential was held at −60 mV, and current traces were filtered at 2 kHz low‐pass basal filter and digitised at 10 kHz with Digidata 1440A (Molecular Devices, USA). Continuous recording of current traces were followed by offline analysis by using Minianalysis 6 software, and Prism 5 was used for statistical analysis. Only whole‐cell voltage‐clamp recordings from cells with a membrane resistance of 150–350 MΩ and a holding current of < 200 pA were included in the analysis.
Hippocampal organotypic slices and IHC
Hippocampi were dissected from P9 C57/B6J mice and cut into 350‐μm sections. Sections were transferred onto the membranes (Millipore) (3–4 per membrane) and cultured in OHSC medium (50% minimal essential medium (Gibco, Cat. No. 21090‐022), 25% heat‐inactivated horse serum (Gibco, Cat. No. 26050‐088), 25 mM glucose, 2 mM glutamine, 25 mM HEPES, B27 and 1% of penicillin/streptomycin) in 37°C, 5% CO2 and 95% humidity. After 2 days, the slices were cultured for 12 days at 35°C, 5% CO2 and 95% humidity, with regular medium change every 3 day. Before stimulation, viability of slices was checked by means of propidium iodide uptake. Aβ oligomers were added directly to the medium and kept for 3 days. Then, slices were fixed for 1 h at room temperature in 4% PFA. Following fixation, slices were washed with PBS, removed from the membranes, snap‐frozen on metal block three times and transferred to 48‐well plate. After blocking with 20% BSA for 1.5 h at room temperature, slices were incubated with primary antibody diluted in 5% BSA gp anti‐Iba‐1 (1:300, SySy, Cat. No. 234 004), rb anti‐GFAP (1:300, Sigma‐Aldrich, Cat. No. G‐9269) at 4°C. After washing with PBS, slices were incubated for 3.5 h at room temperature with secondary antibodies conjugated with Alexa Fluor diluted 1:400: donkey anti‐rabbit AF568 (Invitrogen, Cat. No. A10042), goat anti‐mouse AF647 (Invitrogen, Cat. No. A‐21235). After washing, slices were incubated for 10 min in 1 μg/ml DAPI (Sigma‐Aldrich, Cat. No. D9542) in PBS. Sections were mounted Mowiol (Polysciences Inc., Cat. No. 17951), and images were acquired with Leica TCS SP5 20× water objective. Images of five focal planes were overlaid. For Iba‐1‐positive cells, quantification cells were counted using Imaris software on whole slice surface. For GFAP, the fluorescence intensity was measured within ROI of the same size in CA1 (selected based on DAPI) region using Fiji software.
Calcium imaging
Hippocampal neurons were treated with 500 nM Aβ oligomers for 3 days with or without 5 μM ifenprodil (Tocris). 10 min prior to imaging neurons were incubated with 1 μM Fluo‐4 AM (Thermo Fisher Scientific, Cat. No. F14201). For imaging, coverslips were transferred to imaging chamber. Images of one plane were acquired with Leica TCS SP5 63× objective at 37°C for 10 min at 1 Hz frequency (excitation 488 Argon laser) and saved as image stacks for further offline analysis. For each stack, 4–6 ROIs surrounding perisomatic region of neurons were manually selected for calculation of the mean fluorescence over time. After removal of low‐frequency DC component (time constant 10 s), resulting temporal profiles were used for threshold‐based detection of calcium spikes (± 4 standard deviations computed separately for each cell). Calcium spikes were considered as synchronised if they occurred within the sliding detection window (width 1 s) in two or more individual cells. Signal processing and detection of spikes were carried out using Spike2 software (Cambridge Electronic Design, Cambridge, UK).
Bioluminescence resonance energy transfer
HEK‐293T cells were co‐transfected with 0.4 μg of cDNA for GluN11a‐RLuc (BRET donor), 0.4 μg of cDNA for GluN2B‐myc and with increasing amounts 0.1–1.2 μg of cDNA for mGlu5‐YFP (BRET acceptor). A subset of cells was co‐transfected with 0.4 μg of PrP. Cells were treated with 500 nM Aβ1‐42 or Aβ3(pE)‐42 for 4 h and compared to untreated control groups. To quantify GluN11a‐YFP expression, cells (20 μg protein) were kept in 96‐well plates (black plates with a transparent bottom), and fluorescence was read in the Fluo Star Optima Fluorimeter using a 10 nm bandwidth excitation filter at 400 nm reading. Protein fluorescence expression was determined as fluorescence of the sample minus the fluorescence of cells expressing the BRET donor alone. For BRET measurements, the equivalent of 20 μg of cell suspension was distributed in 96‐well plates (white plates) and 5 μM coelenterazine H (Molecular Probes, Cat. No. C6780) was added. After 1 min, the readings were collected using a Mithras LB 940 (Berthold Technologies, Germany) that allows the integration of the signals detected in the short‐wavelength filter at 485 nm and the long‐wavelength filter at 530 nm. To quantify mGlu5‐RLuc expression, luminescence readings were also performed after 10 min of adding 5 μM coelenterazine H. The averages come from at least three independent experiments.
TBA2.1 and 5XFAD animals
The 5XFAD (+/−) animals 62 were kind gift from Prof. Dr. A. Dityatev. The TBA2.1 (tg/tg) mice were kind gift from ProBiodrug. These mice overexpress the Aβ3(pE)‐42 peptide driven by Thy‐1 promoter. The upstream sequence coding for pre/pro‐peptide of murine thyrotropin‐releasing hormone leads to cleavage within the trans‐Golgi and vesicular secretion of Aβ3(pE)‐42 51. Both lines had C57BL/6 background.
Acute hippocampal slices, measurement of baseline activity and LTP
Hippocampal slices from C57/B6J mice (12–16 weeks old, male), 5XFAD (+/−, 44–47 weeks old, female, n = 4) or TBA2.1 (tg/tg, 12–14 weeks old, male, n = 6) were prepared according to previously described protocol 41. Slices from C57/B6J mice were placed in pre‐chamber for 2 h with 500 nM Aβ oligomers. For rescue experiment, SKF38393 (5 μM, Tocris, Cat. No. 0922) was co‐applied with oligomers or slices were incubated for 30 min with 0.2 μg/ml anti‐TNFα antibody prior to incubation with oligomers. The anti‐TNFα antibody was present throughout the complete experiment. Next, slices were left to recover for at least 30 min in the recording chamber. Field excitatory postsynaptic potentials (fEPSPs) were measured in stratum radiatum after stimulation of CA1 Schaffer‐collateral fibres with ACSF glass capillary microelectrodes (3–5 MΩ). fEPSPs were amplified by Extracellular Amplifier (EXT‐02B, npi, Germany) and digitised at a sample frequency of 5 kHz by Digidata 1201 plus AD/Da converter (CED, UK). The strength of stimuli was adjusted to 40–50% of the maximum fEPSP slope values. Single stimuli were applied at 0.0333 Hz and averaged every 5 min. Stable baseline recordings were followed by tetanisation with 3 × 1 s stimulus trains at 100 Hz with a 10‐min inter‐train interval and double‐pulse width (0.2 ms).
Statistics
Statistical analyses were carried out with GraphPad Prism software. Data are represented as mean ± s.e.m. One‐way ANOVA followed by Tukey's multiple comparison test or two‐tailed Student's t‐test was used for comparison of groups. For Sholl analysis, two‐way ANOVA was used to compare variances; for comparison of single points, Student's t‐test was used. For LTP experiments, averages from 210 to 240 min posttetanisation were compared by one‐way ANOVA followed by Bonferroni's multiple comparison test. For Ca2+ imaging, one‐way ANOVA followed by Duncan's multiple comparison test was performed separately for groups with and without ifenprodil. For quantification of immunoblots, a Mann–Whitney U‐test was used.
Author contributions
KMG and MRK designed the study and wrote the paper. KMG performed experiments and data analysis excluding: LTP experiments performed by PY; BRET experiments by GB; mEPSC recordings by GS; native PAGE, DLS, ANS performed by RR; TEM performed by MS; and Ca2+ traces analysis performed by AB. JB contributed to establishment of readouts, preparation and characterisation of Aβ oligomers, organotypic slices culture and staining protocol. H‐UD and SS provided Aβ1‐42 and Aβ3(pE)‐42. H‐UD and MRK supervised the project.
Conflict of interest
The authors declare that they have no conflict of interest.
Supporting information
Appendix
Expanded View Figures PDF
Source Data for Expanded View and Appendix
Review Process File
Acknowledgements
The authors gratefully acknowledge the professional technical assistance of C. Borutzki, S. Hochmuth and M. Marunde. We would like to thank O. Kobler and T. Stöter for support in the image analysis; D. Ramsbeck for synthesis of Aβ; M. Wermann and D. Schlenzig for help with SEC and the ThT assay; and M. Heine for providing plasmids. Supported by grants from the Bundesministerium für Bildung und Forschung “Energi” FKZ: 01GQ1421B, Deutsche Forschungsgemeinschaft (DFG Kr1879/5‐1, 6‐1; SFB779 TPB8), The EU Joint Programme—Neurodegenerative Disease Research (JPND) project STAD, WGL Pakt f. Forschung, People Programme (Marie Curie Actions) of the European Union's Seventh Framework Programme FP7/2007‐2013/under REA grant agreement no. [289581], H2020 Priority Excellent Science, Marie Sklodowska‐Curie Actions (MSCA) MC‐ITN NPlast, and Pakt für Forschung by Leibniz‐Association.
EMBO Reports (2017) 18: 962–981
References
- 1. Selkoe DJ, Hardy J (2016) The amyloid hypothesis of Alzheimer's disease at 25 years. EMBO Mol Med 8: 595–608 [DOI] [PMC free article] [PubMed] [Google Scholar]
- 2. Viola KL, Klein WL (2015) Amyloid beta oligomers in Alzheimer's disease pathogenesis, treatment, and diagnosis. Acta Neuropathol 129: 183–206 [DOI] [PMC free article] [PubMed] [Google Scholar]
- 3. Jawhar S, Wirths O, Bayer TA (2011) Pyroglutamate amyloid‐beta (Abeta): a hatchet man in Alzheimer disease. J Biol Chem 286: 38825–38832 [DOI] [PMC free article] [PubMed] [Google Scholar]
- 4. Kummer MP, Heneka MT (2014) Truncated and modified amyloid‐beta species. Alzheimers Res Ther 6: 28 [DOI] [PMC free article] [PubMed] [Google Scholar]
- 5. Saido TC, Yamao‐Harigaya W, Iwatsubo T, Kawashima S (1996) Amino‐ and carboxyl‐terminal heterogeneity of beta‐amyloid peptides deposited in human brain. Neurosci Lett 215: 173–176 [DOI] [PubMed] [Google Scholar]
- 6. Bayer TA, Wirths O (2014) Focusing the amyloid cascade hypothesis on N‐truncated Abeta peptides as drug targets against Alzheimer's disease. Acta Neuropathol 127: 787–801 [DOI] [PMC free article] [PubMed] [Google Scholar]
- 7. Hosoda R, Saido TC, Otvos L Jr, Arai T, Mann DM, Lee VM, Trojanowski JQ, Iwatsubo T (1998) Quantification of modified amyloid beta peptides in Alzheimer disease and down syndrome brains. J Neuropathol Exp Neurol 57: 1089–1095 [DOI] [PubMed] [Google Scholar]
- 8. Harigaya Y, Saido TC, Eckman CB, Prada CM, Shoji M, Younkin SG (2000) Amyloid beta protein starting pyroglutamate at position 3 is a major component of the amyloid deposits in the Alzheimer's disease brain. Biochem Biophys Res Commun 276: 422–427 [DOI] [PubMed] [Google Scholar]
- 9. Perez‐Garmendia R, Gevorkian G (2013) Pyroglutamate‐modified amyloid beta peptides: emerging targets for Alzheimer s disease immunotherapy. Curr Neuropharmacol 11: 491–498 [DOI] [PMC free article] [PubMed] [Google Scholar]
- 10. Saido TC, Iwatsubo T, Mann DM, Shimada H, Ihara Y, Kawashima S (1995) Dominant and differential deposition of distinct beta‐amyloid peptide species, A beta N3(pE), in senile plaques. Neuron 14: 457–466 [DOI] [PubMed] [Google Scholar]
- 11. Mandler M, Rockenstein E, Ubhi K, Hansen L, Adame A, Michael S, Galasko D, Santic R, Mattner F, Masliah E (2012) Detection of peri‐synaptic amyloid‐beta pyroglutamate aggregates in early stages of Alzheimer's disease and in AbetaPP transgenic mice using a novel monoclonal antibody. J Alzheimers Dis 28: 783–794 [DOI] [PMC free article] [PubMed] [Google Scholar]
- 12. Nussbaum JM, Schilling S, Cynis H, Silva A, Swanson E, Wangsanut T, Tayler K, Wiltgen B, Hatami A, Ronicke R et al (2012) Prion‐like behaviour and tau‐dependent cytotoxicity of pyroglutamylated amyloid‐beta. Nature 485: 651–655 [DOI] [PMC free article] [PubMed] [Google Scholar]
- 13. Schlenzig D, Manhart S, Cinar Y, Kleinschmidt M, Hause G, Willbold D, Funke SA, Schilling S, Demuth HU (2009) Pyroglutamate formation influences solubility and amyloidogenicity of amyloid peptides. Biochemistry 48: 7072–7078 [DOI] [PubMed] [Google Scholar]
- 14. Russo C, Violani E, Salis S, Venezia V, Dolcini V, Damonte G, Benatti U, D'Arrigo C, Patrone E, Carlo P et al (2002) Pyroglutamate‐modified amyloid beta‐peptides–AbetaN3(pE)–strongly affect cultured neuron and astrocyte survival. J Neurochem 82: 1480–1489 [DOI] [PubMed] [Google Scholar]
- 15. Schilling S, Lauber T, Schaupp M, Manhart S, Scheel E, Bohm G, Demuth HU (2006) On the seeding and oligomerization of pGlu‐amyloid peptides (in vitro). Biochemistry 45: 12393–12399 [DOI] [PubMed] [Google Scholar]
- 16. Dewachter I, Filipkowski RK, Priller C, Ris L, Neyton J, Croes S, Terwel D, Gysemans M, Devijver H, Borghgraef P et al (2009) Deregulation of NMDA‐receptor function and down‐stream signaling in APP[V717I] transgenic mice. Neurobiol Aging 30: 241–256 [DOI] [PubMed] [Google Scholar]
- 17. Kessels HW, Nabavi S, Malinow R (2013) Metabotropic NMDA receptor function is required for beta‐amyloid‐induced synaptic depression. Proc Natl Acad Sci USA 110: 4033–4038 [DOI] [PMC free article] [PubMed] [Google Scholar]
- 18. Malinow R (2012) New developments on the role of NMDA receptors in Alzheimer's disease. Curr Opin Neurobiol 22: 559–563 [DOI] [PMC free article] [PubMed] [Google Scholar]
- 19. Shankar GM, Bloodgood BL, Townsend M, Walsh DM, Selkoe DJ, Sabatini BL (2007) Natural oligomers of the Alzheimer amyloid‐beta protein induce reversible synapse loss by modulating an NMDA‐type glutamate receptor‐dependent signaling pathway. J Neurosci 27: 2866–2875 [DOI] [PMC free article] [PubMed] [Google Scholar]
- 20. Renner M, Lacor PN, Velasco PT, Xu J, Contractor A, Klein WL, Triller A (2010) Deleterious effects of amyloid beta oligomers acting as an extracellular scaffold for mGluR5. Neuron 66: 739–754 [DOI] [PMC free article] [PubMed] [Google Scholar]
- 21. Um JW, Kaufman AC, Kostylev M, Heiss JK, Stagi M, Takahashi H, Kerrisk ME, Vortmeyer A, Wisniewski T, Koleske AJ et al (2013) Metabotropic glutamate receptor 5 is a coreceptor for Alzheimer abeta oligomer bound to cellular prion protein. Neuron 79: 887–902 [DOI] [PMC free article] [PubMed] [Google Scholar]
- 22. Wang Q, Walsh DM, Rowan MJ, Selkoe DJ, Anwyl R (2004) Block of long‐term potentiation by naturally secreted and synthetic amyloid beta‐peptide in hippocampal slices is mediated via activation of the kinases c‐Jun N‐terminal kinase, cyclin‐dependent kinase 5, and p38 mitogen‐activated protein kinase as well as metabotropic glutamate receptor type 5. J Neurosci 24: 3370–3378 [DOI] [PMC free article] [PubMed] [Google Scholar]
- 23. Larson M, Sherman MA, Amar F, Nuvolone M, Schneider JA, Bennett DA, Aguzzi A, Lesne SE (2012) The complex PrP(c)‐Fyn couples human oligomeric Abeta with pathological tau changes in Alzheimer's disease. J Neurosci 32: 16857–16871 [DOI] [PMC free article] [PubMed] [Google Scholar] [Retracted]
- 24. Lauren J, Gimbel DA, Nygaard HB, Gilbert JW, Strittmatter SM (2009) Cellular prion protein mediates impairment of synaptic plasticity by amyloid‐beta oligomers. Nature 457: 1128–1132 [DOI] [PMC free article] [PubMed] [Google Scholar]
- 25. Um JW, Strittmatter SM (2013) Amyloid‐beta induced signaling by cellular prion protein and Fyn kinase in Alzheimer disease. Prion 7: 37–41 [DOI] [PMC free article] [PubMed] [Google Scholar]
- 26. Um JW, Nygaard HB, Heiss JK, Kostylev MA, Stagi M, Vortmeyer A, Wisniewski T, Gunther EC, Strittmatter SM (2012) Alzheimer amyloid‐beta oligomer bound to postsynaptic prion protein activates Fyn to impair neurons. Nat Neurosci 15: 1227–1235 [DOI] [PMC free article] [PubMed] [Google Scholar]
- 27. He P, Zhong Z, Lindholm K, Berning L, Lee W, Lemere C, Staufenbiel M, Li R, Shen Y (2007) Deletion of tumor necrosis factor death receptor inhibits amyloid beta generation and prevents learning and memory deficits in Alzheimer's mice. J Cell Biol 178: 829–841 [DOI] [PMC free article] [PubMed] [Google Scholar]
- 28. Heneka MT, Carson MJ, Khoury JE, Landreth GE, Brosseron F, Feinstein DL, Jacobs AH, Wyss‐Coray T, Vitorica J, Ransohoff RM et al (2015) Neuroinflammation in Alzheimer's disease. Lancet Neurol 14: 388–405 [DOI] [PMC free article] [PubMed] [Google Scholar]
- 29. Heppner FL, Ransohoff RM, Becher B (2015) Immune attack: the role of inflammation in Alzheimer disease. Nat Rev Neurosci 16: 358–372 [DOI] [PubMed] [Google Scholar]
- 30. Hardingham GE, Bading H (2010) Synaptic versus extrasynaptic NMDA receptor signalling: implications for neurodegenerative disorders. Nat Rev Neurosci 11: 682–696 [DOI] [PMC free article] [PubMed] [Google Scholar]
- 31. Li S, Jin M, Koeglsperger T, Shepardson NE, Shankar GM, Selkoe DJ (2011) Soluble Abeta oligomers inhibit long‐term potentiation through a mechanism involving excessive activation of extrasynaptic NR2B‐containing NMDA receptors. J Neurosci 31: 6627–6638 [DOI] [PMC free article] [PubMed] [Google Scholar]
- 32. España J, Valero J, Minano‐Molina AJ, Masgrau R, Martin E, Guardia‐Laguarta C, Lleo A, Gimenez‐Llort L, Rodriguez‐Alvarez J, Saura CA (2010) Beta‐Amyloid disrupts activity‐dependent gene transcription required for memory through the CREB coactivator CRTC1. J Neurosci 30: 9402–9410 [DOI] [PMC free article] [PubMed] [Google Scholar]
- 33. Karpova A, Mikhaylova M, Bera S, Bar J, Reddy PP, Behnisch T, Rankovic V, Spilker C, Bethge P, Sahin J et al (2013) Encoding and transducing the synaptic or extrasynaptic origin of NMDA receptor signals to the nucleus. Cell 152: 1119–1133 [DOI] [PubMed] [Google Scholar]
- 34. Gomes GM, Dalmolin GD, Bar J, Karpova A, Mello CF, Kreutz MR, Rubin MA (2014) Inhibition of the polyamine system counteracts beta‐amyloid peptide‐induced memory impairment in mice: involvement of extrasynaptic NMDA receptors. PLoS One 9: e99184 [DOI] [PMC free article] [PubMed] [Google Scholar]
- 35. Rönicke R, Mikhaylova M, Ronicke S, Meinhardt J, Schroder UH, Fandrich M, Reiser G, Kreutz MR, Reymann KG (2011) Early neuronal dysfunction by amyloid beta oligomers depends on activation of NR2B‐containing NMDA receptors. Neurobiol Aging 32: 2219–2228 [DOI] [PubMed] [Google Scholar]
- 36. Dieterich DC, Karpova A, Mikhaylova M, Zdobnova I, Konig I, Landwehr M, Kreutz M, Smalla KH, Richter K, Landgraf P et al (2008) Caldendrin‐Jacob: a protein liaison that couples NMDA receptor signalling to the nucleus. PLoS Biol 6: e34 [DOI] [PMC free article] [PubMed] [Google Scholar]
- 37. Hu NW, Klyubin I, Anwyl R, Rowan MJ (2009) GluN2B subunit‐containing NMDA receptor antagonists prevent Abeta‐mediated synaptic plasticity disruption in vivo . Proc Natl Acad Sci USA 106: 20504–20509 [DOI] [PMC free article] [PubMed] [Google Scholar]
- 38. Rush T, Buisson A (2014) Reciprocal disruption of neuronal signaling and Abeta production mediated by extrasynaptic NMDA receptors: a downward spiral. Cell Tissue Res 356: 279–286 [DOI] [PubMed] [Google Scholar]
- 39. Jurgensen S, Antonio LL, Mussi GE, Brito‐Moreira J, Bomfim TR, De Felice FG, Garrido‐Sanabria ER, Cavalheiro EA, Ferreira ST (2011) Activation of D1/D5 dopamine receptors protects neurons from synapse dysfunction induced by amyloid‐beta oligomers. J Biol Chem 286: 3270–3276 [DOI] [PMC free article] [PubMed] [Google Scholar]
- 40. Walsh DM, Klyubin I, Fadeeva JV, Rowan MJ, Selkoe DJ (2002) Amyloid‐beta oligomers: their production, toxicity and therapeutic inhibition. Biochem Soc Trans 30: 552–557 [DOI] [PubMed] [Google Scholar]
- 41. Yuan Xiang P, Janc O, Grochowska KM, Kreutz MR, Reymann KG (2016) Dopamine agonists rescue Abeta‐induced LTP impairment by Src‐family tyrosine kinases. Neurobiol Aging 40: 98–102 [DOI] [PubMed] [Google Scholar]
- 42. Dohler F, Sepulveda‐Falla D, Krasemann S, Altmeppen H, Schlüter H, Hildebrand D, Zerr I, Matschke J, Glatzel M (2014) High molecular mass assemblies of amyloid‐β oligomers bind prion protein in patients with Alzheimer's disease. Brain 3: 873–886 [DOI] [PubMed] [Google Scholar]
- 43. Perroy J, Raynaud F, Homburger V, Rousset MC, Telley L, Bockaert J, Fagni L (2008) Direct interaction enables cross‐talk between ionotropic and group I metabotropic glutamate receptors. J Biol Chem 283: 6799–6805 [DOI] [PubMed] [Google Scholar]
- 44. Floden AM, Li S, Combs CK (2005) Beta‐amyloid‐stimulated microglia induce neuron death via synergistic stimulation of tumor necrosis factor alpha and NMDA receptors. J Neurosci 25: 2566–2575 [DOI] [PMC free article] [PubMed] [Google Scholar]
- 45. McCoy MK, Tansey MG (2008) TNF signaling inhibition in the CNS: implications for normal brain function and neurodegenerative disease. J Neuroinflammation 5: 45–53 [DOI] [PMC free article] [PubMed] [Google Scholar]
- 46. Stellwagen D, Malenka RC (2006) Synaptic scaling mediated by glial TNF‐alpha. Nature 440: 1054–1059 [DOI] [PubMed] [Google Scholar]
- 47. White JA, Manelli AM, Holmberg KH, Van Eldik LJ, Ladu MJ (2005) Differential effects of oligomeric and fibrillar amyloid‐beta 1‐42 on astrocyte‐mediated inflammation. Neurobiol Dis 18: 459–465 [DOI] [PubMed] [Google Scholar]
- 48. Takasaki W, Kajino Y, Kajino K, Murali R, Greene MI (1997) Structure‐based design and characterization of exocyclic peptidomimetics that inhibit TNF alpha binding to its receptor. Nat Biotechnol 12: 1266–1270 [DOI] [PubMed] [Google Scholar]
- 49. Xu H, Czerwinski P, Förstermann U, Li H (2015) Downregulation of BDNF expression by PKC and by TNF‐α in human endothelial cells. Pharmacology 2: 1–10 [DOI] [PubMed] [Google Scholar]
- 50. Kimura R, Ohno M (2009) Impairments in remote memory stabilization precede hippocampal synaptic and cognitive failures in 5XFAD Alzheimer mouse model. Neurobiol Dis 33: 229–235 [DOI] [PMC free article] [PubMed] [Google Scholar]
- 51. Alexandru A, Jagla W, Graubner S, Becker A, Bauscher C, Kohlmann S, Sedlmeier R, Raber KA, Cynis H, Ronicke R et al (2011) Selective hippocampal neurodegeneration in transgenic mice expressing small amounts of truncated Abeta is induced by pyroglutamate‐Abeta formation. J Neurosci 31: 12790–12801 [DOI] [PMC free article] [PubMed] [Google Scholar]
- 52. Chen X, Lin R, Chang L, Xu S, Wei X, Zhang J, Wang C, Anwyl R, Wang Q (2013) Enhancement of long‐term depression by soluble amyloid beta protein in rat hippocampus is mediated by metabotropic glutamate receptor and involves activation of p38MAPK, STEP and caspase‐3. Neuroscience 253: 435–443 [DOI] [PubMed] [Google Scholar]
- 53. Wang Q, Wu J, Rowan MJ, Anwyl R (2005) Beta‐amyloid inhibition of long‐term potentiation is mediated via tumor necrosis factor. Eur J Neurosci 22: 2827–2832 [DOI] [PubMed] [Google Scholar]
- 54. Schlenzig D, Ronicke R, Cynis H, Ludwig HH, Scheel E, Reymann K, Saido T, Hause G, Schilling S, Demuth HU (2012) N‐Terminal pyroglutamate formation of Abeta38 and Abeta40 enforces oligomer formation and potency to disrupt hippocampal long‐term potentiation. J Neurochem 121: 774–784 [DOI] [PubMed] [Google Scholar]
- 55. Bhaskar K, Maphis N, Xu G, Varvel NH, Kokiko‐Cochran ON, Weick JP, Staugaitis SM, Cardona A, Ransohoff KH, Lamb BT (2014) Microglial derived tumor necrosis factor‐α drives Alzheimer's disease‐related neuronal cell cycle events. Neurobiol Dis 62: 273–285 [DOI] [PMC free article] [PubMed] [Google Scholar]
- 56. Nielsen HM, Mulder SD, Belien JA, Musters RJ, Eikelenboom P, Veerhuis R (2010) Astrocytic A beta 1‐42 uptake is determined by A beta‐aggregation state and the presence of amyloid‐associated proteins. Glia 58: 1235–1246 [DOI] [PubMed] [Google Scholar]
- 57. Pihlaja R, Koistinaho J, Malm T, Sikkila H, Vainio S, Koistinaho M (2008) Transplanted astrocytes internalize deposited beta‐amyloid peptides in a transgenic mouse model of Alzheimer's disease. Glia 56: 154–163 [DOI] [PubMed] [Google Scholar]
- 58. Liu CC, Kanekiyo T, Xu H, Bu G (2013) Apolipoprotein E and Alzheimer disease: risk, mechanisms and therapy. Nat Rev Neurol 9: 106–118 [DOI] [PMC free article] [PubMed] [Google Scholar]
- 59. Klein WL (2002) Abeta toxicity in Alzheimer's disease: globular oligomers (ADDLs) as new vaccine and drug targets. Neurochem Int 41: 345–352 [DOI] [PubMed] [Google Scholar]
- 60. Spilker C, Nullmeier S, Grochowska KM, Schumacher A, Butnaru I, Macharadze T, Gomes GM, Yuanxiang P, Bayraktar G, Rodenstein C et al (2016) A Jacob/Nsmf gene knockout results in hippocampal dysplasia and impaired BDNF signaling in dendritogenesis. PLoS Genet 12: e1005907 [DOI] [PMC free article] [PubMed] [Google Scholar]
- 61. Schindelin J, Arganda‐Carreras I, Frise E, Kaynig V, Longair M, Pietzsch T, Preibisch S, Rueden C, Saalfeld S, Schmid B et al (2012) Fiji: an open‐source platform for biological‐image analysis. Nat Methods 9: 676–682 [DOI] [PMC free article] [PubMed] [Google Scholar]
- 62. Oakley H, Cole SL, Logan S, Maus E, Shao P, Craft J, Guillozet‐Bongaarts A, Ohno M, Disterhoft J, Van Eldik L et al (2006) Intraneuronal β‐amyloid aggregates, neurodegeneration, and neuron loss in transgenic mice with five familial Alzheimer's disease mutations: potential factors in amyloid plaque formation. Neurobiol Dis 26: 10129–10140 [DOI] [PMC free article] [PubMed] [Google Scholar]
Associated Data
This section collects any data citations, data availability statements, or supplementary materials included in this article.
Supplementary Materials
Appendix
Expanded View Figures PDF
Source Data for Expanded View and Appendix
Review Process File


