

Abstract
Phosphorylation patterns of the C‐terminal domain (CTD) of largest subunit of RNA polymerase II (called the CTD code) orchestrate the recruitment of RNA processing and transcription factors. Recent studies showed that not only serines and tyrosines but also threonines of the CTD can be phosphorylated with a number of functional consequences, including the interaction with yeast transcription termination factor, Rtt103p. Here, we report the solution structure of the Rtt103p CTD‐interacting domain (CID) bound to Thr4 phosphorylated CTD, a poorly understood letter of the CTD code. The structure reveals a direct recognition of the phospho‐Thr4 mark by Rtt103p CID and extensive interactions involving residues from three repeats of the CTD heptad. Intriguingly, Rtt103p's CID binds equally well Thr4 and Ser2 phosphorylated CTD. A doubly phosphorylated CTD at Ser2 and Thr4 diminishes its binding affinity due to electrostatic repulsion. Our structural data suggest that the recruitment of a CID‐containing CTD‐binding factor may be coded by more than one letter of the CTD code.
Keywords: NMR, RNA processing, RNAPII CTD code, structural biology
Subject Categories: Post-translational Modifications, Proteolysis & Proteomics; Structural Biology; Transcription
Introduction
RNA polymerase II (RNAPII) utilizes a long and flexible carboxyl‐terminal domain (CTD) of its largest subunit to specifically recruit protein/RNA‐binding factors during transcription 1, 2, 3, 4, 5. The CTD consists of tandem repeats with conserved consensus Tyr1‐Ser2‐Pro3‐Thr4‐Ser5‐Pro6‐Ser7 that is repeated 26 times in yeast and 52 times in humans 6. The CTD sequence is post‐translationally phosphorylated at serines (Ser2, Ser5 and Ser7) and Tyr1 in a dynamic manner, yielding specific patterns that are recognized by appropriate factors in coordination with the transcription cycle events 3, 4, 5, 7.
Additionally another highly conserved position, Thr4, was reported to be phosphorylated both in yeast and humans 8, 9, 10, 11, 12. However, the levels of pThr4 in cells remain controversial based on two recent mass‐spectrometry studies 10, 11. Substitution of Thr4 to Ala (T4A) or Val (T4V) is lethal for chicken and human cells 12, 13, 14; however, the same mutants are viable in yeast 9, 15, 16. In humans, genomewide studies revealed increasing levels of pThr4 throughout the gene body with the peak after the poly‐A site 12. In agreement with this, the T4A mutant showed defect in transcription elongation 12. In yeast, the pThr4‐mark is enriched along the whole gene body, similarly to the pTyr1‐mark 17. Both marks go down prior recruitment of transcription termination factors 17. Therefore, it was suggested that the pThr4 mark along with the pTyr1‐mark prevent binding of transcription termination factors during transcription elongation 17. However, recent high resolution ChiP‐nexus data suggested a different role for the pThr4 mark involved in transcription termination and post‐transcriptional splicing 18.
It has been unclear for a long time what protein factors are recruited through the pThr4 signal. Interestingly, yeast transcription termination factor, Rtt103p, well known to be associated with the pSer2‐mark 17, 19, 20, was identified as a part of the interactome of RNAPII phosphorylated at Thr4 18. Based on the overlay of NET‐seq and ChIP‐nexus profiles, Rtt103p coincides with the pThr4 mark after poly‐A site. Both, deletion of the entire Rtt103p protein or expression of Rpb1 T4V CTD mutant, cause similar RNAPII pausing defect after poly‐A site. The authors suggested a model, in which both pSer2 and pThr4 marks can contribute to the recruitment of Rtt103p to the poly‐A site 18. This concept is also supported by recent mass‐spectrometry analyses of RNAPII CTD population pulled down by Rtt103p, which revealed simultaneous presence of pThr4 and pSer2 marks 11.
To understand the puzzling roles of the pSer2 and pThr4 marks in recruitment of transcription termination factor Rtt103p, we solved NMR structure of the pThr4 CTD peptide in complex with Rtt103p CTD‐interacting domain (CID). Our structure reveals for the first time a direct readout of the pThr4 mark within the CTD. We also reveal significantly larger interaction area of Rtt103p with the CTD peptide than previously reported 20. Next, we show that two adjacently positioned phosphorylations, pSer2 followed by pThr4, inhibit the binding of Rtt103p CID due to a charge–charge repulsion of the two closely positioned phosphate moieties. Finally, we propose that the CTD code is degenerated, as Rtt103p reads the pThr4 and pSer2 marks equally well using the same molecular mechanism.
Results and Discussion
Rtt103p CID binds equally well Thr4 and Ser2 phosphomarks
To test the binding affinity of Rtt103p CID towards pThr4‐CTD in vitro, we performed an equilibrium‐binding assay using fluorescence anisotropy (FA) (Fig 1B). The experiment revealed that Rtt103p binds pThr4‐CTD with a K D of 15 ± 1 μM, which is 2.5 times weaker binding than to the CTD with the pSer2 mark (K D = 6.0 ± 0.2 μM). This finding is in a good agreement with previous co‐immunoprecipitation studies, where Rtt103p was pulled down by RNAPII with the pThr4 mark and successfully competed out by pSer2‐CTD or pThr4‐CTD antisera 18. Doubly phosphorylated pThr4‐CTD at both Thr4 displayed increased binding affinity due to avidity effects (K D = 6 ± 0.2 μM). Remarkably, if the pSer2 and pThr4 marks are positioned adjacently, binding affinity (K D = 43 ± 2 μM) is lowered almost to the level of non‐phosphorylated CTD (K D = 64 ± 2 μM). The pSer5 phosphorylation mark was also previously shown to abolish and lower the binding with Rtt103p or its close human homologue 20, 21. Next, we introduced the pTyr1 mark to the central heptad of the CTD peptide, which completely abolished the binding with Rtt103p (Fig 1B). This suggests that Y1b is accommodated in the hydrophobic pocket following the previously established binding model for CIDs 17.
Figure 1. How CTD phosphorylations modulate binding to Rtt103p CID .
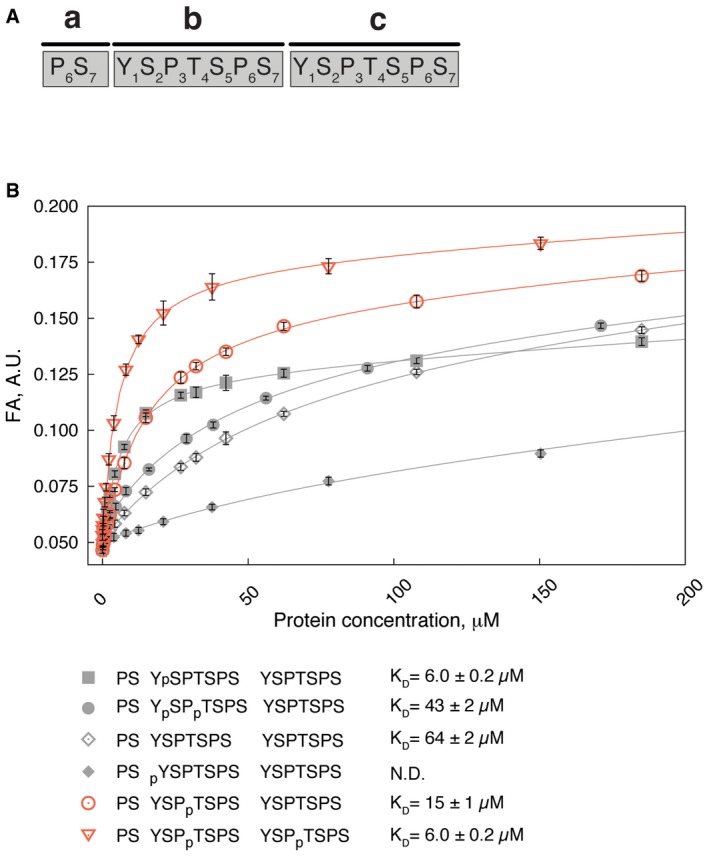
- Numbering of residues and order of heptad repeats of the CTD peptide used throughout the study.
- Equilibrium binding of Rtt103p CID with fluorescently labelled CTD peptides monitored by fluorescence anisotropy (FA). Rtt103p CID titrated into 10 nM FAM‐labelled CTD peptides. Peptide sequences, corresponding binding isotherms and dissociation constant (K D, ± standard deviation of the fit) are shown. FAM, 5,6‐carboxyfluorescein. N.D., not determined.
NMR structure of Rtt103p CID bound to CTD with phospho‐threonine mark
To reveal the structural basis of pThr4 recognition, we solved solution structure of a reconstituted complex that harbours Rtt103p CID (3‐131) and a 16‐amino acid peptide, pThr4‐CTD (PS YSP(pT)SPS YSPTSPS; Fig 2A–C; Table 1). We used this peptide with a single phosphorylation to avoid binding in multiple registers that would complicate NMR data analyses. The resulted structure of Rtt103p CID is formed by eight α‐helices in a right‐handed superhelical arrangement (Fig 2A and B), out of which helices α2, α4 and α7 contact the pThr4‐CTD peptide at residues P6a, S7a, Y1b, P3b, pT4b, S7b and Y1c (Figs 2B and C, and EV1). This minimal CTD‐binding moiety binds Rtt103p CID with a K D of 18 ± 1 μM (assayed by FA), which is almost identical as pThr4‐CTD used for structural determination. The structure is similar to the one of Rtt103p CID–pSer2‐CTD complex 20 in terms of the overall CID fold and the conformation of the N‐terminal part of the CTD peptide, but entirely different for the C‐terminal part of the CTD peptide (Figs 3, EV1, and EV2).
Figure 2. Solution structure of Rtt103p CID in complex with pThr4‐CTD.
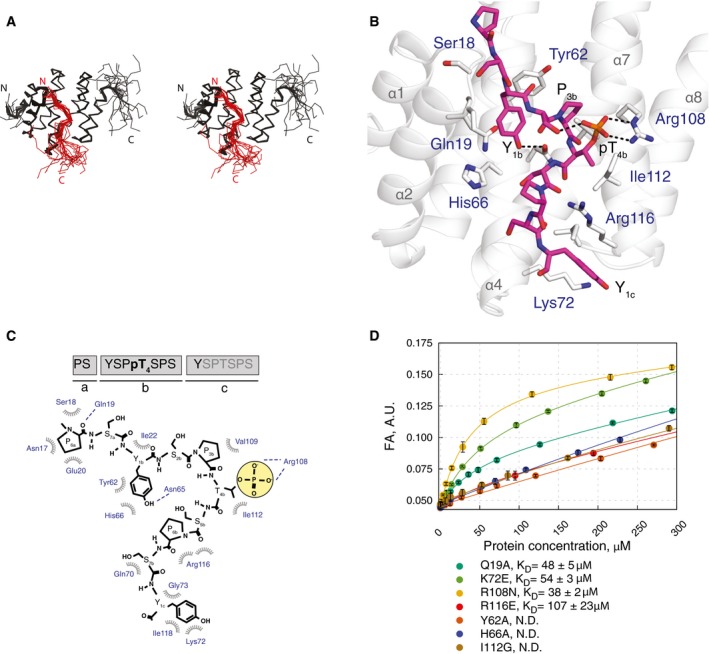
- Overlay of the 20 lowest energy structures of Rtt103p CID (black ribbon) complexed with pThr4‐CTD (red ribbon) shown in stereo. N‐ and C‐termini of the protein and peptide are indicated.
- Solution structure of Rtt103p CID (grey helices) bound to the pThr4‐CTD peptide (magenta sticks). Highlighted Rtt103p CID residues (grey sticks, blue labels) form hydrophobic contacts and putative hydrogen bonds (dashed black lines) with pThr4‐CTD peptide.
- Schematic diagram of Rtt103p CID (blue) and pThr4‐CTD (black) interactions (hydrophobic contacts, spoked arcs; hydrogen bonds, dashed lines).
- Equilibrium binding of Rtt103p CID mutants with pThr4‐CTD peptide monitored by fluorescence anisotropy (FA). Rtt103p CID mutants titrated into 10 nM FAM‐labelled CTD peptides. Corresponding binding isotherms and K Ds (± standard deviation of the fit) are shown. FAM, 5,6‐carboxyfluorescein. N.D., not determined.
Table 1.
NMR and refinement statistics for the Rtt103p CID‐pThr4 CTD complex
| Rtt103p CID–pThr4 CTD complex | |
|---|---|
| NMR distance & dihedral constraints | |
| Distance restraints | |
| Total NOEs | 3,639 |
| Intra‐residue | 843 |
| Inter‐residue | 2,796 |
| Short | 1,691 |
| Medium | 1,104 |
| Long | 844 |
| Hydrogen bonds | 99 |
| Intermolecular distance restraints | 47 |
| Total dihedral angle restraintsa | 198 |
| Structure statistics b | |
| Violations (mean and s.d.) | |
| Number of distance restraint violations > 0.5 Å | 0.10 ± 0.31 |
| Number of dihedral angle restraint violations > 15° | 13.8 ± 2.33 |
| Maximum dihedral angle restraint violation (°) | 39.57 ± 9.55 |
| Maximum distance constraint violation (Å) | 0.30 ± 0.12 |
| Deviations from idealized geometryb | |
| Bond lengths (Å) | 0.00355 ± 0.00008 |
| Bond angles (°) | 1.702 ± 0.012 |
| Average pairwise r.m.s.d. (Å)b | |
| Rtt103p CID (7–12; 19–31; 36–48; 54–73; 77–94; 100–116; 121–133) | |
| Heavy atoms | 0.91 ± 0.13 |
| Backbone atoms | 0.25 ± 0.05 |
| CTD (143–152) | |
| Heavy atoms | 2.06 ± 0.42 |
| Backbone atoms | 1.42 ± 0.34 |
| Complex | |
| All complex heavy atoms | 1.12 ± 0.16 |
| All complex backbone atoms | 0.61 ± 0.14 |
| Ramachandran plot statisticsc | |
| Residues in most favoured regions (%) | 88.5 |
| Residues in additionally allowed regions (%) | 10.1 |
| Residues in generously allowed regions (%) | 0.9 |
| Residues in disallowed regions (%) | 0.5 |
α‐helical dihedral angle restraints imposed for the backbone based on the CSI.
Calculated for an ensemble of the 20 lowest energy structures.
Based on PROCHECK analysis 42.
Figure EV1. Comparison of Rtt103p CID structures bound to differently phosphorylated CTD .

-
A, BComparison of Rtt103p CID (grey helices) bound to the (A) pThr4‐CTD (magenta sticks; PDB ID: 5LVF) or (B) to the pSer2‐CTD peptide (yellow sticks; PDB ID: 2L0I.). Rtt103p CID residues involved in the interaction with CTD are shown in grey sticks and labelled with blue font. Sequences of peptides used in structure determination are indicated below the structures. Peptide residues shown on the image are highlighted in red and black font; the residues highlighted in red have intermolecular contacts used for the structure calculation; residues in grey are not displayed for clarity reasons or are missing coordinates.
Figure 3. Degeneracy of the CTD code.
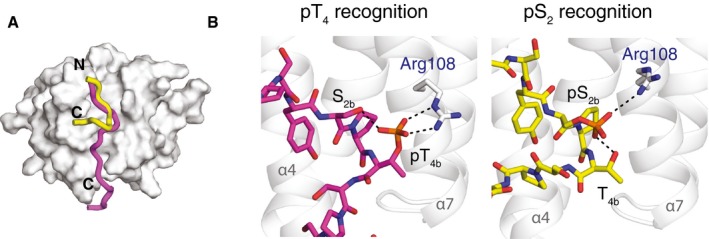
- Superposition of pThr4‐CTD (magenta; PDB ID: 5LVF) and pSer2‐CTD (yellow; PDB ID: 2L0I) peptides on the Rtt103p CID surface (grey). N‐ and C‐termini of the peptides are indicated.
- Close view on the phospho‐recognition site of Rtt103p CID. Interaction of pThr4‐ (magenta sticks, left) and pSer2‐CTD (yellow sticks, right) peptides with Arg108 (grey). Hydrogen bonds of the phospho‐groups are indicated with black dashed lines.
Figure EV2. Rtt103p CID interacts with pSer2‐CTD and pThr4‐CTD using the same canonical interface.
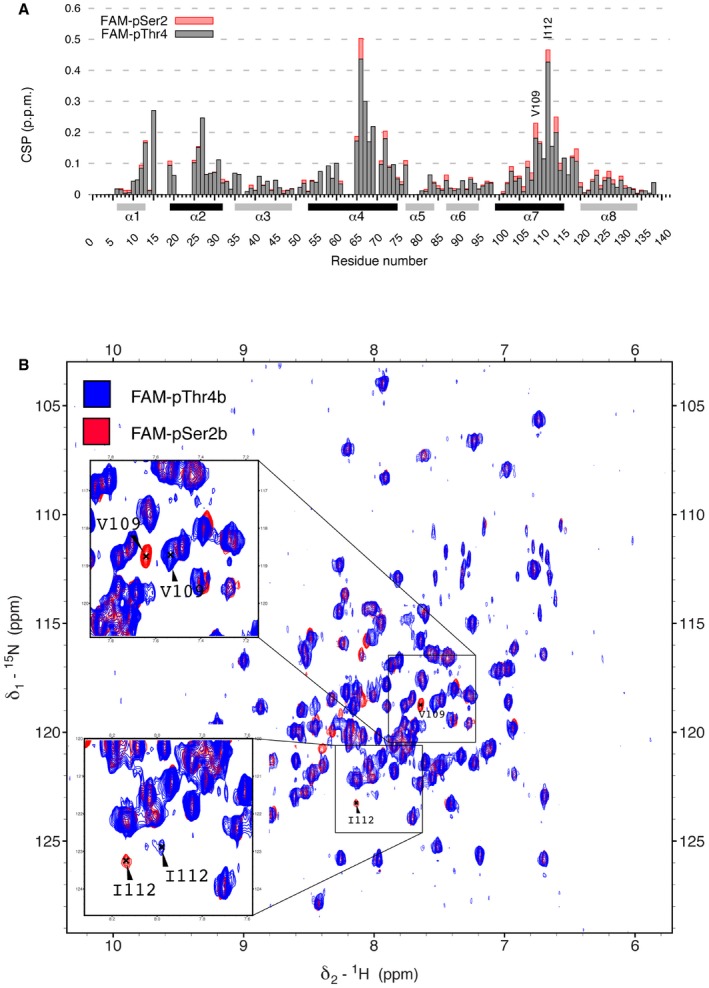
- Chemical shift perturbations (CSP) of the Rtt103p CID upon interaction with FAM‐pSer2 CTD (red) or FAM‐pThr4 CTD (grey) peptides plotted against residue number of Rtt103p CID. Secondary structure elements are shown below the x‐axis. Helices involved in the interaction with phospho‐peptides are coloured in black. FAM, 5,6‐carboxyfluorescein.
- Overlay of 1H‐15N TROSY spectra of complex of Rtt103p CID with FAM‐pSer2 (red) and FAM‐pThr4 (blue).
Recognition of the phospho‐threonine CTD by Rtt103p
The upstream part of the pThr4‐CTD peptide adopts a β‐turn conformation at S2bP3bpT4bS5b and docks into a hydrophobic pocket of the Rtt103p CID that is formed by Ile22, Tyr62, His66, Val109 and Ile112, using Y1b and P3b residues (Fig 2B and C). The peptide conformation in the hydrophobic pocket is further stabilized by a hydrogen bond between hydroxyl of Y1b and the side‐chain amide of Asn65. This hydrophobic pocket of Rtt103p is highly conserved, and mutations of residues Tyr62 and His66 (not affecting the structural integrity; Fig EV3) completely abolish the binding with pThr4‐CTD (Figs 2D and EV4). P3b is inserted into the hydrophobic pocket next to Val109 and has a trans conformation of the S2bP3b peptidyl‐prolyl bond. As a result of this arrangement, both the S2b and pT4b side chains are positioned closely to each other in the solvent exposed area and form intramolecular hydrogen bond between the hydroxyl group of S2b and phospho‐group of T4b. The phospho‐group of pT4b forms a hydrogen bond with the guanidinium group of Arg108. This is a critical interaction with the pThr4 mark, as confirmed by the affinity data for the Arg108Asn mutant (Fig 2D). Akin to Rtt103p, also other CID‐containing proteins such as SCAF4/8 22, RPRD1A/1B/2 21 and CHERP 21 contain the equivalent arginine in the CID pocket. It will be interesting to see whether these human proteins really recognize pThr4‐CTD as well and whether the pThr4 mark is relevant to their functions. Other CID‐containing proteins in yeast, such as Nrd1p and Pcf11p, do not contain the equivalent arginine and these proteins were absent in the pThr4‐CTD interactome 18.
Figure EV3. Structural integrity of Rtt103p CID mutants.
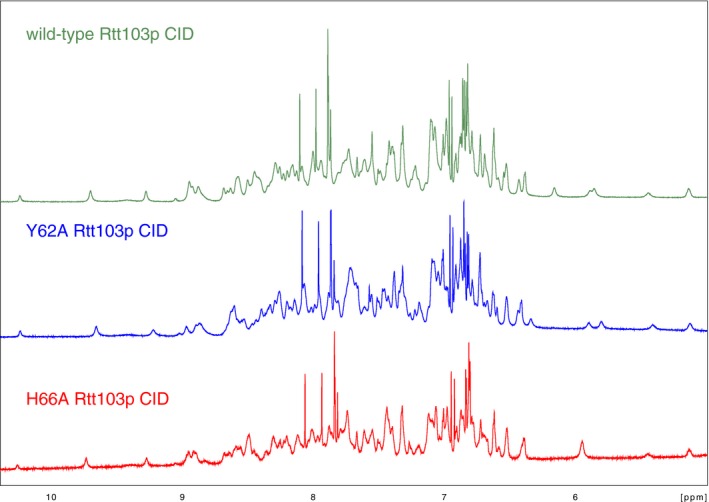
Comparison of 1H NMR spectra of the wild type (green), Y62A (blue) and H66A (red) mutants of Rtt103p CID; the region with NH backbone and side‐chain resonances is shown. Data were collected on 850 MHz Bruker AVANCE III spectrometer at 293 K.
Figure EV4. Structural sequence alignment of CIDs.

Sequence alignment of CID based on superposition of the CID structures (PDB IDs: 2KM4, 4NAC, 4FLB, 3CLJ, 2BF0, 3D9I) using Align tool of UCSF Chimera 40. In this type of alignment, residue types are not used, only their spatial proximities. Yellow boxes highlight structured elements; red boxes show key residues responsible for the CTD recognition according to numbering of Rtt103p.
Remarkably, we observed multiple strong intermolecular NOEs among the aromatics of Y1c in the downstream region of the CTD peptide and the C‐terminal parts of helices α4 and α7 (Figs 2C, EV1, and EV5). The interaction of Y1c at the tip of helices α4 and α7 creates a second turn in the peptide at residues pT4bS5bP6bS7b, bringing two backbone carbonyl groups in close proximity and allows for their interaction with the guanidinium group of Arg116 (Figs 2B and C, and EV1). The side chain of Y1c forms numerous hydrophobic contacts with Lys72, Gly73, Ile118. Arg116Glu and Lys72Glu charge swapping mutants cause affinity drop of K D = 107 ± 23 μM and K D = 54 ± 3 μM, respectively (Fig 2D). The similar arrangement of the downstream region of the CTD was observed in the crystal structure of close human homologue of Rtt103p CID, RPRD1A, where the arginine forms a hydrogen bond with carbonyl of T4b and P6b 21. The Arg116 position is conserved in RPRD1A/1B (Arg114) and RPRD2 (Arg130) (Fig EV4) 21. Interestingly, the coordination of tyrosine from the third heptad repeat Y1c was not observed previously in the structure of Rtt103p CID bound to the CTD with Ser2 phosphorylation 20. The previous study used a CTD peptide lacking the complete binding moiety (PS YSPTSPS Y) that possibly precluded the accommodation of the downstream part of CTD peptide including the second tyrosine (Y1c; Fig EV1). The comparison of chemical shift perturbations of Rtt103p upon binding to the singly phosphorylated pSer2‐CTD and pThr4‐CTD peptides with complete binding moiety suggests similar accommodation of downstream region of both peptides (Fig EV2).
Figure EV5. Intermolecular contacts between the Y1c and Rtt103p CID .

Strip plots from 3D F1‐13C/15N‐filtered NOESY‐[13C‐1H]‐HSQC showing intermolecular contacts between Y1c and Arg116 (left) and Ile118 (middle, right).
Cis‐trans equilibrium of the Ser–Pro prolyl‐peptidyl bond
We also tested as to whether two proximal phosphorylation marks (pSer2/pThr4) on the CTD peptide can alter the cis‐trans equilibrium of the neighbouring prolyl‐peptidyl bond (Fig EV6A). It has been shown that the cis‐trans equilibrium of the CTD is critical for its recognition by cognate proteins 23, 24, 25 and the trans conformation of the Ser–Pro prolyl‐peptidyl bond is required for the β‐turn formation 20, 23, 26, 27. To exclude the possibility that a highly populated cis conformer would attenuate the binding of the CTD peptide with two phospho‐marks, we assayed the conformational population of mono‐ and diphosphorylated peptides using the [1H,13C]‐HSQC spectra of PS Y(pS)13CP(pT)SPS YS and PS YS13CP(pT)SPS YS peptides, where all P3b carbons were 13C‐isotopically labelled (Fig EV6B). In case of pThr4‐CTD, we observed 6.6% of the cis conformer. We obtained virtually identical number for the pSer2pThr4‐CTD peptide, where the cis conformation was populated at 7.8%. Our data suggest that the double phosphorylation at pSer2/pThr4 of the CTD does not influence the ratio of cis‐trans conformers. Next, we titrated the PS YS13CP(pT)SPS YS peptide with Rtt103p CID and monitored the titration by [1H,13C]‐HSQC experiment (Fig EV6C). The spectra show the disappearance of peaks that correspond to the cis conformation during titration, indicating a shift in the cis‐trans equilibrium towards the trans conformation of the S2b–P3b prolyl‐peptidyl bond that is required for the β‐turn formation. The peaks corresponding to the trans conformation of P3b moved upon titration with protein, reflecting the accommodation of the proline in the hydrophobic pocket of Rtt103p CID.
Figure EV6. Double phosphorylation of CTD does not influence serine–proline peptide bond isomerization state population.
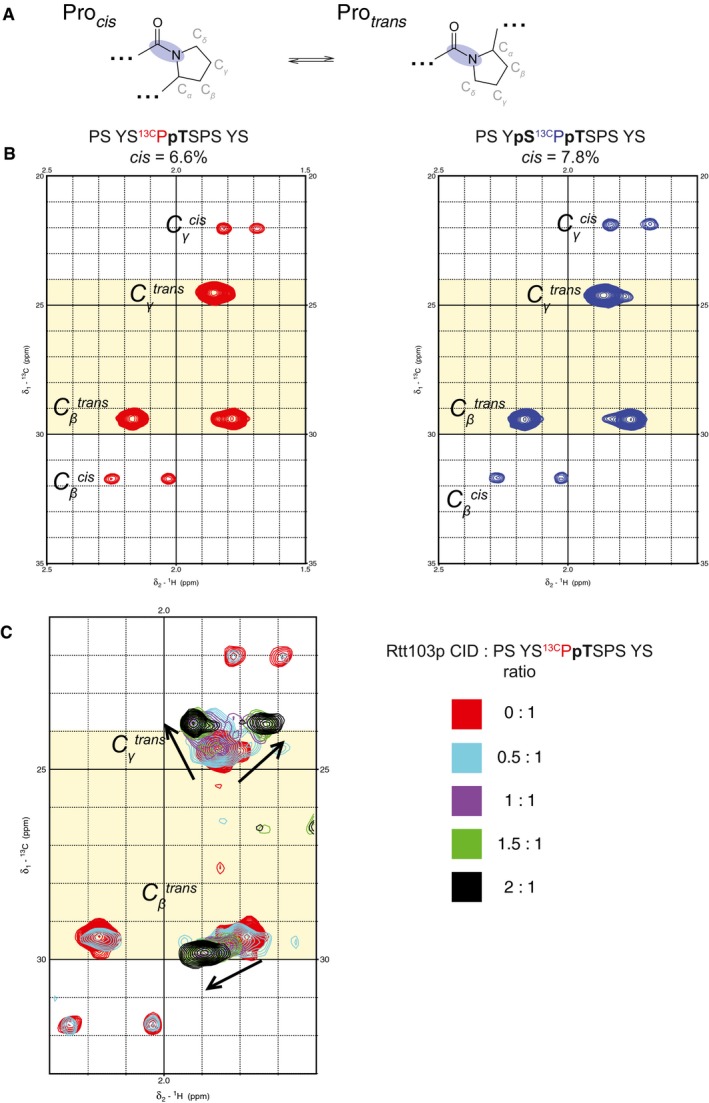
- Scheme of cis‐ and trans‐isomers of X‐proline peptide bond (X stands for any amino acid). Peptide bond is highlighted in blue.
- To establish conformational populations of mono‐ and di‐phosphorylated peptides, [13C,1H] HSQC spectra of CTD peptides were measured. Comparison of [13C,1H] HSQC spectra of PSYS13CPpTSPSYS (left) and PSYpS13CPpTSPSYS (right). 1H‐13C correlations of β and γ C‐H pairs are shown. Trans‐chemical shift region of Cγ/β highlighted in yellow 41.
- Overlay of [13C,1H] HSQC spectra from the NMR titration of the PSYS13CPpTSPSYS peptide with non‐labelled Rtt103p CID. Protein–peptide molar ratios for each titration step and corresponding colour of the spectrum are indicated on the right.
CTD code degeneration
The complex of Rtt103p CID–pThr4‐CTD reported here represents the first structure capturing the recognition of the CTD phosphorylated at threonine and explains the structural basis of why Rtt103p can be a part of the pSer2‐ and pThr4‐CTD interactomes. Previous reports suggested that Thr4 phosphorylations could interfere with CTD binding by destabilizing the β‐turn conformation that is required for CTD binding 17, 26. However, our structure shows that the pThr4 mark is directly recognized by Rtt103p and also that the phosphate group of pThr4 forms intramolecular hydrogen bond stabilizing the bound CTD conformation. This conformation involves the β‐turn at S2bP3bpT4bS5b that is a prerequisite for an effective docking into the hydrophobic pocket of Rtt103p CID (Figs 2B and C, and 3). Interestingly, the intramolecular hydrogen bond that stabilizes the β‐turn mirrors the one of the Ser2 phosphorylated CTD bound to Rtt103p (Fig 3B). The Rtt103p Arg108Asn mutant has also a similar drop in affinity for pThr4‐CTD and pSer2‐CTD, K D = 38 ± 2 μM and K D = 44 ± 2 μM, respectively. These observations suggest that CTD modifications preventing intramolecular stabilization of the β‐turn should negatively affect CTD binding. Indeed, we observed that doubly phosphorylated CTD at Ser2 and Thr4 binds to Rtt103p as weak as unmodified CTD (Fig 1). Electrostatic repulsion between closely arranged phosphates of pSer2 and pThr4 interfere with the formation of the bound CTD conformation and the peptide with pSer2/pThr4 marks cannot be accommodated in the binding pocket of Rtt103p (Fig 3). In support of this, the coexistence of the pSer2/pThr4 marks in the same repeat has not been detected by recent mass‐spectrometry analysis of RNAPII CTD population pulled down by Rtt103p 11. Our structure also explains lethality of the Thr4Glu CTD mutant in yeast 18. Permanent substitution for glutamate mimics Thr4 phosphorylation that interferes with Ser2 phosphorylation, which consequently prevents binding of the CTD to cognate proteins as described above.
The individual letters of the CTD code have so far been associated with unique information translated to stimulation or inhibition of recruitment of CTD readers. Comparison of Rtt103p CID–pThr4‐CTD structure with the Rtt103p CID–pSer2‐CTD complex shows fascinating feature that the same interaction pocket of Rtt103p can read two different phosphorylation patterns of the CTD (pSer2 and pThr4) using the same mechanism and involves the same residues (mainly Arg108; Fig 3). Based on our structural findings, we suggest that the CTD code can be degenerated when read by CID‐containing proteins. In other words, the recruitment of a single CTD‐binding factor may be coded by more than one letter of the CTD code. As a consequence of this redundancy, CID‐containing CTD‐binding factors can be recruited to the poorly conserved heptad repeats of the CTD (e.g. the CTD of fruit fly) or they can tolerate some errors or imperfections in phosphorylation of the CTD 1, 3, 28.
Materials and Methods
Cloning and protein purification
pET28b‐Rtt103p CID was a gift from B. Lunde 20. Rtt103p CID point mutants were obtained by QuikChange site‐directed mutagenesis kit (Stratagene). Resulting constructs were verified by DNA sequencing and then transformed into E. coli BL21‐Codon Plus (DE3)‐RIPL cells (Stratagene). Rtt103p CID (3‐131–6xHIS) was expressed and purified as previously described 20.
NMR measurements and structure determination
All NMR spectra for the backbone and side‐chain assignments were recorded on Bruker AVANCE III HD 950, 850 and 700 MHz spectrometers equipped with cryoprobes at a sample temperature of 20°C using 1 mM uniformly 15N,13C‐labelled Rtt103p CID in 35 mM KH2PO4, 100 mM KCl, pH 6.8 (20°C) (90% H2O/10% D2O). Initial backbone resonance frequency assignment was transferred from BMRB entries 17044 and 16411 and confirmed by HNCA spectrum. The spectra were processed using TOPSPIN 3.2 (Bruker Biospin), and the protein resonances were assigned manually using Sparky software (Goddard T.G. and Kneller D.G., University of California, San Francisco). For the assignment of the side‐chain proton and carbon resonances, 4D version of HCCH TOCSY 29 was measured with a non‐uniform sampling. Acquired data were processed and analysed analogously as described previously 30, 31.
All distance constraints were derived from the three‐dimensional 15N‐ and 13C‐edited NOESYs collected on a 950 MHz spectrometer. Additionally, intermolecular distance constraints were obtained from the three‐dimensional F1‐13C/15N‐filtered NOESY‐[13C,1H]‐HSQC experiment 32, 33, with a mixing time of 150 ms on a 950 MHz spectrometer. The NOEs were semi‐quantitatively classified based on their intensities in the 3D NOESY spectra. The initial structure determinations of the Rtt103p‐CTD complex were performed with the automated NOE assignment module implemented in the CYANA 3.97 program 34. Then, the CYANA‐generated restraints along with manually assigned protein‐CTD intermolecular restraints were used for further refinement of the preliminary structures with AMBER16 software 35. These calculations employed a modified version (AMBER ff14SB) of the force field 36, using a protocol described previously 37, 38. The 20 lowest energy conformers were selected (out of 50 calculated) to form the final ensemble of structures. The atomic coordinates for the NMR ensemble of the Rtt103p CID‐pThr4‐CTD complex have been deposited in the Protein Data Bank under ID code 5LVF and in Biological Magnetic Resonance Bank under ID code 34041. Molecular graphics were generated using PyMOL (The PyMOL Molecular Graphics System, Version 1.8 Schrödinger, LLC).
Fluorescence anisotropy
The equilibrium binding of Rtt103p CID constructs to differently phosphorylated CTD was analysed by fluorescence anisotropy. The CTD peptides were N‐terminally labelled with the 5,6‐carboxyfluorescein (FAM). The measurements were conducted on a FluoroLog‐3 spectrofluorometer (Horiba Jobin‐Yvon Edison, NJ). The instrument was equipped with a thermostatted cell holder with a Neslab RTE7 water bath (Thermo Scientific). Samples were excited with vertically polarized light at 467 nm, and both vertical and horizontal emissions were recorded at 516 nm. All measurements were conducted at 10°C in 35 mM KH2PO4, 100 mM KCl (pH 6.8). Each data point is an average of three measurements. The experimental binding isotherms were analysed by DynaFit using 1:1 model with non‐specific binding 39.
Cis‐trans population estimation
For the estimation of the cis‐trans population of conformers around the Ser‐Pro peptide bond, aliphatic [13C,1H]‐HSQC was collected using 1 mM sample of peptide PSYS13CP(pT)SPSYS or PSY(pS)13CP(pT)SPSYS in 35 mM KH2PO4, 100 mM KCl (pH 6.8) in 90% H2O/10% D2O at 20°C on Bruker AVANCE III HD 700 MHz spectrometer. For the [13C,1H]‐HSQC titration experiment, 0.2 mM PSYS13CP(pT)SPSYS peptide was used and 1.2 mM Rtt103p CID stock was added. 1H‐13Cγ and 1H‐13Cβ peaks were integrated using Sparky routine (Goddard T.G. and Kneller D.G., University of California, San Francisco). Population was estimated as a ratio of the peak volume of a given conformation to the sum of volumes of all conformations.
Determination of chemical shift perturbation (CSP) value
Chemical shift perturbation (CSP) value is defined as the normalized length of a vector E j, whose components are differences δ ji between observed chemical shifts (bound form) and chemical shifts from a reference experiment (free form). Index j represents the amino acid type within the primary sequence of the protein. Weight factors for each atom type w H = 1 and w N = 0.15 were used.
Peptides used in the study
The following peptides were synthesized by JPT (Berlin, DE) and Clonestar (Brno, CZ): FAM‐PSY(pS)PTSPSYSPTSPS; FAM‐PSYSP(pT)SPSYSPTSPS; FAM‐PSY(pS)P(pT)SPSYSPTSPS; FAM‐PSYSPTSPSYSPTSPS; FAM‐PSYSP(pT)SPSYSP(pT)SPS; FAM‐PSYSP(pT)SPSYS; FAM‐PS(pY)SPTSPSYSPTSPS; PSYSP(pT)SPSYSPTSPS; PSYS13CP(pT)SPSYS; PS Y(pS)13CP(pT)SPSYS.
Author contributions
OJ designed the experiments, prepared protein and peptide samples, measured and analysed FA, assigned spectra, calculated and refined structure, and wrote the manuscript; MK collected and processed 4D HCCH TOCSY spectra, and assisted with structure refinement; KK collected and processed NMR spectra, and assisted with structure calculation and refinement; RS designed the experiments, assisted with structure calculation and refinement, and wrote the manuscript.
Conflict of interest
The authors declare that they have no conflict of interest.
Supporting information
Expanded View Figures PDF
Review Process File
Acknowledgements
We thank K. M. Harlen and L. S. Churchman for sharing preliminary results and fruitful discussion, B. Lunde for gift of pET28b‐Rtt103p CID plasmid, T. Kabzinski for sharing pET28b‐Rtt103p CID Y62A, H66A and I112G mutant plasmids, J. Novacek for discussion, P. Kuzmic and C. Hofr for helpful advice, M. Sebesta for critical reading of the manuscript. We acknowledge the Josef Dadok National NMR Centre, CEITEC—Masaryk University, supported by the CIISB research infrastructure (LM2015043 funded by MEYS CR) for their support with obtaining scientific data presented in this article. This project has received funding from the European Research Council (ERC) under the European Union's Horizon 2020 research and innovation programme (Grant Agreement No. 649030). This publication reflects only the author's view, and the Research Executive Agency is not responsible for any use that may be made of the information it contains. The results of this research have been acquired within CEITEC 2020 (LQ1601) project with financial contribution made by the Ministry of Education, Youths and Sports of the Czech Republic within special support paid from the National Programme for Sustainability II funds. This work was also supported by the Czech Science Foundation (13‐18344S to R.S.; M.K. and K.K. were supported by 15‐24117S).
EMBO Reports (2017) 18: 906–913
Contributor Information
Olga Jasnovidova, Email: olga.jasnovidova@ceitec.muni.cz.
Richard Stefl, Email: richard.stefl@ceitec.muni.cz.
References
- 1. Meinhart A, Kamenski T, Hoeppner S, Baumli S, Cramer P (2005) A structural perspective of CTD function. Genes Dev 19: 1401–1415 [DOI] [PubMed] [Google Scholar]
- 2. Jasnovidova O, Stefl R (2013) The CTD code of RNA polymerase II: a structural view. Wiley Interdiscip Rev RNA 4: 1–16 [DOI] [PubMed] [Google Scholar]
- 3. Eick D, Geyer M (2013) The RNA polymerase II carboxy‐terminal domain (CTD) code. Chem Rev 113: 8456–8490 [DOI] [PubMed] [Google Scholar]
- 4. Zaborowska J, Egloff S, Murphy S (2016) The pol II CTD: new twists in the tail. Nat Struct Mol Biol 23: 771–777 [DOI] [PubMed] [Google Scholar]
- 5. Jeronimo C, Collin P, Robert F (2016) The RNA polymerase II CTD: the increasing complexity of a low‐complexity protein domain. J Mol Biol 428: 2607–2622 [DOI] [PubMed] [Google Scholar]
- 6. Chapman RD, Heidemann M, Hintermair C, Eick D (2008) Molecular evolution of the RNA polymerase II CTD. Trends Genet 24: 289–296 [DOI] [PubMed] [Google Scholar]
- 7. Jeronimo C, Bataille AR, Robert F (2013) The writers, readers, and functions of the RNA polymerase ii c‐terminal domain code. Chem Rev 113: 8491–8522 [DOI] [PubMed] [Google Scholar]
- 8. Sakurai H, Ishihama A (2002) Level of the RNA polymerase II in the fission yeast stays constant but phosphorylation of its carboxyl terminal domain varies depending on the phase and rate of cell growth. Genes Cells 7: 273–284 [DOI] [PubMed] [Google Scholar]
- 9. Rosonina E, Yurko N, Li W, Hoque M, Tian B, Manley JL (2014) Threonine‐4 of the budding yeast RNAP II CTD couples transcription with Htz1‐mediated chromatin remodeling. Proc Natl Acad Sci 111: 11924–11931 [DOI] [PMC free article] [PubMed] [Google Scholar]
- 10. Schüller R, Forné I, Straub T, Schreieck A, Texier Y, Shah N, Decker T‐M, Cramer P, Imhof A, Eick D (2016) Heptad‐specific phosphorylation of RNA polymerase II CTD. Mol Cell 61: 305–314 [DOI] [PubMed] [Google Scholar]
- 11. Suh H, Ficarro SB, Kang U‐B, Chun Y, Marto JA, Buratowski S (2016) Direct analysis of phosphorylation sites on the Rpb1 C‐terminal domain of RNA polymerase II. Mol Cell 61: 297–304 [DOI] [PMC free article] [PubMed] [Google Scholar]
- 12. Hintermair C, Heidemann M, Koch F, Descostes N, Gut M, Gut I, Fenouil R, Ferrier P, Flatley A, Kremmer E et al (2012) Threonine‐4 of mammalian RNA polymerase II CTD is targeted by Polo‐like kinase 3 and required for transcriptional elongation. EMBO J 31: 2784–2797 [DOI] [PMC free article] [PubMed] [Google Scholar]
- 13. Hsin J‐P, Sheth A, Manley JL (2011) RNAP II CTD phosphorylated on Threonine‐4 is required for histone mRNA 3′ end processing. Science 334: 683–686 [DOI] [PMC free article] [PubMed] [Google Scholar]
- 14. Hintermair C, Voß K, Forné I, Heidemann M, Flatley A, Kremmer E, Imhof A, Eick D (2016) Specific threonine‐4 phosphorylation and function of RNA polymerase II CTD during M phase progression. Sci Rep 6: 27401 [DOI] [PMC free article] [PubMed] [Google Scholar]
- 15. Stiller JW, McConaughy BL, Hall BD (2000) Evolutionary complementation for polymerase II CTD function. Yeast 16: 57–64 [DOI] [PubMed] [Google Scholar]
- 16. Schwer B, Shuman S (2011) Deciphering the RNA polymerase II CTD code in fission yeast. Mol Cell 43: 311–318 [DOI] [PMC free article] [PubMed] [Google Scholar]
- 17. Mayer A, Heidemann M, Lidschreiber M, Schreieck A, Sun M, Hintermair C, Kremmer E, Eick D, Cramer P (2012) CTD tyrosine phosphorylation impairs termination factor recruitment to RNA polymerase II. Science 336: 1723–1725 [DOI] [PubMed] [Google Scholar]
- 18. Harlen KM, Trotta KL, Smith EE, Mosaheb MM, Fuchs SM, Churchman LS (2016) Comprehensive RNA polymerase II interactomes reveal distinct and varied roles for each phospho‐CTD residue. Cell Rep 15: 2147–2158 [DOI] [PMC free article] [PubMed] [Google Scholar]
- 19. Kim M, Krogan NJ, Vasiljeva L, Rando OJ, Nedea E, Greenblatt JF, Buratowski S (2004) The yeast Rat1 exonuclease promotes transcription termination by RNA polymerase II. Nature 432: 517–522 [DOI] [PubMed] [Google Scholar]
- 20. Lunde BM, Reichow SL, Kim M, Suh H, Leeper TC, Yang F, Mutschler H, Buratowski S, Meinhart A, Varani G (2010) Cooperative interaction of transcription termination factors with the RNA polymerase II C‐terminal domain. Nat Struct Mol Biol 17: 1195–1201 [DOI] [PMC free article] [PubMed] [Google Scholar]
- 21. Ni Z, Xu C, Guo X, Hunter GO, Kuznetsova OV, Tempel W, Marcon E, Zhong G, Guo H, Kuo W‐HW et al (2014) RPRD1A and RPRD1B are human RNA polymerase II C‐terminal domain scaffolds for Ser5 dephosphorylation. Nat Struct Mol Biol 21: 686–695 [DOI] [PMC free article] [PubMed] [Google Scholar]
- 22. Becker R, Loll B, Meinhart A (2008) Snapshots of the RNA processing factor SCAF8 bound to different phosphorylated forms of the carboxyl‐terminal domain of RNA polymerase II. J Biol Chem 283: 22659–22669 [DOI] [PubMed] [Google Scholar]
- 23. Kubicek K, Cerna H, Holub P, Pasulka J, Hrossova D, Loehr F, Hofr C, Vanacova S, Stefl R (2012) Serine phosphorylation and proline isomerization in RNAP II CTD control recruitment of Nrd1. Genes Dev 26: 1891–1896 [DOI] [PMC free article] [PubMed] [Google Scholar]
- 24. Xiang K, Nagaike T, Xiang S, Kilic T, Beh MM, Manley JL, Tong L (2010) Crystal structure of the human symplekin‐Ssu72‐CTD phosphopeptide complex. Nature 467: 729–733 [DOI] [PMC free article] [PubMed] [Google Scholar]
- 25. Werner‐Allen JW, Lee C‐J, Liu P, Nicely NI, Wang S, Greenleaf AL, Zhou P (2011) cis‐Proline‐mediated Ser(P)5 dephosphorylation by the RNA polymerase II C‐terminal domain phosphatase Ssu72. J Biol Chem 286: 5717–5726 [DOI] [PMC free article] [PubMed] [Google Scholar]
- 26. Meinhart A, Cramer P (2004) Recognition of RNA polymerase II carboxy‐terminal domain by 3’‐RNA‐processing factors. Nature 430: 223–226 [DOI] [PubMed] [Google Scholar]
- 27. Noble CG, Hollingworth D, Martin SR, Ennis‐Adeniran V, Smerdon SJ, Kelly G, Taylor IA, Ramos A (2005) Key features of the interaction between Pcf11 CID and RNA polymerase II CTD. Nat Struct Mol Biol 12: 144–151 [DOI] [PubMed] [Google Scholar]
- 28. Buratowski S (2003) The CTD code. Nat Struct Mol Biol 10: 679–680 [DOI] [PubMed] [Google Scholar]
- 29. Kay LE, Xu GY, Singer AU, Muhandiram DR, Forman‐Kay JD (1993) A gradient‐enhanced HCCH TOCSY experiment for recording side‐chain H‐1 and C‐13 correlations in H2O samples of proteins. J Magn Reson Ser 101: 333–337 [Google Scholar]
- 30. Nováček J, Haba NY, Chill JH, Žídek L, Sklenář V (2012) 4D Non‐uniformly sampled HCBCACON and 1J(NCα)‐selective HCBCANCO experiments for the sequential assignment and chemical shift analysis of intrinsically disordered proteins. J Biomol NMR 53: 139–148 [DOI] [PubMed] [Google Scholar]
- 31. Nováček J, Zawadzka‐Kazimierczuk A, Papoušková V, Žídek L, Šanderová H, Krásný L, Koźmiński W, Sklenář V (2011) 5D 13C‐detected experiments for backbone assignment of unstructured proteins with a very low signal dispersion. J Biomol NMR 50: 1–11 [DOI] [PubMed] [Google Scholar]
- 32. Peterson RD, Theimer CA, Wu H, Feigon J (2004) New applications of 2D filtered/edited NOESY for assignment and structure elucidation of RNA and RNA‐protein complexes. J Biomol NMR 28: 59–67 [DOI] [PubMed] [Google Scholar]
- 33. Zwahlen C, Legault P, Vincent SJF, Greenblatt J, Konrat R, Kay LE (1997) Methods for measurement of intermolecular NOEs by multinuclear NMR spectroscopy: application to a bacteriophage λ N‐Peptide/boxB RNA complex. J Am Chem Soc 119: 6711–6721 [Google Scholar]
- 34. Güntert P, Buchner L (2015) Combined automated NOE assignment and structure calculation with CYANA. J Biomol NMR 62: 453–471 [DOI] [PubMed] [Google Scholar]
- 35. Case DA, Betz RM, Botello‐Smith W, Cerutti DS, Cheatham TE, Darden TA, Duke RE, Giese TJ (2016) AMBER 2016. San Francisco: University of California; [Google Scholar]
- 36. Maier JA, Martinez C, Kasavajhala K, Wickstrom L, Hauser KE, Simmerling C (2015) ff14SB: improving the accuracy of protein side chain and backbone parameters from ff99SB. J Chem Theory Comput 11: 3696–3713 [DOI] [PMC free article] [PubMed] [Google Scholar]
- 37. Stefl R, Oberstrass FC, Hood JL, Jourdan M, Zimmermann M, Skrisovska L, Maris C, Peng L, Hofr C, Emeson RB et al (2010) The solution structure of the ADAR2 dsRBM‐RNA complex reveals a sequence‐specific readout of the minor groove. Cell 143: 225–237 [DOI] [PMC free article] [PubMed] [Google Scholar]
- 38. Hobor F, Pergoli R, Kubicek K, Hrossova D, Bacikova V, Zimmermann M, Pasulka J, Hofr C, Vanacova S, Stefl R (2011) Recognition of transcription termination signal by the nuclear polyadenylated RNA‐binding (NAB) 3 protein. J Biol Chem 286: 3645–3657 [DOI] [PMC free article] [PubMed] [Google Scholar]
- 39. Kuzmic P (2009) DynaFit–a software package for enzymology. Methods Enzymol 467: 247–280 [DOI] [PubMed] [Google Scholar]
- 40. Pettersen EF, Goddard TD, Huang CC, Couch GS, Greenblatt DM, Meng EC, Ferrin TE (2004) UCSF Chimera–a visualization system for exploratory research and analysis. J Comput Chem 25: 1605–1612 [DOI] [PubMed] [Google Scholar]
- 41. Schubert M, Labudde D, Oschkinat H, Schmieder P (2002) A software tool for the prediction of Xaa‐Pro peptide bond conformations in proteins based on 13C chemical shift statistics. J Biomol NMR 24: 149–154 [DOI] [PubMed] [Google Scholar]
- 42. Laskowski RA, Rullmannn JA, MacArthur MW, Kaptein R, Thornton JM (1996) AQUA and PROCHECK‐NMR: programs for checking the quality of protein structures solved by NMR. J Biomol NMR 8: 477–486 [DOI] [PubMed] [Google Scholar]
Associated Data
This section collects any data citations, data availability statements, or supplementary materials included in this article.
Supplementary Materials
Expanded View Figures PDF
Review Process File