Abstract
Mitophagy, the selective removal of damaged or excess mitochondria by autophagy, is an important process in cellular homeostasis. The outer mitochondrial membrane (OMM) proteins NIX, BNIP3, FUNDC1, and Bcl2‐L13 recruit ATG8 proteins (LC3/GABARAP) to mitochondria during mitophagy. FKBP8 (also known as FKBP38), a unique member of the FK506‐binding protein (FKBP) family, is similarly anchored in the OMM and acts as a multifunctional adaptor with anti‐apoptotic activity. In a yeast two‐hybrid screen, we identified FKBP8 as an ATG8‐interacting protein. Here, we map an N‐terminal LC3‐interacting region (LIR) motif in FKBP8 that binds strongly to LC3A both in vitro and in vivo. FKBP8 efficiently recruits lipidated LC3A to damaged mitochondria in a LIR‐dependent manner. The mitophagy receptors BNIP3 and NIX in contrast are unable to mediate an efficient recruitment of LC3A even after mitochondrial damage. Co‐expression of FKBP8 with LC3A profoundly induces Parkin‐independent mitophagy. Strikingly, even when acting as a mitophagy receptor, FKBP8 avoids degradation by escaping from mitochondria. In summary, this study identifies novel roles for FKBP8 and LC3A, which act together to induce mitophagy.
Keywords: autophagy, FKBP38, FKBP8, LC3A, mitophagy
Subject Categories: Autophagy & Cell Death, Membrane & Intracellular Transport
Introduction
Many diseases are related to mitochondria malfunction, and mitochondrial quality control is therefore essential 1, 2. In order to maintain cellular homeostasis, mitochondrial morphology is regulated by constant cycles of fusion and fission 3. Damaged mitochondria are taken up by neighboring intact mitochondrial network by fusion. Severely damaged mitochondria may undergo asymmetrical fission giving rise to one functional daughter mitochondrion and one highly impaired mitochondrion destined for selective clearance through lysosomal degradation 4. The process of selective removal of mitochondria is termed mitochondrial autophagy or mitophagy.
Macroautophagy includes the formation of a double‐membrane structure known as the phagophore, expansion of the phagophore, and sequestration of cellular components into a closed double‐membrane structure known as the autophagosome. The autophagosome eventually fuses with the lysosome where the cargo is degraded. Selectivity to the process is mediated by autophagy receptors, interacting with the cargo and with ATG8 family proteins attached to the growing phagophore. The mammalian ATG8 family has three LC3 (microtubule associated protein 1 light chain 3) subfamily members, LC3A‐C, and three GABARAP (gamma amino butyrate‐associated protein) subfamily members 5. The motif in autophagy receptors responsible for ATG8 binding is termed the LIR (LC3‐interacting region) motif 6. LIR is composed of a [W/F/Y]xx[L/I/V] core motif binding two hydrophobic pockets in the ATG8 molecule, and one or more acidic residues engaged in electrostatic interactions. Selective autophagy receptors include the so‐called sequestosome‐like receptors (SLRs), including p62/SQSTM1, NBR1, NDP52, TAX1BP1, and optineurin 7. Damaged mitochondria stabilize PINK1 (PTEN‐induced putative kinase 1) on the outer mitochondrial membrane (OMM) where it recruits and activates Parkin. Activated Parkin ubiquitinates numerous OMM proteins, leading to recruitment of the autophagy receptors p62, optineurin, and NDP52 followed by mitophagy 8, 9, 10, 11.
In yeast, the OMM protein termed Atg32 interacts with ATG8 through its LIR motif and mediates mitophagy 12, 13. Recently, the mammalian homolog of Atg32 was identified as Bcl‐2‐L13 14, interacting with LC3B and responsible for Parkin‐independent mitophagy. Other mitophagy receptors in the OMM have been described: BNIP3L/NIX (Bcl‐2 adenovirus E1B 19‐kDa‐interacting protein 3‐like), BNIP3 and FUNDC1 (FUN14 domain containing protein like 1). These receptors harbor LIR motifs and recruit distinct ATG8 homologs (LC3B for BNIP3 and FUNDC1; GABARAP‐L1 for NIX) for mitochondrial clearance 15, 16, 17.
FKBP8 (FK506 binding protein 8), also named FKBP38, belongs to the FK 506 binding protein family. The domain architecture of FKBP8 displays an N‐terminal Glu‐rich region followed by a peptidyl‐prolyl cis‐trans isomerase (PPIase) domain, three TPR (tetratricopeptide repeats) motifs, a Ca2+–calmodulin‐binding region and a C‐terminal transmembrane domain (Fig 1B) 18, 19. FKBP8 is anchored in the OMM via its C‐terminal transmembrane domain, exposing the N‐terminal part to the cytosol 20, 21. Distinct from the other FKBPs, FKBP8 is a noncanonical FKBP and PPIase since its PPIase activity is triggered only when Ca2+‐bound calmodulin binds to it 18. FKBP8 is an important anti‐apoptotic protein via its interactions with Bcl‐2 and Bcl‐XL that FKBP8 recruits to mitochondria 20, 22, 23. FKBP8 is also an inhibitor of mTOR that is antagonized by Rheb in response to growth factors or nutrients. A cross talk with Bcl‐2 and Bcl‐XL is also at work here 24, 25. FKBP8 is shown to translocate from the mitochondria to the endoplasmic reticulum (ER) upon Parkin‐mediated mitophagy and thus escapes from degradation 26. However, any direct involvement of FKBP8 in mitophagy has not been anticipated or described.
Figure 1. FKBP8 interacts with ATG8 family proteins via an N‐terminal LIR motif.
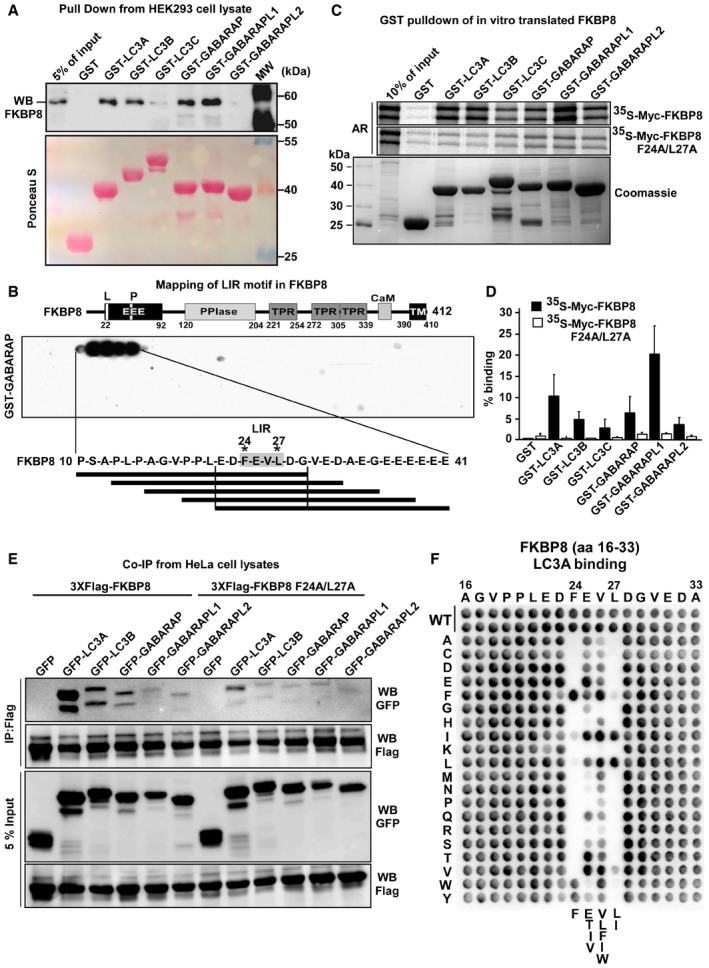
- GST‐pulldown assay of endogenous FKBP8 from a RIPA buffer lysate of human HEK293 cells incubated with recombinant GST or GST fused to human ATG8 family proteins immobilized on Glutathione Sepharose beads. The pulled‐down FKBP8 protein and 5% of the input lysate were analyzed by Western blotting using anti‐FKBP8 antibody. GST or GST fusion proteins were visualized by Ponceau S staining (lower panel).
- Peptide array of 20‐mer peptides covering full‐length FKBP8 was used for identification of a putative LIR motif in the N‐terminus of FKBP8. Each peptide was shifted three amino acids relative to the previous peptide. The array was probed with 1 μg/ml of GST‐GABARAP for 2 h, and binding to GST‐GABARAP detected with anti‐GST antibody. The sequences of the GABARAP‐interacting peptides are shown. A schematic drawing of the domain architecture of human FKBP8 is displayed above the peptide array. Numbers indicate amino acid positions. L, LIR motif; EEE, glutamate‐rich domain; P, proline‐rich region; PPIase, peptidyl‐prolyl cis‐trans isomerase domain; TPR, tetratricopeptide repeats: CaM, calmodulin‐binding domain; and TM, transmembrane domain. Asterisks indicate the conserved aromatic and hydrophobic residues of the LIR motif.
- GST‐pulldown assay using 35S‐labeled Myc‐FKBP8 WT or LIR mutant incubated with recombinant GST or GST fused to ATG8 family proteins. The Coomassie staining represents the amount of GST‐ATG8 fusion proteins on Glutathione Sepharose beads used in the assays. Bound Myc‐FKBP8 WT and LIR mutant were detected by autoradiography.
- Quantifications of the binding of Myc‐FKBP8 WT and LIR mutant to the GST‐ATG8 proteins presented as percentage binding relative to the 10% input. The bars represent the mean values with standard deviations of three independent experiments.
- Co‐immunoprecipitation experiments performed with Flag antibodies using extracts from HeLa cells transiently transfected with expression vectors for GFP or GFP‐tagged ATG8 proteins together with 3×Flag‐tagged wild‐type (WT) or LIR mutant (F24A/L27A) FKBP8. The blots were probed with anti‐Flag and anti‐GFP antibodies.
- A two‐dimensional peptide array scan analyzing the effect of single amino acid substitutions at all positions of the indicated 18‐mer peptide from FKBP8 (amino acids 16–33). The array was probed with 1 μg/ml of GST‐LC3A for 2 h, and binding to GST‐LC3A detected with anti‐GST antibody.
Here, we identify a canonical LIR motif in the N‐terminus of FKBP8, which binds with high affinity to LC3A in vivo. Overexpression of FKBP8 in mammalian cells induced a mitochondrial fission phenotype similar to the phenotype described when the established mitophagy receptors BNIP3 and NIX/BNIP3L are overexpressed. We show that the FKBP8 LIR motif is important for recruitment of LC3A to damaged mitochondria, and this recruitment induces Parkin‐independent mitophagy. Interestingly, FKBP8 itself was not degraded with the mitochondria, indicating mitochondrial escape. We have identified FKBP8 as a novel mitophagy receptor, preferentially acting together with LC3A to induce degradation of damaged mitochondria, while escaping degradation itself.
Results
FKBP8 contains a canonical N‐terminal LIR motif with strong affinity for LC3A in vivo
Using yeast two‐hybrid screens with ATG8 family proteins as bait, a number of LC3/GABARAP‐binding partners have been identified 27. In such a screen of a human thymus cDNA library using human LC3B as bait, we identified one in‐frame FKBP8 cDNA clone that included the start codon. We proceeded to test if FKBP8 could interact with ATG8 family proteins using a GST‐pulldown assay. GST and GST‐tagged human LC3 and GABARAP proteins were purified from E. coli, incubated with HEK293 cell lysates before FKBP8 binding was assayed by Western blotting. FKBP8 showed strong interactions with LC3A, LC3B, GABARAP, and GABARAPL1, but very weak binding to LC3C and GABARAPL2 (Fig 1A).
In order to directly identify one or more putative LIR motifs in FKBP8, we used a peptide array strategy 28. Using arrays of overlapping 20‐mer peptides of FKBP8 moved by increments of three amino acids to cover the full‐length sequence, we detected a single LIR motif in the N‐terminus with the core sequence FEVL (Fig 1B). To test if the identified motif is a functional LIR, we mutated the core residues, F24 and L27, to alanines (LIRm). In vitro‐translated Myc‐tagged, wild‐type (WT) and LIRm FKBP8, were subjected to GST‐pulldown assays together with GST‐tagged ATG8 homologs. Mutations in the core LIR motif resulted in a significantly reduced FKBP8 binding to the ATG8 proteins (Fig 1C and D). Quantitation of the FKBP8 interactions shows high‐affinity binding toward GABARAPL1 and LC3A (Fig 1D), low‐affinity binding toward GABARAPL2 and LC3C, and intermediary‐affinity binding toward LC3B and GABARAP. These results correlate well with the pulldowns from cell extracts in Fig 1A.
To investigate whether FKBP8 interacts with the ATG8 homologs in vivo, GFP‐tagged ATG8 proteins were co‐expressed with Flag‐tagged wild‐type (WT) or LIR‐mutated FKBP8 in HeLa cells, before immunoprecipitations using a Flag antibody. Efficient co‐precipitation of LC3A, and a weaker but significant co‐precipitation of LC3B were observed (Fig 1E). Surprisingly, only moderate co‐precipitation of GABARAP and no co‐precipitations of GABARAPL1 and GABARAPL2 were detected (Fig 1E). Consistent with the in vitro data, the FKBP8 LIR mutant did not co‐precipitate any of the ATG8 homologs. GFP‐LC3C was not included in the co‐precipitation experiments as it is detected very efficiently by the anti‐Flag antibody 29. Hence, this assay supports the finding that FKBP8 has specificity toward LC3A.
The presence of a canonical FKBP8‐ATG8 interaction was further confirmed by GST‐pulldown assays using LIR docking site (LDS) mutants 7 of LC3A and LC3B (Fig EV1A and B). Finally, the canonical LIR motif was verified by a two‐dimensional peptide array analysis 28. Each position of an 18‐mer peptide of FKBP8 containing the LIR was substituted with all 19 alternative amino acids, and the arrays were probed for interaction with GST‐LC3A (Fig 1F). Interestingly, F was clearly preferred at the aromatic 0 position binding in hydrophobic pocket 1 (HP1) of the LDS, and only I could efficiently replace L at the +3 position of the core LIR interacting with LDS hydrophobic pocket 2 (HP2). At position +1, the polar amino acids E, T, or the hydrophobic residues I and V were preferred. Furthermore, at position +2, usually the most promiscuous position of the core LIR 7, there was a preference for hydrophobic amino acids (V, L, F, I, and W; Figs 1F and EV1C). Likely, this rather specific requirement of the core LIR reflects the preferential binding to LC3A. The core LIR is flanked by acidic residues that may contribute to the binding affinity. LIR motifs usually reside in β sheets 7, and the predicted β sheet of the FKBP8 LIR is most probably terminated by prolines N‐terminally and a glycine C‐terminal to the core LIR. Taken together, these results allowed the conclusion that FKBP8 contains a canonical N‐terminal LIR motif that interacts preferentially with LC3A in vivo.
Figure EV1. The FKBP8‐ATG8 interaction is dependent on an intact LIR docking site (LDS).
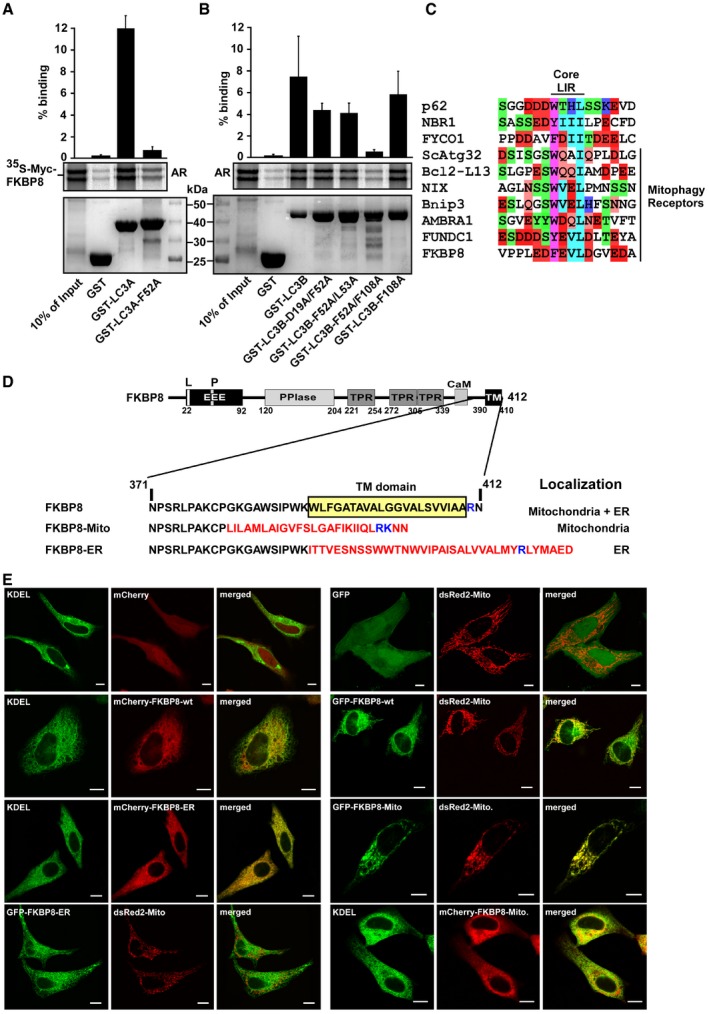
-
A, BGST‐pulldown assay using 35S‐labeled Myc‐FKBP8 WT incubated with recombinant GST and GST‐LC3A‐WT or GST‐LC3A‐F52A mutation (LDS mutation) (A) or GST‐LC3B or GST‐LC3B indicated mutations (LDS predicted sites) (B). Bound FKBP8 was detected by autoradiography. The bar graphs in the top panel represent the mean values of percentage binding of in vitro‐translated FKBP8 to GST‐LC3A or GST‐LC3B WT and mutant proteins relative to the 10% input with standard deviations based on three independent experiments.
-
CAlignment of core LIR motifs in the autophagy mediators p62, NBR1, FYCO1, and the identified mitophagy receptors as well as FKBP8. Color coding; aromatic residues (magenta), acidic residues (red), hydrophobic residues (turquoise), Ser and Thr residues (green), Gln and Asn (orange), and basic residues (blue).
-
DThe transmembrane (TM) domain at the C‐terminus of FKBP8 (depicted schematically) was swapped with the ActA sequence and the cytochrome b5 sequence to generate mitochondria‐ and ER‐specific FKBP8, respectively. The amino acid sequence of the C‐terminus of each construct is shown. The TM domain sequences from ActA and cytochrome b5 are indicated in red with the important basic residue(s) in blue.
-
EHeLa cells were co‐transfected with EGFP‐FKBP8‐Mito and dsRed2‐Mito or EGFP‐KDEL (ER marker) and mCherry‐FKBP8‐ER. Transfected cells were imaged by a Leica SP5 fluorescence confocal microscope to confirm co‐localization. Scale bars, 10 μm.
FKBP8 targeted to the OMM interacts preferentially with lipidated LC3A (LC3A‐II)
We next asked if there is an interaction between endogenous FKBP8 and endogenous LC3A/B. For this purpose, we used total cell lysates from SH‐SY5Y cells that display higher expression levels of LC3A than HeLa and HEK293 cells (Fig EV2A). The cells were stressed or not with the mitochondrial uncoupler carbonyl cyanide 3‐chlorophenylhydrazone (CCCP) or DMSO for 4 h. Endogenous FKBP8 was efficiently co‐precipitated using a LC3A/B antibody (Fig 2A) and a specific LC3A antibody (Fig 2B). A similar experiment was performed using HeLa cells transiently transfected with a Flag‐LC3A expression construct. Flag‐LC3A was precipitated from the HeLa extracts using an anti‐Flag antibody and co‐precipitated FKBP8 detected by Western blotting (Fig 2C).
Figure EV2. CRISPR‐mediated gene editing for generation of FKBP8 knockout clones in Flp‐In‐HEK293 and HeLa cell lines.
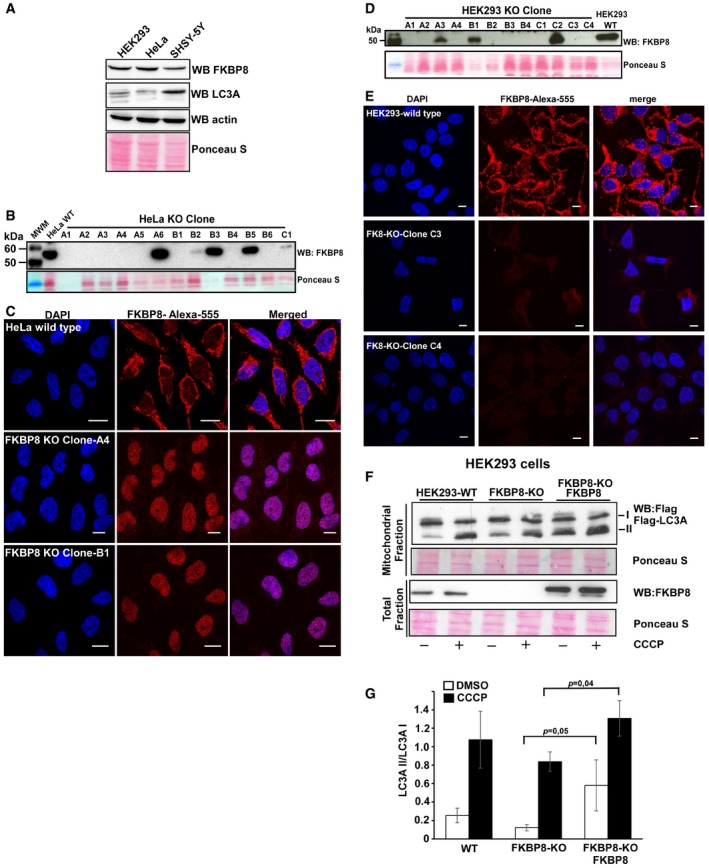
-
AWestern blot analysis of cell extracts (40 μg) from HEK293, HeLa, and SH‐SY5Y cells with anti‐FKBP8 and anti‐LC3A antibodies.
-
BWestern blot analysis of CRISPR/Cas9 HeLa clones with anti‐FKBP8 antibody in comparison with the mother cell line Flp‐In T‐REx HeLa.
-
CImmunostaining analyses of the wild‐type Flp‐In T‐REx HeLa and knockout clones A4 and B1 with anti‐FKBP8 antibody. The nuclei were stained with DAPI. Scale bars, 10 μm.
-
DWestern blot analysis of CRISPR/Cas9 HEK293 clones with anti‐FKBP8 antibody in comparison with the mother cell line Flp‐In T‐REx HEK293.
-
EImmunostaining analysis of the wild‐type Flp‐In T‐REx Hek293 and knockout clones C3 and C4 with anti‐FKBP8 antibody. The nuclei were stained with DAPI. Scale bars, 10 μm.
-
F, GFKBP8 overexpression in Flp‐In T‐REx HEK293 FKBP8 KO cells significantly increases the amount of lipidated Flag‐LC3A in the mitochondrial fraction. Flp‐In T‐REx HEK293 WT and CRISPR/Cas9‐generated KO clone C3 cells were transfected with Flag‐LC3A constructs or Flag‐LC3A and Myc‐FKBP8 expression constructs and treated with DMSO or CCCP (30 μM; 4 h). The amounts of Flag‐LC3A in the mitochondrial fraction (40 μg) and FKBP8 in the total fractions (30 μg) were analyzed by Western blotting. Ponceau S‐stained blots are used as loading controls. The graph in (G) represents the average of quantitated Flag‐LC3A II/Flag‐LC3A I values of three independent experiments performed as in (F) (n = 3). Error bars represent the s.d. The P‐values were calculated using paired Student's t‐test and are indicated above the bars.
Figure 2. FKBP8 targeted to the OMM interacts preferentially with lipidated LC3A (LC3A‐II).
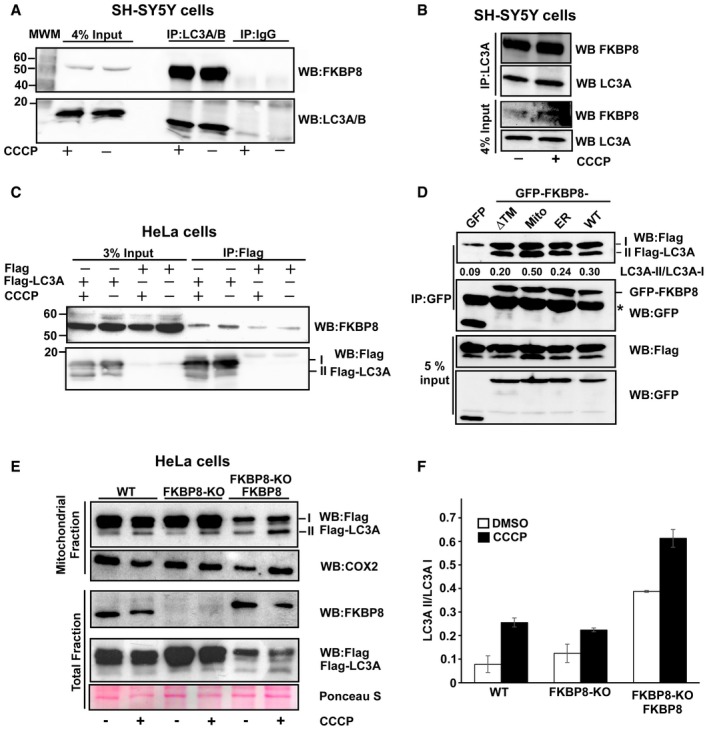
-
A, BAntibodies to endogenous LC3A/B (A), or LC3A only (B), efficiently co‐precipitated endogenous FKBP8 from SH‐SY5Y cell extracts. SH‐SY5Y cells were treated with DMSO or 10 μM CCCP for 4 h and subjected to immunoprecipitation using an LC3A/B antibody or using rabbit serum (IgG) as negative control. In another set of experiments, an LC3A‐specific antibody was used for immunoprecipitation (B). Co‐precipitated FKBP8 was detected by Western blotting using a FKBP8 antibody.
-
CFlag‐LC3A co‐precipitated endogenous FKBP8 from HeLa cell extracts. HeLa cells were transfected with 3×Flag‐LC3A constructs and treated with DMSO or 10 μM CCCP for 4 h and subjected to immunoprecipitation using a Flag antibody. Co‐precipitated FKBP8 was detected by Western blotting using a FKBP8 antibody.
-
DHeLa cells were co‐transfected with GFP, GFP‐FKBP8‐ΔTM, GFP‐FKBP8‐Mito, or GFP‐FPBP8‐ER, or GFP‐FKBP8‐WT, respectively, and Flag‐LC3A expression constructs, and co‐precipitations performed using a GFP antibody. The star indicates IgG heavy chain. The blot shows one representative experiment out of three independent experiments. The ratios of LC3A II/LC3A I are shown below the upper blot.
-
E, FFKBP8 overexpression in HeLa FKBP8 KO cells significantly increased the amount of lipidated Flag‐LC3A in the mitochondrial fraction. HeLa WT and a CRISPR/Cas9‐generated KO clone were transfected with 3×Flag‐LC3A constructs, or 3×Flag‐LC3A and Myc‐FKBP8 expression constructs, and treated with DMSO or CCCP (30 μM; 4 h). The amounts of Flag‐LC3A in the mitochondrial fraction (40 μg) and FKBP8 in the total fractions (30 μg) were analyzed by Western blotting. Ponceau S staining is used as loading control. Cox2 was used as mitochondrial marker. The blot in (E) is representative of two independent experiments. The graph in (F) represents the average values of quantitated Flag‐LC3A II/Flag‐LC3A I ratio of two independent experiments. Error bars show the s.d.
FKBP8 is reported to be mainly located on the OMM. In order to determine whether the binding of LC3A to FKBP8 is dependent on mitochondrial localization, we made expression constructs of FKBP8 mutants specifically targeted to mitochondria, ER, or cytosol. For mitochondrial targeting, the FKBP8 transmembrane (TM) domain was swapped with the mitochondria‐specific insertion sequence of the ActA protein from Listeria monocytogenes, generating FKBP8‐Mito. ER targeting (FKBP8‐ER) was obtained by switching the insertion sequence from the ER‐specific isoform of cytochrome b5 (Cb.5) 30, 31 with the FKBP8 TM domain (Fig EV1D). To obtain a cytosolic localized FKBP8, the TM domain was deleted (FKBP8‐ΔTM). Correct subcellular localizations of the FKBP8 mutant constructs were verified by confocal imaging, using the mitochondrial marker dsRed2‐Mito or the ER‐specific marker GFP‐KDEL (Fig EV1E). The GFP‐FKBP8‐Mito, GFP‐FKBP8‐ΔTM, and GFP‐FKBP8‐ER constructs were co‐expressed with the Flag‐LC3A construct in HeLa cells. Immunoprecipitation assays revealed that all the different FKBP8 constructs co‐precipitated LC3A. However, the mitochondria‐localized FKBP8 (FKBP8‐Mito) precipitated significantly more of the lipidated form of LC3A (LC3A‐II) than WT, ER‐bound, or cytoplasmic FKBP8 (Fig 2D). This indicates that FKBP8 has the ability to recruit lipidated LC3A to the mitochondria, such as LC3A associated with the phagophore.
To investigate the importance of FKBP8 for mitochondrial recruitment of LC3A, FKBP8 knockout HeLa and HEK293 cell lines (FKBP8 KO) were established using CRISPR/Cas9 gene editing (Fig EV2B–E). The KO cells were transiently transfected with the Flag‐LC3A expression construct, subjected to a fractionation protocol and presence of Flag‐LC3A forms I and II in the mitochondrial fractions determined by Western blotting. Importantly, the mitochondrial fractions contained both forms I and II of Flag‐LC3A. The lipidated LC3A (II form) was clearly enriched in the mitochondrial fractions isolated from CCCP‐treated cells (Figs 2E and F, and EV2F and G). Flag‐LC3A was detected in the mitochondrial fractions of both KO cell lines, indicating that FKBP8 is not absolutely essential for LC3A recruitment to the mitochondria. However, the relative amount of lipidated Flag‐LC3A is lower in the KO cell lines compared to WT upon CCCP treatment. Actually, in the HEK293 KO cell line, the amount of lipidated LC3A was significantly lower in the KO cells also during normal conditions (Fig EV2G). To evaluate the role of FKBP8 for recruitment of lipidated LC3A to the mitochondria further, FKBP8 and Flag‐LC3A expression constructs were transiently co‐transfected into the KO cell lines (Figs 2D and F, and EV2F and G). Importantly, the amount of lipidated Flag‐LC3A was significantly enhanced in the FKBP8‐reconstituted cells compared to the KO cells, both upon DMSO and CCCP treatment. Taken together, these results clearly show that FKBP8 is important for efficient recruitment of lipidated LC3A to the mitochondria.
Notably, the FKBP8 KO cell lines were prone to undergo apoptosis, particularly upon stress, such as CCCP treatment. This is in line with previous reports showing that FKBP8 is an anti‐apoptotic protein, inhibiting apoptosis by targeting the anti‐apoptotic proteins Bcl‐2 and Bcl‐XL to mitochondria 19. Hence, we decided to use HeLa WT cells instead of the KO cells in the further study to avoid that the increased apoptosis affected our results.
FKBP8 mediates LIR‐dependent recruitment of LC3A to damaged mitochondria
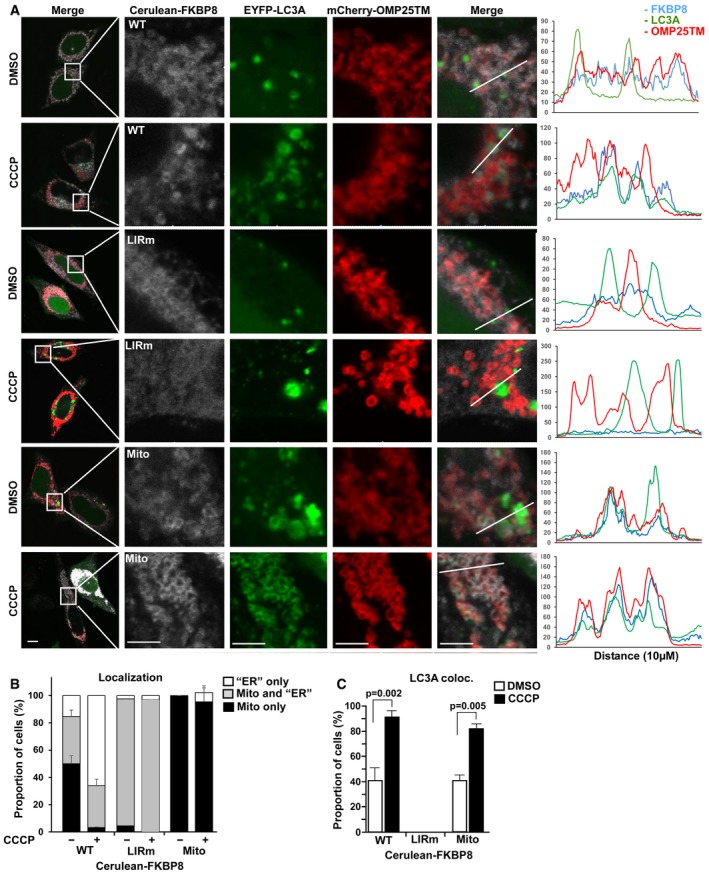
The identification of a functional LIR motif in FKBP8, and its preferential interaction with LC3A, led us to explore if the LIR motif in FKBP8 was important for recruitment of LC3A to the mitochondria. For this purpose, HeLa cells were co‐transfected with expression constructs for Cerulean‐FKBP8, EYFP‐LC3A, and the mitochondrial marker mCherry‐OMP25TM and imaged by confocal microscopy. In the mCherry‐OMP25TM localization probe, mCherry is fused to the transmembrane domain of the mitochondrial matrix protein OMP25 (also called SYNJ2BP) 32. In line with previous findings, ectopically expressed FKBP8 was highly enriched on the mitochondria in most cells (Fig 3A and B). EYFP‐LC3A was enriched in cytoplasmic dots or ring structures, and in 40% of the cells, FKBP8 was co‐localized with LC3A (Figs 3A and C, and EV3A), primarily on mitochondria (see line plot Fig 3A, and quantitation, Fig 3B). Damaging the mitochondria by CCCP treatment induced redistribution of FKBP8. Strikingly, in almost all cells (> 95%) FKBP8 was located on structures outside mitochondria while only 30% of the cells partially retained FKBP8 on the mitochondria (Fig 3A and B). This is in line with a previous study showing that FKBP8 and Bcl‐2 translocate from mitochondria to ER upon Parkin‐dependent mitophagy to avoid apoptosis 26. Hence, we assume that the FKBP8‐containing structures observed outside the mitochondria represent ER. Interestingly, CCCP induced strong co‐localization of FKBP8 and LC3A in nearly all cells (90%), both on the mitochondria and adjacent to the mitochondria (Fig 3A–C).
Figure 3. FKBP8 mediates LIR‐dependent recruitment of LC3A to damaged mitochondria.
-
AHeLa cells were co‐transfected with plasmids expressing Cerulean‐FKBP8 WT, Cerulean‐FKBP8 LIR mutant, or Cerulean‐FKBP8 Mito together with EYFP‐LC3A and the mCherry‐OMP25TM probe to label the mitochondria. The cells were treated with DMSO or 10 μM CCCP for 6 h and imaged using a Leica SP5 fluorescence confocal microscope. Scale bars, 10 μm; on zoomed images, 5 μm. Line‐profile co‐localization plots of Cerulean‐FKBP8 WT, Cerulean‐FKBP8 LIR mutant (LIRm), or Cerulean‐FKBP8 Mito (Mito) (blue lines); EYFP‐LC3A (green lines); and OMP25TM (red lines) were made using the line‐profile quantification tool in the Leica imaging software (LAS‐AF). The vertical axes represent measurements of fluorescent intensity and the horizontal axis the drawn distances.
-
B, CProportion in % of cells that display co‐localization between Cerulean‐FKBP8 WT, Cerulean‐FKBP8 LIR mutant, or Cerulean‐FKBP8 Mito and OMP25TM (B) or EYFP‐LC3A (C). The proportion of cells that displayed co‐enrichment in cellular structures/dots of FKBP8 WT/LIRm/Mito and OMP25TM, or with FKBP8 WT/LIRm/Mito and LC3A‐positive structures, were quantitated manually. Thirty cells were analyzed for each condition within each experiment, a total of 100 cells per condition. The graphs represent the average values (n = 3), and error bars represent s.d. for the three independent experiments. P‐values calculated by Student's t‐test, paired, are indicated above the graph (C).
Figure EV3. FKBP8‐ER recruits LC3A to the ER upon CCCP treatment.
-
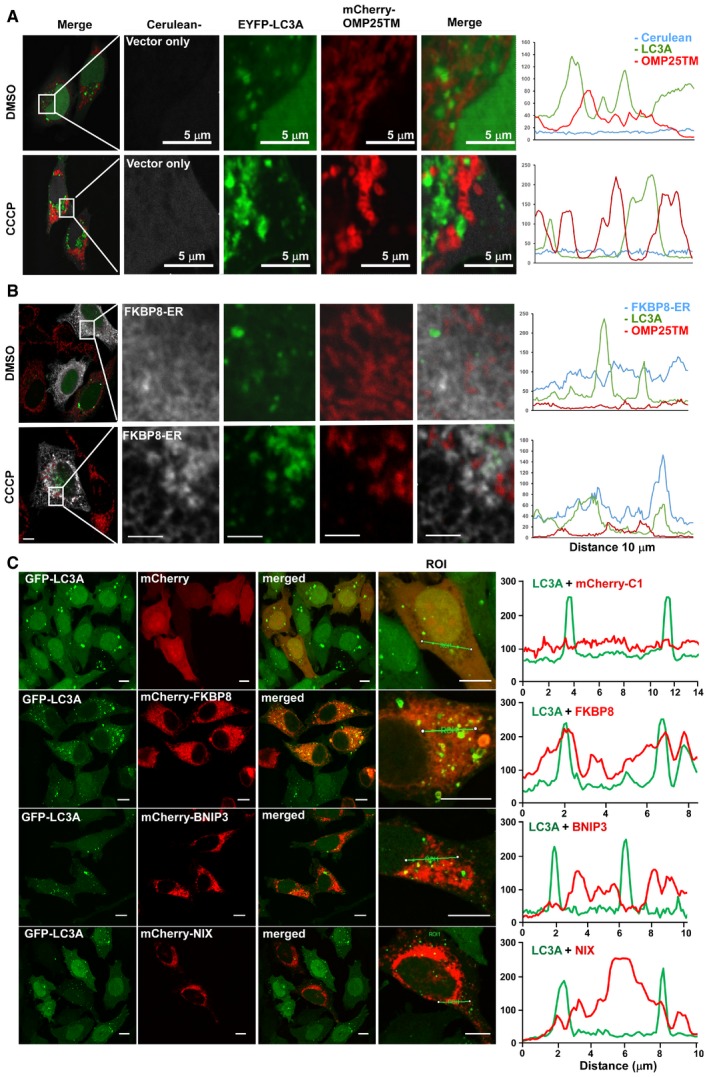
A, BHeLa cells were co‐transfected with Cerulean vector control (A) or Myc‐FKBP8‐ER (B), EYFP‐LC3A, and mCherry‐OMP25TM expression constructs. The cells were treated with DMSO or 10 μM CCCP for 4 h and imaged by a Leica SP5 fluorescence confocal microscope. Scale bars, 10 μm; in zoomed images, 5 μm. Line‐profile co‐localization plots of Cerulean or FKBP8 ER (blue line), EYFP‐LC3A (green line), and OMP25TM (red line) were made using the line‐profile quantification tool in the Leica imaging software (LAS‐AF). The vertical axes represent measurements of fluorescent intensity and the horizontal axis the drawn distances.
-
CA HeLa cell line stably expressing GFP‐LC3A was transfected with plasmids expressing the indicated mCherry‐fusion proteins imaged by a Leica SP5 confocal microscope. Scale bars, 10 μm. Line‐profile co‐localization of plots of GFP‐LC3A (green line) and mCherry vector control, mCherry‐FKBP8, mCherry‐NIX, or mCherry‐BNIP3 (red lines) were made using the line‐profile quantification tool in Leica imaging software. The measurements of the intensity (y‐axis) and distance (x‐axis in μm) are plotted on the graph.
To investigate if the co‐localization of LC3A and FKBP8 is mediated by the FKBP8 LIR motif, a Cerulean‐FKBP8 LIR mutant (F24A/L27A, hereafter denoted LIRm) was co‐expressed with EYFP‐LC3A and mCherry‐OMP25TM in the HeLa cells. Strikingly, the FKBP8 LIRm is localized both on the mitochondria and on ER, but it fails completely to co‐localize with LC3A upon CCCP treatment (Fig 3A–C). Instead, LC3A forms visible aggregates that do not overlap with the mCherry‐OMP25TM probe (Fig 3A), similarly as the vector control (Fig EV3A). Together, these results suggest that CCCP treatment induces a LIR‐mediated interaction between FKBP8 and LC3A, and this interaction is important for mitochondrial recruitment of LC3A.
To address the FKBP8‐mediated mitochondrial recruitment of LC3A further, we employed the FKBP8‐Mito construct that specifically constrains FKBP8 to mitochondria. FKBP8‐Mito did not escape from the mitochondria upon CCCP treatment (Fig 3A and B). Importantly, FKBP8‐Mito co‐localized with LC3A in 40% of the cells during normal conditions, while CCCP induced co‐localization in nearly 90% of the cells, very similar as FKBP8 WT (Fig 3C). Interestingly, CCCP also induced complete redistribution of LC3A to the mitochondria, clearly indicating that FKBP8 is important for mitochondrial recruitment of LC3A upon mitochondrial damage (Fig 3C). Notably, the ER‐constrained FKBP8 mutant FKBP8‐ER also recruited LC3A upon CCCP treatment, but did not co‐localize with mitochondria (Fig EV3B). Taken together, our results show that FKBP8 mediates LIR‐dependent recruitment of LC3A to damaged mitochondria.
Overexpression of FKBP8, NIX, or BNIP3 similarly induces mitochondrial fragmentation, but mitochondrial recruitment of LC3A is predominantly mediated by FKBP8
The FKBP8‐mediated recruitment of LC3A to damaged mitochondria prompted us to investigate whether FKBP8 may have a role in selective removal of dysfunctional or damaged mitochondria (mitophagy). Mitophagy is commonly preceded by mitochondrial fragmentation 33. We monitored mitochondrial morphology in HeLa cells transiently overexpressing FKBP8 by immunostaining of the OMM protein TOM20 (Fig 4A). Significant morphological changes of mitochondria were observed, including fragmentation, dotted structures, and perinuclear aggregation. These changes induced by FKBP8 overexpression were similar to the morphological changes observed when the well‐established mitophagy receptors NIX and BNIP3 were overexpressed (Fig 4A). Quantitative analysis revealed that FKBP8 overexpression led to approximately 50% reduction in TOM20‐positive mitochondrial area per cell, and similar reduction in relative fluorescence intensity of TOM20 (Fig 4B). The morphology changes induced by NIX were very similar, while BNIP3 displayed an even stronger ability to cluster the mitochondria (Fig 4A and B). Clearly, FKBP8 strongly promotes effects on mitochondrial morphology and TOM20 degradation. It should be noted that overexpression of FKBP8 is by itself sufficient for the induction of mitochondrial fragmentation and aggregation, and this phenotype does not rely on CCCP treatment of the cells or co‐expression of interacting ATG8 family proteins.
Figure 4. Overexpression of FKBP8, NIX, or BNIP3 similarly induces mitochondrial fragmentation, but mitochondrial recruitment of LC3A is specifically mediated by FKBP8.
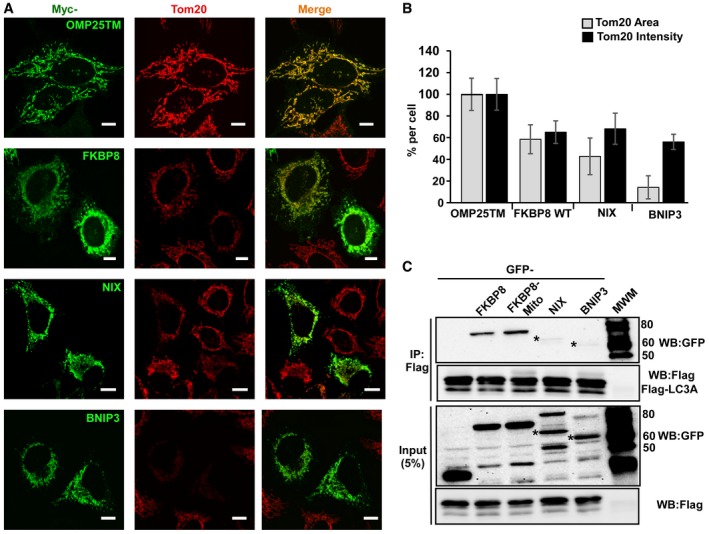
- HeLa cells transfected with expression vectors encoding Myc‐tagged OMP25TM, FKBP8, NIX, or BNIP3, respectively, were immunostained with anti‐TOM20 and anti‐Myc antibodies to reveal changes in mitochondrial morphology. Scale bars, 10 μm.
- Quantitation of TOM20‐positive mitochondrial area (%) and TOM20 fluorescence intensity (%) per cell for cells expressing vector control (Myc‐OMP25TM), Myc‐tagged FKBP8, NIX, or BNIP3. The data were calculated using Volocity 6.2.1 software (PerkinElmer Inc.). The bars represents the average values with standard deviations of TOM20‐positive area and intensity per cell based on analyzing 40 cells for each protein. The experiment was performed twice with similar results.
- HeLa cells were transiently co‐transfected with GFP, GFP‐NIX, or GFP‐BNIP3 and Flag‐LC3A expression constructs. After immunoprecipitation with Flag antibodies, precipitated and co‐precipitated proteins were analyzed by Western blotting using the indicated antibodies. Similar results were obtained in three independent experiments. Asterisks indicate the bands corresponding to full‐length NIX and BNIP3.
Source data are available online for this figure.
To investigate if LC3A recruitment to the mitochondria is a general mechanism of the OMM‐bound mitophagy receptors, the amount of co‐precipitated Flag‐LC3A from HeLa cell extracts overexpressing GFP‐tagged FKBP8, FKBP8‐Mito, BNIP3, or NIX was determined (Fig 4C). Flag‐LC3A clearly co‐precipitate FKBP8 and FKBP8‐Mito, but nearly no BNIP3 or NIX. Furthermore, co‐localization studies in a HeLa cell line stably expressing GFP‐LC3A and transiently transfected with mCherry‐tagged FKBP8, BNIP3, or NIX constructs were conducted. Consistently, LC3A is highly co‐localized with FKBP8 and poorly with NIX or BNIP3 (Fig EV3C). This clearly shows that the recruitment of LC3A to mitochondria is a trait specific for FKBP8, and not a common mechanism generally shared by the OMM‐resident mitophagy receptors.
Co‐expression of FKBP8 with ATG8 proteins, particularly LC3A, induces Parkin‐independent mitophagy
The efficient recruitment of LC3A to the mitochondria upon CCCP treatment prompted us to investigate whether overexpression of FKBP8 alone or together with ATG8s would induce mitophagy. To test this, we used our double‐tag strategy to visualize mitochondria in the acidic compartment, previously described in 6. By using mCherry‐GFP fused to the transmembrane domain of the mitochondrial matrix protein OMP25 32, mitochondria in autolysosomes will appear as red‐only structures. OMP25 is degraded in autolysosomes together with mitochondria during mitophagy and hence is a reliable mitophagy reporter 26, 32. HeLa cells transiently co‐transfected with mCherry‐GFP‐OMP25TM, Flag‐LC3A, and Myc‐FKBP8 showed efficient acidification of mitochondrial structures, while cells expressing mCherry‐GFP‐OMP25TM together with Flag‐LC3A only did not (Fig 5A). Quantitation of cells with red‐only dots showed that approximately 48% of the cells contain acidified mitochondria when FKBP8 is overexpressed together with LC3A, while red‐only dots were almost absent when LC3A was overexpressed alone. Importantly, the mitochondrial acidification was LIR dependent, and enhanced when FKBP8 was specifically targeted to the mitochondria (Fig 5B). This indicates that mitophagy is more efficient when FKBP8 is constrained to the mitochondria. Acidification of mitochondria was similarly observed when overexpressing NIX and BNIP3 together with certain ATG8 proteins. However, these mitophagy receptors were clearly less efficient than FKBP8 in the mitophagy assay used here. Importantly, overexpression of mCherry‐GFP‐OMP25TM and FKBP8, NIX, or BNIP3 without ATG8s did not induce mitophagy (Fig 5B). Neither did the ER‐targeted FKBP8 nor the cytosolic localized FKBP8‐ΔTM mutant when co‐expressed with LC3A (Fig EV4A–C). Altogether, these results suggest that FKBP8 together with LC3A has a strong ability to induce mitophagy when localized to the mitochondria. Interestingly, the FKBP8‐mediated mitophagy observed here is Parkin independent, as there is no detectable Parkin in the HeLa cell line used 10.
Figure 5. Co‐expression of FKBP8 with ATG8 Proteins, particularly LC3A, induces Parkin‐independent mitophagy.
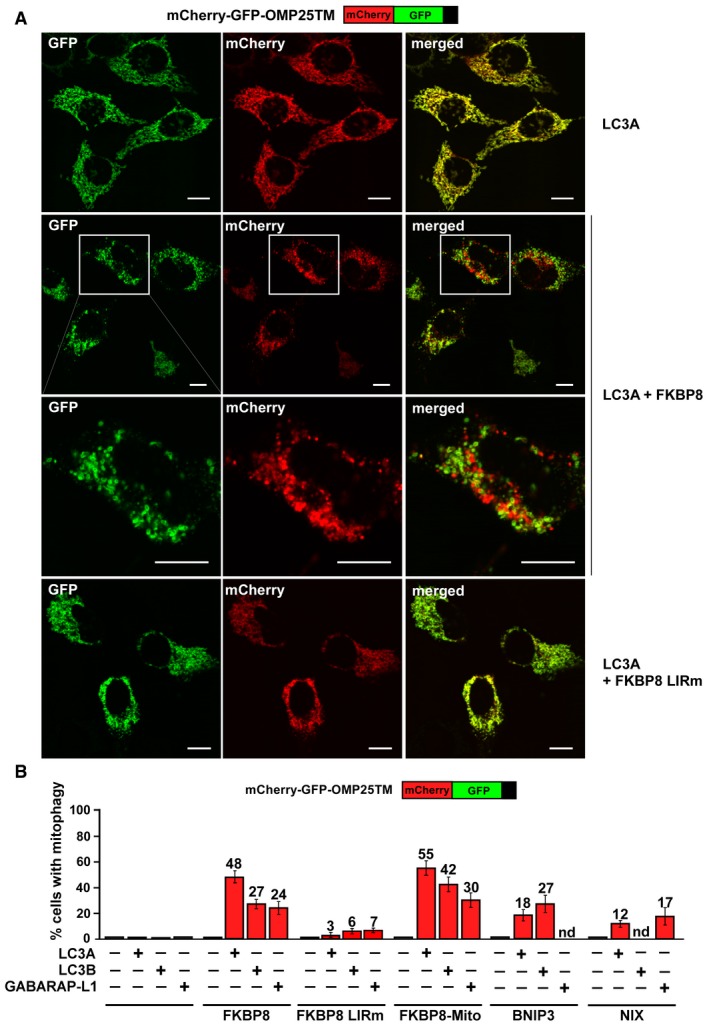
- HeLa cells were transiently transfected with mCherry‐GFP‐OMP25‐TM and 3×Flag‐LC3A together with Myc‐C1 as control or Myc‐FKBP8 WT or LIR mutant expression constructs. The appearance of red‐only structures indicates acidified mitochondria. Scale bars, 10 μm.
- HeLa cells were transiently overexpressing mCherry‐GFP‐OMP25‐TM, the indicated 3×Flag‐tagged ATG8 proteins LC3A, LC3B, or GABARAPL1, together with Myc‐tagged FKBP8 WT, FKBP8 LIR mutant, or FKBP8‐Mito, or the mitophagy receptors BNIP3 or NIX. The graph bars represent the percentage of transfected cells containing red‐only dots indicative of mitophagy activity. Each bar shows the mean value from measurements on 50–70 cells obtained in three independent experiments (n = 3). Error bars represent the s.d.
Figure EV4. FKBP8 mutants that are not localized on mitochondria are unable to induce mitophagy.
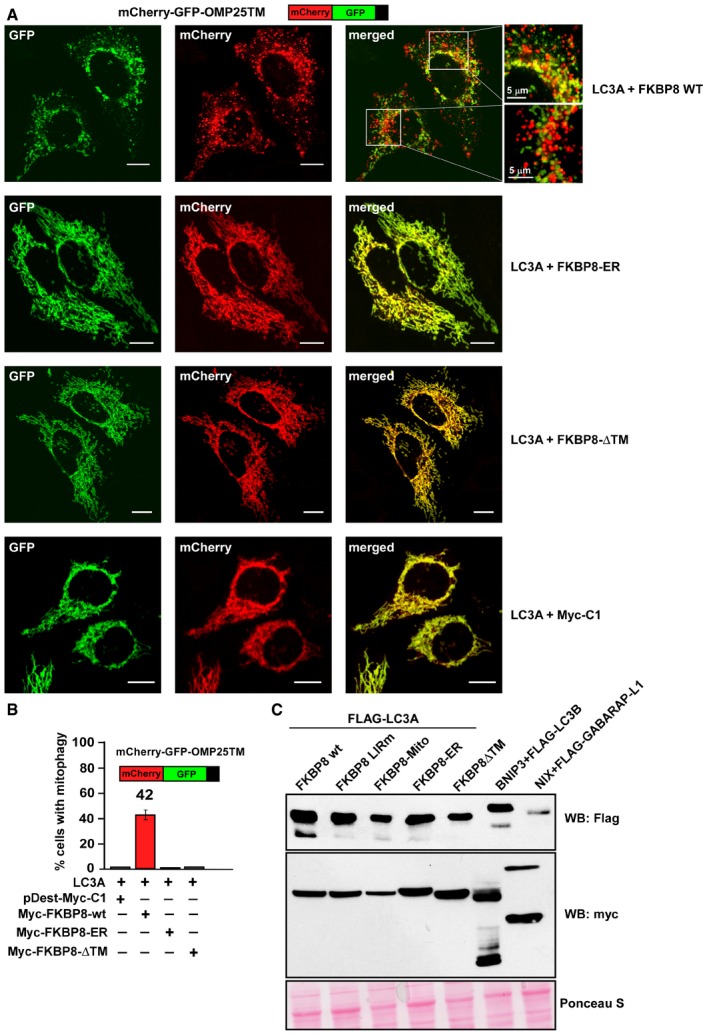
- HeLa cells were transiently transfected with mCherry‐GFP‐OMP25‐TM and 3×Flag‐LC3A together with Myc‐C1 as control and Myc‐FKBP8 WT, Myc‐FKBP8‐∆TM, or Myc‐FKBP8‐ER mutant expression constructs. The appearance of red‐only structures indicates acidified mitochondria. Scale bars, 10 μm.
- HeLa cells were transiently overexpressing mCherry‐GFP‐OMP25‐TM, 3×Flag‐LC3A, together with Myc‐tagged FKBP8 WT, FKBP8‐∆TM, or FKBP8‐ER. The graph bars represent the percentage of transfected cells containing red‐only dots indicative of mitophagy activity. Each bar shows the mean value with standard deviations from measurements on 50–70 cells obtained in three independent experiments.
FKBP8 is not degraded during FKBP8‐LC3A‐induced mitophagy
FKBP8 was reported to escape to the ER during Parkin‐dependent mitophagy 26. Here, we clearly observed a partial escape of FKBP8 WT from mitochondria upon CCCP treatment of HeLa cells not expressing Parkin (Fig 3A and B). Hence, FKBP8 seemed to escape from damaged mitochondria also in a Parkin‐independent manner. To explore this Parkin‐independent escape further, we investigated the cellular localization of FKBP8 during FKBP8‐LC3A overexpression‐induced mitophagy. HeLa cells ectopically expressing mCherry‐EYFP‐OMP25TM, Flag‐LC3A, and Cerulean‐FKBP8 were analyzed by confocal imaging (Fig 6A). While in HeLa cells overexpressing Cerulean‐BNIP3 together with Flag‐LC3B, or Cerulean‐NIX together with Flag‐GABARAPL1 nearly 100% of the acidified mitochondria displayed co‐localization of these mitophagy receptors, a dramatic difference was seen for FKBP8 (Fig 6B). Quantitation of acidified mitochondria (red‐only dots) containing co‐localized Cerulean‐FKBP8 revealed that only 40% of the acidic mitochondria displayed weak FKBP8 fluorence (Fig 6B). Furthermore, FKBP8 was enriched in many specific dots outside the mitochondria while BNIP3 and NIX were not (Fig 6A). It is unclear if the fraction of Cerulean‐FKBP8 co‐localizing with acidified mitochondria actually is located inside these structures. The majority of red‐only dots contained no FKBP8 supporting an efficient escape. Hence, the co‐localization observed may represent FKBP8 involved in recruiting the phagophore before escaping to the ER (see model depicted in Fig 6C). In general, we have been unable to detect degradation of FKBP8 by autophagy. Western blot analysis of endogenous FKBP8 during different autophagy induction and inhibition conditions revealed no significant change in the level of FKBP8 (Fig EV5A). To summarize, these data indicate that FKBP8 itself is not degraded upon FKBP8‐LC3A‐induced mitophagy, but undergoes mitochondrial escape during the process.
Figure 6. FKBP8 undergoes mitochondrial escape during FKBP8‐LC3A‐induced mitophagy in a Parkin‐independent manner.
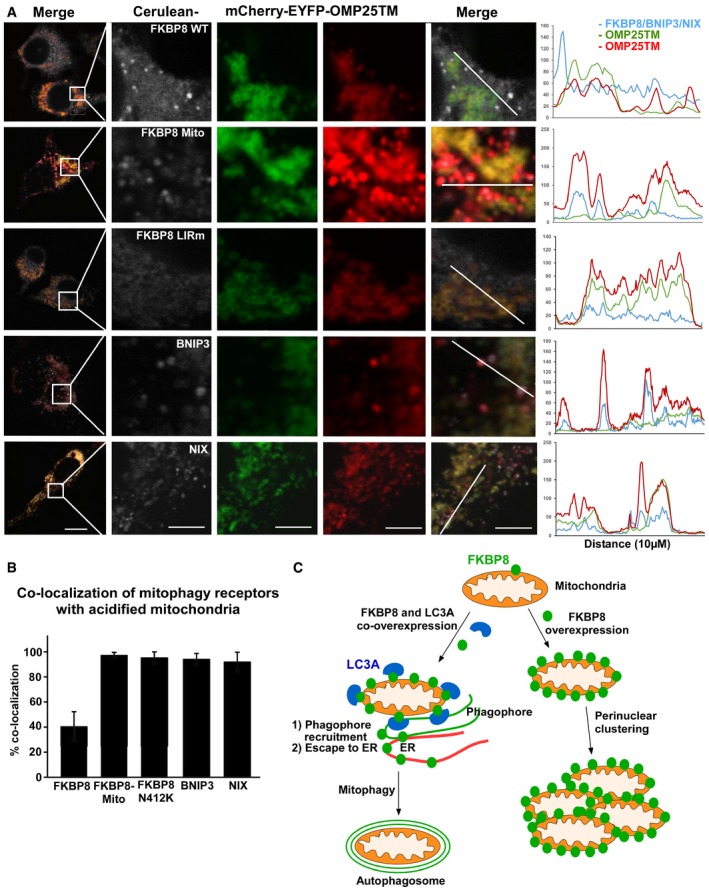
- HeLa cells were transiently transfected with mCherry‐EYFP‐OMP25TM and Flag‐LC3A expression constructs, together with Cerulean‐FKBP8 WT, Cerulean‐FKBP8 Mito, or Cerulean‐FKBP8 LIRm expression vectors; or mCherry‐EYFP‐OMP25TM together with Cerulean‐BNIP3 and Flag‐LC3B expression vectors; or mCherry‐EYFP‐OMP25TM together with Cerulean‐NIX and Flag‐GABARAP expression vectors. The cells were imaged using a Leica SP5 fluorescence confocal microscope. Scale bar, 10 μm; in zoomed images, 5 μm. Line‐profile co‐localization plots of Cerulean‐FKBP8 WT, Cerulean‐FKBP8 LIR mutant, Cerulean‐FKBP8 Mito, Cerulean‐BNIP3, or Cerulean‐NIX (blue lines) and mCherry‐EYFP‐OMP25TM (red and green lines) were made using the line‐profile quantification tool in the Leica imaging software (LAS‐AF). The vertical axes represent measurements of fluorescent intensity and the horizontal axis the drawn distances.
- Quantification of acidified mitochondria with co‐localized Cerulean‐FKBP8 WT or mutants, co‐localized Cerulean‐BNIP3, or co‐localized Cerulean‐NIX. The numbers of red‐only mCherry‐EYFP‐OMP25TM dots that contained enrichment of FKBP8 WT or mutants, enrichment of BNIP3, or enrichment of NIX, were quantitated manually in two independent experiments. The bars represent the average values from at least 100 cells in two independent experiments. Error bars represent s.d.
- Model of FKBP8‐mediated LC3A recruitment and subsequent escape of FKBP8 from mitochondria targeted for degradation by autophagy.
Figure EV5. Endogenous FKBP8 is not degraded during autophagy inducing conditions, whereas the FKBP8 N412K mutant is localized on acidified mitochondria.
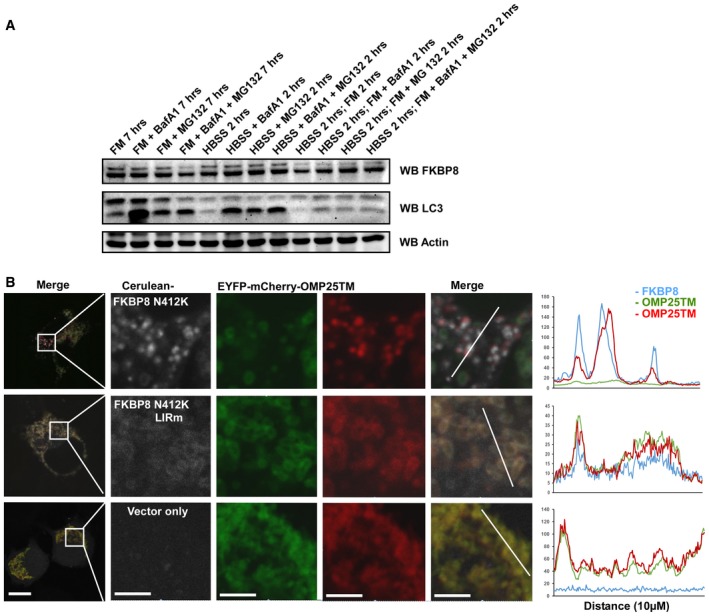
- HeLa cells were treated with Baf‐A1 or MG132 or starved with HBSS for the indicated times. Cells were harvested and subjected to Western blotting for analysis of endogenous FKBP8 and LC3B.
- HeLa cells were transiently transfected with mCherry‐GFP‐OMP25TM and Flag‐LC3A expression constructs, together with Cerulean‐FKBP8 N412K, Cerulean‐FKBP8 N412K + LIRm, or Cerulean‐only expression vectors. The cells were imaged using a Leica SP5 fluorescence confocal microscope. Scale bars, 10 μm; in zoomed images, 5 μm. Line‐profile co‐localization plots of Cerulean‐FKBP8 mutants (blue line) and mCherry‐GFP‐OMP25TM (red and green lines) were made using the line‐profile quantification tool in the Leica imaging software (LAS‐AF). The vertical axes represent measurements of fluorescent intensity and the horizontal axis the drawn distances.
The ability of FKBP8 and Bcl‐2 to translocate from mitochondria to ER is dependent on the number of basic amino acids in the C‐terminal TM domain. Substituting the absolute C‐terminal Asn residue with a Lys (N412K) in FKBP8 confines the proteins to the OMM 26. To explore if the escape observed in our mitophagy experiments is inhibited by swapping or mutating the TM of FKBP8, we first investigated if Cerulean‐FKBP8‐Mito was localized on acidified mitochondria when co‐expressed with Flag‐LC3A. Consistently, FKBP8‐Mito displayed strong ability to target mitochondria for acidic degradation, but stayed on the mitochondria undergoing mitophagy. No specific FKBP8‐Mito dots were observed outside the mitochondria (Fig 6A), and nearly 100% of the acidified mitochondria contained co‐localized FKBP8‐Mito (Fig 6B). Similar results were obtained when we overexpressed the FKBP8 N412K mutant, previously shown to be unable to escape 26 (Figs 6B and EV5B). Furthermore, co‐expression of FKBP8 LIRm with LC3A did not result in mitophagy, even if FKBP8 LIRm was confined to the mitochondria by introducing the N412K mutation (Fig EV5B). To summarize, these data clearly indicate that FKBP8 recruits the phagophore to the mitochondria through its LIR‐dependent interaction with lipidated LC3A. Subsequently, FKBP8 escapes to the ER dependent on its TM dual localization properties while the targeted mitochondria are degraded by autophagy (Fig 6C).
Discussion
FKBP8 (FKBP38) is a multifunctional OMM adaptor protein of the immunophilin family with Ca2+–calmodulin‐induced PPIase activity which has a potent anti‐apoptotic function via recruitment of Bcl‐2/Bcl‐XL to mitochondria (reviewed in 18, 19). In this study, we have identified FKBP8 as a novel mitophagy receptor. We identified a canonical LIR motif in its N‐terminus mediating strong binding to LC3A and moderate binding to LC3B in cells. FKBP8 recruited LC3A to damaged mitochondria in a LIR‐dependent manner. LC3A recruitment by FKBP8 to mitochondria inducing mitophagy is a novel observation, and this is the first study indicating a particular role for LC3A in mitophagy. Consistently, a very recent study by Nguyen et al 34 showed that in a background where all ATG8 members were knocked out, re‐expression of LC3A could mediate Parkin‐dependent mitophagy. The known mitophagy receptors preferentially recruit a distinct ATG8 protein for mitophagy induction, NIX recruits GABARAP‐L1 17, while Bcl‐2‐L13, BNIP3, and FUNDC1 preferentially recruit LC3B 14, 15, 16. Here, we add FKBP8 as a preferential LC3A recruiter to this panel of mitophagy receptors. Using the mCherry‐GFP‐OMP25TM mitophagy reporter assay, we show that this preferential recruitment is indeed reflected in the efficiency with which the different pairs of mitophagy receptors and ATG8 family members induce mitophagy (Fig 5B). Hence, we suggest that the OMM‐resident mitophagy receptors may engage distinct ATG8 members and act in a concerted manner to facilitate effective mitophagy when needed, while in some situations only one of the mitophagy receptors may be activated. Clearly, the possible interplay or redundancy between FKBP8, BNIP3, NIX, FUNDC1, and Bcl2‐L13 in mitophagy pathways and mitochondria quality control needs to be unraveled in future studies.
Several reports indicate that residues N‐ or C‐terminal to the core LIR motif may contribute to regulation and specificity of the interaction with ATG8 family proteins 35, 36, 37, 38. This also pertains to mitophagy receptors (reviewed in 1, 7, 39). The LIR motif identified in BNIP3 is preceded by an “acidic” residue, a serine that is phosphorylated and thus contributes to stronger LC3B binding and mitochondrial sequestration 40. This is also seen for FUNDC1 where ULK1 phosphorylates a serine residue at the same position 41. FUNDC1 also displays hypoxia‐regulated dephosphorylations of the core LIR Tyr18 residue and Ser13 (position −5) that increases binding to LC3B 16, 42. In contrast, the LIR‐containing region of FKBP8 does not contain any phosphorylatable residues. Different from FUNDC1 and BNIP3, the FKBP8‐LC3A/ATG8 interactions will not be regulated by phosphorylation of the LIR motif. Interestingly, we found that the FKBP8‐LC3A co‐localization was significantly enhanced upon CCCP treatment. How CCCP induces the strong FKBP8‐LC3A co‐localization will be an important question to address in future studies.
Crystal structures of the complex between the LIR motif of p62 and LC3B indicate that three acidic residues N‐terminal to the LIR motif of p62 interact with the basic surface of α‐helix‐1 of LC3B 43. FKBP8 has a E (Glu) and D (Asp) residue immediately preceding the core LIR motif, which may contribute to the increased affinity toward LC3A/B. FYCO1 contains a C‐terminally extended F‐type LIR motif where an acidic residue and a hydrophobic residue at positions +8 and +9, respectively, are important for efficient binding to LC3B explaining the C‐terminal extension 37. FKBP8 has an F‐type LIR motif that binds preferentially to LC3A and shares the acidic Glu residue at position +8 with FYCO1 (see Fig EV1B). Also, there are important differences in the electrostatic surface potential distribution on α‐helix1 and α‐helix2 in the structures of LC3A‐C, GABARAP/GABARAPL1, and GABARAPL2, respectively 44. These differences could contribute to the substrate specificities observed in in vitro assays. However, the lack of FKBP8 interaction with GABARAP and GABARAPL1 in cell extracts cannot be explained by their structures alone, since these proteins interacted strongly in vitro.
A previous study demonstrated that FKBP8 escapes during PINK1‐Parkin‐induced mitophagy and translocates to ER via a microtubule‐dependent pathway 26. Parkin‐dependent mitochondrial degradation does not depend on FKBP8 26. We find here that FKBP8 promotes mitophagy by LIR‐dependent recruitment of LC3A, independent of the PINK1‐Parkin pathway. Intriguingly, even when FKBP8 itself induced mitophagy, FKBP8 was found to escape from the acidified mitochondria. The mechanism responsible for this escape during mitochondria degradation begs further investigation. We also do not know how FKBP8 is activated as a mitophagy receptor or how the interplay is with the ubiquitin‐interacting autophagy receptors acting in mitophagy pathways including optineurin, NDP52, TAX1BP1, p62/SQSTM1, and NBR1 10, 45. Finally, it will be important to elucidate how the different roles of FKBP8 in anti‐apoptotic signaling, mTOR regulation, and mitophagy are integrated into a coordinated response.
Materials and Methods
Antibodies and reagents
The following primary antibodies were used: Rabbit polyclonal antibody for FKBP8 (ab96322, Abcam); rabbit monoclonal anti‐FKBP8 (Abcam, ab129113); mouse monoclonal anti‐MTCO2 (ab110258, Abcam); anti‐Myc (Santa Cruz 9E10); mouse monoclonal anti‐FLAG M2 antibody (F1804, Sigma); anti‐GST (SC‐459, Santa Cruz); rabbit polyclonal anti‐GFP (ab290, Abcam); rabbit polyclonal anti‐LC3B (L7543, Sigma); rabbit polyclonal anti‐LC3A (ab62720, Abcam); and HRP‐conjugated anti‐GST (RPN1236, GE Healthcare). Secondary antibodies were the following: HRP (horseradish peroxidase)‐conjugated goat anti‐rabbit Ig (554021, BD Bioscience Pharmingen), goat anti‐mouse Ig (554002, BD Bioscience Pharmingen), and HRP‐conjugated anti‐Biotin antibody (Cat. no‐7075, Cell Signaling). Following fluorescent secondary antibodies were used: Alexa Fluor® 488‐conjugated goat anti‐mouse IgG (A‐11029, Life Technologies), Alexa Fluor® 488‐conjugated goat anti‐rabbit IgG (A‐11008, Life Technologies), Alexa Fluor® 555‐conjugated goat anti‐rabbit IgG (A‐21428, Life Technologies), and Alexa Fluor® 647‐conjugated goat anti‐mouse IgG (A21236). The reagents used were bafilomycin A1 (B1793, Sigma) and carbonyl cyanide 3‐chlorophenylhydrazone (CCCP) (C2759, Sigma).
Cell culture and transfections
HeLa (ATCC, CCL2) cells were cultured in Eagle's minimum essential medium with 10% fetal bovine serum (Biochrom AG, S0615), non‐essential amino acids, 2 mM L‐glutamine, and 1% streptomycin–penicillin (Sigma, P4333). HeLa Flp‐In T‐REx cells (Invitrogen, R714‐07) with GFP‐LC3A integrated at FRT site were grown in the same medium with additional selection marker antibiotics, 100 μg/ml hygromycin B (Calbiochem, 400051) and 7.5 μg/ml Blasticidine (Invitrogen, R210‐01). HEK293 (ATCC, CRL‐1573), HEK293 Flp‐In T‐Rex cells (Invitrogen, R780‐07), and SH‐SY5Y cells (ATCC CRL‐2266) were cultured in Dulbecco's modified Eagle's medium with the same supplements as described above for HeLa cells. Subconfluent cells were transfected using TransIT‐LT1 (Mirus, MIR2300) or METAFECTENE PRO (Biontex T040) following the manufacturer′s instructions.
Construction of plasmids
All plasmids used in this study are listed in Appendix Table S1. Plasmids were made by conventional restriction enzyme‐based cloning or by use of the Gateway recombination system from Invitrogen. Gateway LR reactions were performed as described in the Gateway cloning technology instruction manual. Full‐length clone for FKBP8 was obtained from Imogene's/Source Bioscience. (Id: OCAAo5051A117D). We used a PCR‐based strategy to obtain the following truncated and organelle‐specific constructs for FKBP8: Transmembrane (TM) domain deletion construct (FKBP8 ∆TM); mitochondria directed construct (FKBP8‐Mito) where the TM domain is replaced with the mitochondria‐specific insertion sequence from the ActA protein from Listeria monocytogenes; endoplasmic reticulum directed construct (FKBP8‐ER) where the TM domain is replaced with a C‐terminal peptide tag with the insertion sequence from the endoplasmic reticulum‐specific isoform of cytochrome b5 (Cb.5) 30, 31. Oligonucleotides corresponding to the ActA and Cb.5 targeting sequences were annealed and cloned using EcoRI/NotI restriction sites adjacent to amino acid 380 (ActA) and amino acid 390 (Cb‐5) of FKBP8. cDNA obtained from HeLa cells was used to amplify full‐length BNIP3 by a PCR‐based strategy and cloned into a gateway‐compatible donor or entry vector (Invitrogen). OMP25‐TM (109‐145) was cloned by annealing the corresponding sequence of the TM domain and cloned into Gateway‐compatible entry vector using EcoRI/NotI. pDONR‐OMP25‐TM (109‐145) was obtained by amplifying ENTR‐OMP25‐TM by PCR and cloned into Gateway‐compatible donor vector. Full‐length human NIX construct was a kind gift from Dr. Ivan Dikic. Specific point mutations were generated using QuickChange site‐directed mutagenesis strategy (Stratagene, 200523). All plasmids were verified by restriction enzyme digestion and DNA sequencing (BigDye, Applied Biosystems, 4337455). Oligonucleotides for mutagenesis, PCR, annealing, and DNA sequencing reactions were obtained from Invitrogen and Sigma‐Aldrich. Oligonucleotides used for TM domain deletion or swapping and CRISPR/Cas9 knockout are listed in Appendix Table S1.
Recombinant protein production and GST‐pulldown analysis
GST or GST‐tagged proteins were expressed in Escherichia coli strain SoluBL21 (Genlantis). GST or GST fusion proteins were purified and immobilized on Glutathione Sepharose 4 Fast Flow beads (GE Healthcare, 17‐5132‐01). In vitro‐translated protein or total cell lysate was pre‐incubated with 10 μl of Glutathione Sepharose beads with 100 μl of NETN buffer (50 mM Tris pH 8.0, 150 mM NaCl, 1 mM EDTA, 0.5% Nonidet P‐40) with cOmplete Mini EDTA‐free protease inhibitor mixture tablets (1 tablet/10 ml) (11836170001, Roche Applied Science) for 1 h at 4°C to reduce unspecific binding. Pre‐incubated (pre‐cleared) lysate was then incubated with the immobilized GST fusion protein for 2 h at 4°C. Beads were washed five times with NETN buffer, boiled with 2×SDS gel loading buffer (125 mM Tris, pH 7.5; 4% SDS, 0.04% bromphenol blue, 8% sucrose, 100 mM dithiothreitol) and subjected to SDS–PAGE. Gels were stained with Coomassie brilliant blue to visualize GST fusion proteins and then vacuum‐dried. Signals from 35S‐labeled protein were detected using a Fujifilm bioimaging analyzer BAS‐5000 (Fuji). Signals from 35S‐labeled proteins were measured in terms of unit of photostimulated luminescent (PSL) and quantitated in comparison with 10% of the in vitro‐translated lysate using the Image Gauge software (Fuji).
SPOT synthesis and peptide array
FKBP8 peptide arrays were synthesized on cellulose membranes using MultiPrep peptide synthesizer (INTAVIS Bioanalytical Instruments AG, Germany). Membranes were blocked with 5% non‐fat dry milk in TBST and peptide interactions were tested with GST, GST‐GABARAP or GST‐LC3A by overlaying the membrane with 1 μg/ml of recombinant protein and incubating for 2 h at room temperature. Bound proteins were visualized with HRP‐conjugated anti‐GST antibody.
Immunoprecipitation and immunoblotting
Transfected cells were rinsed with ice‐cold PBS prior to lysis in ice‐cold RIPA buffer (50 mM Tris, pH 7.5; 150 mM NaCl; 1 mM EDTA; 1% NP40; 0.25% Triton‐X) supplemented with cOmplete Mini EDTA‐free protease inhibitor mixture (Roche) for 30 min on ice. Cell lysates were cleared by centrifugation and the supernatant incubated for 1 h with protein A‐agarose or protein G‐agarose beads (sc‐2001; sc‐2002 Santa Cruz) to remove unspecific bound fraction. The pre‐cleared lysates were incubated with the indicated primary antibodies overnight at 4°C and then for 1.5 h with protein A‐agarose or protein G‐agarose beads. Precipitated immunocomplexes were washed five times with RIPA buffer before elution by boiling for 5 min in 2×SDS gel loading buffer (125 mM Tris, pH 7.5; 4% SDS, 0.04% bromphenol blue, 8% sucrose, 100 mM dithiothreitol). For IP of endogenous proteins, cells were rinsed with PBS and incubated on ice for 5 min with CHAPS buffer (40 mM HEPES, pH 7.5; 120 mM NaCl; 1 mM EDTA; 0.5% CHAPS) supplemented with cOmplete Mini EDTA‐free protease inhibitor mixture (Roche) and phosphatase inhibitor cocktail. Cells were scraped and pooled suspension passed through a 25‐G needle 10‐20 times before centrifugation at 16,000 × g for 10 min. The resultant supernatant was incubated for 1 h with protein A‐agarose or protein G‐agarose beads (sc‐2001; sc‐2002 Santa Cruz). The pre‐cleared lysate was further incubated with primary antibody overnight at 4°C, followed by incubation with protein A‐agarose or protein G‐agarose beads for 90 min. The precipitated immunocomplex was washed five times with CHAPS buffer and protein eluted by boiling for 5 min with 2×SDS gel loading buffer. For immunoprecipitation of FLAG‐tagged constructs, cell lysates were made as described above and incubated with anti‐FLAG M2 agarose beads (Sigma, A2220) at 4°C overnight. The beads were then washed five times with RIPA buffer and protein complexes eluted with 3×FLAG fusion peptide (Sigma F4799). For immunoblotting, samples were then resolved by SDS–PAGE and transferred to Hybond‐ECL nitrocellulose membrane (GE healthcare). Transfer was visualized with Ponceau S staining, and the membrane was blocked with 5% non‐fat dry milk in TBST. The membrane was incubated with primary antibody overnight at 4°C followed by incubation with HRP‐conjugated secondary antibody for 1 hr at room temperature. Signal detection was preformed with a Western blotting Luminal Reagent kit (SC‐2048, Santa Cruz Biotechnology) and a LumiAnalyst imager (Roche Applied Sciences).
Immunostaining and fluorescence confocal microscopy
HeLa or HEK293 cells grown in 8‐well chambers (Cat. No. 155411) were fixed with 4% paraformaldehyde, permeabilized with methanol on ice for 10 min, blocked in 3% goat serum/PBS, and incubated at room temperature with a specific primary antibody followed by Alexa Fluor 488‐, Fluor 555‐, or Fluor 647‐conjugated secondary antibody. Note all the cells used for fluorescence microscopy analysis of mitochondria were fixed with 4% paraformaldehyde (PFA) or 4% PFA with 0.5% glutaraldehyde in PBS at 37°C for 15 min, to avoid morphological changes of mitochondria and allow visualization of acidic structures after the staining procedure. The cells were then examined using a Zeiss Axiovert 200 microscope with a 40 × 1.2 WC‐Apochromat objective, equipped with LSM‐510‐META module, or a Leica TCS SP5 confocal microscope, 63 × 1.2W‐objective. For quantitative analysis of mitochondrial area and intensity of the OMM protein TOM20, Volocity 6.2.1. (PerkinElmer, Inc.) software was used. TOM20 intensity and area was measured by “Lasso” tool in the measurement section, corresponding cell area was drawn with the ROI tool and relative TOM20 area was calculated per cell in 30–40 independent cells. The line‐profile tool in the Leica imaging software (LAS‐AF) was exploited to plot co‐localization of fluorescent or immunostained proteins. Quantification of cells containing red‐only dots in cells expressing mCherry‐GFP‐OMP25‐TM/mCherry‐EYFP‐OMP25‐TM (indicative of mitophagy activity) was done manually in 50–70 cells from cell images in three independent experiments.
Generation of FKBP8 knockout HeLa/HEK293 cell line
To generate a knockout cell line for FKBP8, the CRISPR/Cas9 system was exploited 46, 47. Oligonucleotides targeting the second exon of FKBP8 were annealed and cloned into guide RNA vector “pSpCas9(BB)‐2A‐Puro (PX459) (Addgene#48139)” using Bbs‐I restriction sites. Subconfluent HEK293 Flp‐In/HeLa‐Flp‐In cells were transfected with the targeting plasmid. Three days post‐transfection, selection with puromycin was carried out. Selection was continued until cells transfected with a control plasmid (EGFP‐c1) and untransfected cells were lost. After selection, cells were trypsinized and sorted by FACS. Single cells were isolated and plated in a 96‐well plate. Colonies were expanded up to 12‐well plates before Western blot analysis to confirm knockout of FKBP8 (Fig EV2B). Furthermore, to confirm targeted knockout of FKBP8, we performed genomic DNA isolation for each clone, PCR‐amplified at least 100 bp upstream and downstream of the target region (crossing from exon to intron), and cloned the resulting PCR products into the pGEM‐T‐EASy vector (Promega). Sequencing was conducted for at least 3 or 4 plasmids for each PCR product. Primers for amplification of the genomic region and targeting oligonucleotide are listed in Appendix Table S1. Sequencing of the genomic region of three knockout clones, compared with the parenteral wild‐type cell line, indicated frame shift mutations, insertion, and deletion. To visualize the complete knockout of FKBP8, we performed immunofluorescence analysis of knockout clones in comparison with parenteral cell line. Parenteral cell line HEK293 Flp‐In/HeLa‐Flp‐In and knockout clone cells were fixed with 4% PFA followed by staining with anti‐FKBP8 antibody. As shown in Fig EV2, knockout cells derived from single‐cell clones C3 and C4 for HEK293 and clones A4 and B1 for HeLa; do not reveal any staining for FKBP8.
Author contributions
ZB performed most of the experiments with assistance from ES, HBB, SH, and AØ on some experiments. Throughout, TJ, ÅBB, ES, and TL designed experiments and analyzed data together with ZB, VK assisted in analyzing data. ZB, ÅBB, TL, ES, and TJ wrote the manuscript. All authors discussed the results and commented on the manuscript, and TJ supervised the work.
Conflict of interest
The authors declare that they have no conflict of interest.
Supporting information
Appendix
Expanded View Figures PDF
Review Process File
Source Data for Figure 4
Acknowledgements
The technical assistance of Gry Evjen is greatly appreciated. We are very grateful to Ivan Dikic for the NIX cDNA construct and to Peter K. Kim for mCherry‐GFP‐OMP25‐TM (also called mCherry‐mGFP‐SYNJ2BP). We thank the Bioimaging (KAM) and the Proteomics (TUPP) core facilities at the Department of Medical Biology, UiT—The Arctic University of Norway, for use of instrumentation and expert assistance. This work was funded by grants from the FRIBIO and FRIBIOMED programs of the Norwegian Research Council (grant numbers 196898 and 214448), and the Norwegian Cancer Society (grant number 71043‐PR‐2006‐0320) to T.J.
EMBO Reports (2017) 18: 947–961
See also: GGY Lim & KL Lim (June 2017)
References
- 1. Hamacher‐Brady A, Brady NR (2016) Mitophagy programs: mechanisms and physiological implications of mitochondrial targeting by autophagy. Cell Mol Life Sci 73: 775–795 [DOI] [PMC free article] [PubMed] [Google Scholar]
- 2. Mishra P, Chan DC (2014) Mitochondrial dynamics and inheritance during cell division, development and disease. Nat Rev Mol Cell Biol 15: 634–646 [DOI] [PMC free article] [PubMed] [Google Scholar]
- 3. Detmer SA, Chan DC (2007) Functions and dysfunctions of mitochondrial dynamics. Nat Rev Mol Cell Biol 8: 870–879 [DOI] [PubMed] [Google Scholar]
- 4. Shirihai OS, Song M, Dorn GW II (2015) How mitochondrial dynamism orchestrates mitophagy. Circ Res 116: 1835–1849 [DOI] [PMC free article] [PubMed] [Google Scholar]
- 5. Shpilka T, Weidberg H, Pietrokovski S, Elazar Z (2011) Atg8: an autophagy‐related ubiquitin‐like protein family. Genome Biol 12: 226 [DOI] [PMC free article] [PubMed] [Google Scholar]
- 6. Pankiv S, Clausen TH, Lamark T, Brech A, Bruun JA, Outzen H, Overvatn A, Bjorkoy G, Johansen T (2007) p62/SQSTM1 binds directly to Atg8/LC3 to facilitate degradation of ubiquitinated protein aggregates by autophagy. J Biol Chem 282: 24131–24145 [DOI] [PubMed] [Google Scholar]
- 7. Birgisdottir AB, Lamark T, Johansen T (2013) The LIR motif – crucial for selective autophagy. J Cell Sci 126: 3237–3247 [DOI] [PubMed] [Google Scholar]
- 8. Koyano F, Okatsu K, Kosako H, Tamura Y, Go E, Kimura M, Kimura Y, Tsuchiya H, Yoshihara H, Hirokawa T et al (2014) Ubiquitin is phosphorylated by PINK1 to activate parkin. Nature 510: 162–166 [DOI] [PubMed] [Google Scholar]
- 9. Narendra D, Tanaka A, Suen DF, Youle RJ (2008) Parkin is recruited selectively to impaired mitochondria and promotes their autophagy. J Cell Biol 183: 795–803 [DOI] [PMC free article] [PubMed] [Google Scholar]
- 10. Lazarou M, Sliter DA, Kane LA, Sarraf SA, Wang C, Burman JL, Sideris DP, Fogel AI, Youle RJ (2015) The ubiquitin kinase PINK1 recruits autophagy receptors to induce mitophagy. Nature 524: 309–314 [DOI] [PMC free article] [PubMed] [Google Scholar]
- 11. Wong YC, Holzbaur EL (2014) Optineurin is an autophagy receptor for damaged mitochondria in parkin‐mediated mitophagy that is disrupted by an ALS‐linked mutation. Proc Natl Acad Sci USA 111: E4439–E4448 [DOI] [PMC free article] [PubMed] [Google Scholar]
- 12. Okamoto K, Kondo‐Okamoto N, Ohsumi Y (2009) Mitochondria‐anchored receptor Atg32 mediates degradation of mitochondria via selective autophagy. Dev Cell 17: 87–97 [DOI] [PubMed] [Google Scholar]
- 13. Kanki T, Wang K, Cao Y, Baba M, Klionsky DJ (2009) Atg32 is a mitochondrial protein that confers selectivity during mitophagy. Dev Cell 17: 98–109 [DOI] [PMC free article] [PubMed] [Google Scholar]
- 14. Murakawa T, Yamaguchi O, Hashimoto A, Hikoso S, Takeda T, Oka T, Yasui H, Ueda H, Akazawa Y, Nakayama H et al (2015) Bcl‐2‐like protein 13 is a mammalian Atg32 homologue that mediates mitophagy and mitochondrial fragmentation. Nat Commun 6: 7527 [DOI] [PMC free article] [PubMed] [Google Scholar]
- 15. Hanna RA, Quinsay MN, Orogo AM, Giang K, Rikka S, Gustafsson AB (2012) Microtubule‐associated protein 1 light chain 3 (LC3) interacts with Bnip3 protein to selectively remove endoplasmic reticulum and mitochondria via autophagy. J Biol Chem 287: 19094–19104 [DOI] [PMC free article] [PubMed] [Google Scholar]
- 16. Liu L, Feng D, Chen G, Chen M, Zheng Q, Song P, Ma Q, Zhu C, Wang R, Qi W et al (2012) Mitochondrial outer‐membrane protein FUNDC1 mediates hypoxia‐induced mitophagy in mammalian cells. Nat Cell Biol 14: 177–185 [DOI] [PubMed] [Google Scholar]
- 17. Novak I, Kirkin V, McEwan DG, Zhang J, Wild P, Rozenknop A, Rogov V, Lohr F, Popovic D, Occhipinti A et al (2010) Nix is a selective autophagy receptor for mitochondrial clearance. EMBO Rep 11: 45–51 [DOI] [PMC free article] [PubMed] [Google Scholar]
- 18. Edlich F, Lucke C (2011) From cell death to viral replication: the diverse functions of the membrane‐associated FKBP38. Curr Opin Pharmacol 11: 348–353 [DOI] [PubMed] [Google Scholar]
- 19. Shirane‐Kitsuji M, Nakayama KI (2014) Mitochondria: FKBP38 and mitochondrial degradation. Int J Biochem Cell Biol 51: 19–22 [DOI] [PubMed] [Google Scholar]
- 20. Shirane M, Nakayama KI (2003) Inherent calcineurin inhibitor FKBP38 targets Bcl‐2 to mitochondria and inhibits apoptosis. Nat Cell Biol 5: 28–37 [DOI] [PubMed] [Google Scholar]
- 21. Thomson AW, Bonham CA, Zeevi A (1995) Mode of action of tacrolimus (FK506): molecular and cellular mechanisms. Ther Drug Monit 17: 584–591 [DOI] [PubMed] [Google Scholar]
- 22. Choi BH, Feng L, Yoon HS (2010) FKBP38 protects Bcl‐2 from caspase‐dependent degradation. J Biol Chem 285: 9770–9779 [DOI] [PMC free article] [PubMed] [Google Scholar]
- 23. Haupt K, Jahreis G, Linnert M, Maestre‐Martinez M, Malesevic M, Pechstein A, Edlich F, Lucke C (2012) The FKBP38 catalytic domain binds to Bcl‐2 via a charge‐sensitive loop. J Biol Chem 287: 19665–19673 [DOI] [PMC free article] [PubMed] [Google Scholar]
- 24. Bai X, Ma D, Liu A, Shen X, Wang QJ, Liu Y, Jiang Y (2007) Rheb activates mTOR by antagonizing its endogenous inhibitor, FKBP38. Science 318: 977–980 [DOI] [PubMed] [Google Scholar]
- 25. Zou H, Lai Y, Zhao X, Yan G, Ma D, Cardenes N, Shiva S, Liu Y, Bai X, Jiang Y et al (2013) Regulation of mammalian target of rapamycin complex 1 by Bcl‐2 and Bcl‐XL proteins. J Biol Chem 288: 28824–28830 [DOI] [PMC free article] [PubMed] [Google Scholar]
- 26. Saita S, Shirane M, Nakayama KI (2013) Selective escape of proteins from the mitochondria during mitophagy. Nat Commun 4: 1410 [DOI] [PubMed] [Google Scholar]
- 27. Kirkin V, Lamark T, Sou YS, Bjorkoy G, Nunn JL, Bruun JA, Shvets E, McEwan DG, Clausen TH, Wild P et al (2009) A role for NBR1 in autophagosomal degradation of ubiquitinated substrates. Mol Cell 33: 505–516 [DOI] [PubMed] [Google Scholar]
- 28. Alemu EA, Lamark T, Torgersen KM, Birgisdottir AB, Larsen KB, Jain A, Olsvik H, Overvatn A, Kirkin V, Johansen T (2012) ATG8 family proteins act as scaffolds for assembly of the ULK complex: sequence requirements for LC3‐interacting region (LIR) motifs. J Biol Chem 287: 39275–39290 [DOI] [PMC free article] [PubMed] [Google Scholar]
- 29. Klionsky DJ, Abdelmohsen K, Abe A, Abedin MJ, Abeliovich H, Acevedo Arozena A, Adachi H, Adams CM, Adams PD, Adeli K et al (2016) Guidelines for the use and interpretation of assays for monitoring autophagy (3rd edition). Autophagy 12: 1–222 [DOI] [PMC free article] [PubMed] [Google Scholar]
- 30. Pistor S, Chakraborty T, Niebuhr K, Domann E, Wehland J (1994) The ActA protein of Listeria monocytogenes acts as a nucleator inducing reorganization of the actin cytoskeleton. EMBO J 13: 758–763 [DOI] [PMC free article] [PubMed] [Google Scholar]
- 31. Zhu W, Cowie A, Wasfy GW, Penn LZ, Leber B, Andrews DW (1996) Bcl‐2 mutants with restricted subcellular location reveal spatially distinct pathways for apoptosis in different cell types. EMBO J 15: 4130–4141 [PMC free article] [PubMed] [Google Scholar]
- 32. Wang Y, Serricchio M, Jauregui M, Shanbhag R, Stoltz T, Di Paolo CT, Kim PK, McQuibban GA (2015) Deubiquitinating enzymes regulate PARK2‐mediated mitophagy. Autophagy 11: 595–606 [DOI] [PMC free article] [PubMed] [Google Scholar]
- 33. Youle RJ, van der Bliek AM (2012) Mitochondrial fission, fusion, and stress. Science 337: 1062–1065 [DOI] [PMC free article] [PubMed] [Google Scholar]
- 34. Nguyen TN, Padman BS, Usher J, Oorschot V, Ramm G, Lazarou M (2016) Atg8 family LC3/GABARAP proteins are crucial for autophagosome‐lysosome fusion but not autophagosome formation during PINK1/Parkin mitophagy and starvation. J Cell Biol 215: 857–874 [DOI] [PMC free article] [PubMed] [Google Scholar]
- 35. Lystad AH, Ichimura Y, Takagi K, Yang Y, Pankiv S, Kanegae Y, Kageyama S, Suzuki M, Saito I, Mizushima T et al (2014) Structural determinants in GABARAP required for the selective binding and recruitment of ALFY to LC3B‐positive structures. EMBO Rep 15: 557–565 [DOI] [PMC free article] [PubMed] [Google Scholar]
- 36. McEwan DG, Dikic I (2011) The three musketeers of autophagy: phosphorylation, ubiquitylation and acetylation. Trends Cell Biol 21: 195–201 [DOI] [PMC free article] [PubMed] [Google Scholar]
- 37. Olsvik HL, Lamark T, Takagi K, Bowitz Larsen K, Evjen G, Overvatn A, Mizushima T, Johansen T (2015) FYCO1 contains a C‐terminally extended, LC3A/B‐preferring LC3‐interacting region (LIR) motif required for efficient maturation of autophagosomes during basal autophagy. J Biol Chem 290: 29361–29374 [DOI] [PMC free article] [PubMed] [Google Scholar]
- 38. Wild P, Farhan H, McEwan DG, Wagner S, Rogov VV, Brady NR, Richter B, Korac J, Waidmann O, Choudhary C et al (2011) Phosphorylation of the autophagy receptor optineurin restricts Salmonella growth. Science 333: 228–233 [DOI] [PMC free article] [PubMed] [Google Scholar]
- 39. Rogov V, Dotsch V, Johansen T, Kirkin V (2014) Interactions between autophagy receptors and ubiquitin‐like proteins form the molecular basis for selective autophagy. Mol Cell 53: 167–178 [DOI] [PubMed] [Google Scholar]
- 40. Zhu Y, Massen S, Terenzio M, Lang V, Chen‐Lindner S, Eils R, Novak I, Dikic I, Hamacher‐Brady A, Brady NR (2013) Modulation of serines 17 and 24 in the LC3‐interacting region of Bnip3 determines pro‐survival mitophagy versus apoptosis. J Biol Chem 288: 1099–1113 [DOI] [PMC free article] [PubMed] [Google Scholar]
- 41. Wu W, Tian W, Hu Z, Chen G, Huang L, Li W, Zhang X, Xue P, Zhou C, Liu L et al (2014) ULK1 translocates to mitochondria and phosphorylates FUNDC1 to regulate mitophagy. EMBO Rep 15: 566–575 [DOI] [PMC free article] [PubMed] [Google Scholar]
- 42. Chen G, Han Z, Feng D, Chen Y, Chen L, Wu H, Huang L, Zhou C, Cai X, Fu C et al (2014) A regulatory signaling loop comprising the PGAM5 phosphatase and CK2 controls receptor‐mediated mitophagy. Mol Cell 54: 362–377 [DOI] [PubMed] [Google Scholar]
- 43. Maruyama Y, Sou YS, Kageyama S, Takahashi T, Ueno T, Tanaka K, Komatsu M, Ichimura Y (2014) LC3B is indispensable for selective autophagy of p62 but not basal autophagy. Biochem Biophys Res Commun 446: 309–315 [DOI] [PubMed] [Google Scholar]
- 44. Sugawara K, Suzuki NN, Fujioka Y, Mizushima N, Ohsumi Y, Inagaki F (2004) The crystal structure of microtubule‐associated protein light chain 3, a mammalian homologue of Saccharomyces cerevisiae Atg8. Genes Cells 9: 611–618 [DOI] [PubMed] [Google Scholar]
- 45. Richter B, Sliter DA, Herhaus L, Stolz A, Wang C, Beli P, Zaffagnini G, Wild P, Martens S, Wagner SA et al (2016) Phosphorylation of OPTN by TBK1 enhances its binding to Ub chains and promotes selective autophagy of damaged mitochondria. Proc Natl Acad Sci USA 113: 4039–4044 [DOI] [PMC free article] [PubMed] [Google Scholar]
- 46. Ran FA, Hsu PD, Wright J, Agarwala V, Scott DA, Zhang F (2013) Genome engineering using the CRISPR‐Cas9 system. Nat Protoc 8: 2281–2308 [DOI] [PMC free article] [PubMed] [Google Scholar]
- 47. Mali P, Yang L, Esvelt KM, Aach J, Guell M, DiCarlo JE, Norville JE, Church GM (2013) RNA‐guided human genome engineering via Cas9. Science 339: 823–826 [DOI] [PMC free article] [PubMed] [Google Scholar]
Associated Data
This section collects any data citations, data availability statements, or supplementary materials included in this article.
Supplementary Materials
Appendix
Expanded View Figures PDF
Review Process File
Source Data for Figure 4


