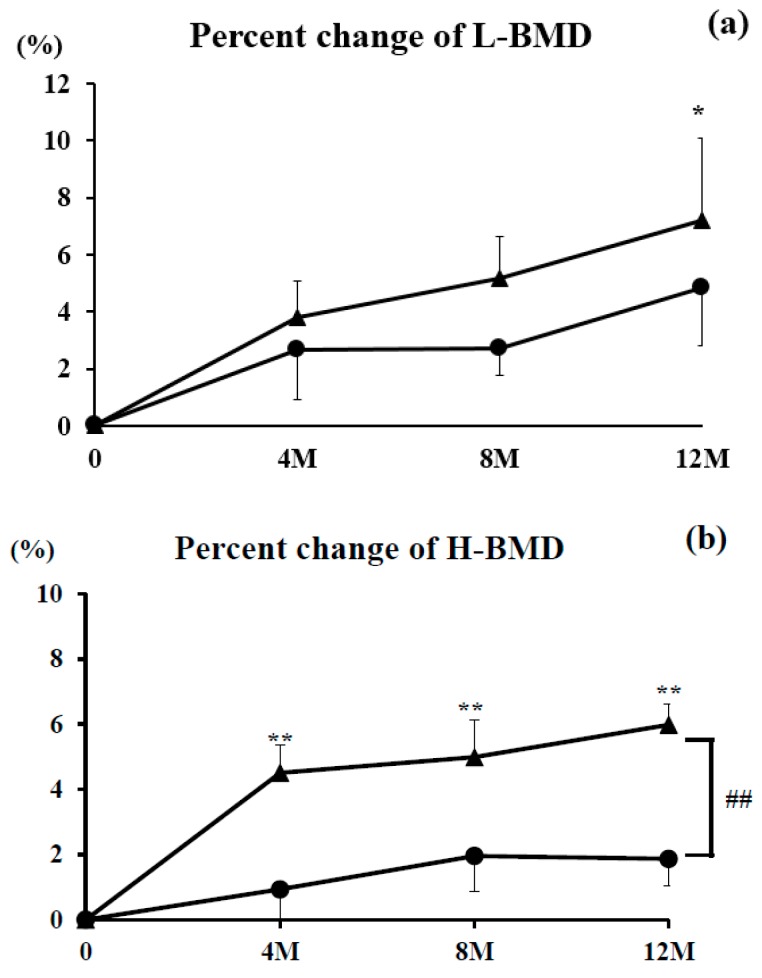
Figure 3.
Percent changes in lumbar bone mineral density (L-BMD) (a) and bilateral total hip BMD (H-BMD) (b) over the 12-month study period. Closed circles show the denosumab monotherapy group and closed triangles show the combination group. Double asterisks (**) denote significant differences (p < 0.01) at each time point compared with pretreatment in the denosumab monotherapy or combination groups. Double hashtags (##) show significant differences (p < 0.01) between the denosumab monotherapy and combination groups at each time point.

