

Abstract
Background:
Cyclosporin (CsA) has been extensively used as the immunosuppressant of choice in renal transplantation. Currently available approaches to assess CsA levels, both in serum and blood, fail to accurately reflect the concentration of the pharmacologically active drug fraction. Free CsA levels in biological fluids (blood or saliva) have been advocated to play an important role. Traditional salivary CsA monitoring tests are based on available archaic salivary techniques that are nonspecific and require large amounts of saliva. The aim of this study was to assess salivary CsA correlation using a novel and more accurate technique and to correlate with CsA levels in blood.
Material and Methods:
Patients provided blood samples of 2 ml and 2 ml of unstimulated saliva on the same day 2 h after the morning CsA dose (C2). Whole blood levels of CsA were determined using the monoclonal fluorescent polarization immunoassay (FPIA) kit. The FPIA kit was adapted to salivary testing by using a novel extraction method developed and patented under the name of Middle East Research Institute (MERI). Wilcoxon signed rank test compared the differences in blood and salivary CsA. Pearson's correlation coefficient assessed the linear association between blood and salivary CsA concentrations. All analyses were performed using IBM-SPSS version 23 (IBM Corp, Armonk, NY, USA).
Results:
No significant correlation was observed between blood and salivary CsA levels.
Conclusion:
Salivary CsA concentrations at C2 cannot adequately replace C2 blood levels as an indicator of CsA bioavailability despite improved performance of monoclonal FPIA and application of the MERI technique. More studies may be warranted to design more reliable and less invasive procedures for therapeutic drug monitoring.
KEYWORDS: Cyclosporin A, monoclonal fluorescent polarization immunoassay, renal transplants, salivary levels, whole blood levels
INTRODUCTION
Cyclosporin A (CsA) is a lipophylic cyclic polypeptide that has been extensively used as the immunosuppressant of choice in organs transplantations.[1] Given its narrow therapeutic index and a significant intra- and interindividual variability, CsA therapeutic concentrations must be routinely monitored to avoid renal graft rejection and/or adverse effects including nephrotoxicity, hepatotoxicity, and neurotoxicity.[1]
The assessment of whole blood CsA level is the usual approach used for therapeutic drug monitoring in renal transplant patients to provide therapeutic guidelines.[2] Monitoring of whole blood levels consists of repeated sampling to determine the area under the time–concentration curve over a period of 4 h after administration (AUC0–4h). Although the 4-h AUC identifies the therapeutic window and enables avoidance of underdosing or overdosing, it is not practical in clinical practice. The use of the single blood CsA concentration measured 2 h after administration (C2) has been proposed as an alternative.[2] In addition to being easier to obtain as part of the patient's ongoing medical care,[2] single serum C2 measures have been shown to correlate better with AUC0–4h than trough levels (C0) (CsA blood level before morning dose) and to better reflect the maximal immunosuppressive effect of CsA.[2,3,4,5,6,7] Furthermore, the proportion of cluster of differentiation 4 (CD4+) lymphocytes producing interleukin-2 (IL-2) is the lowest at 2 h post-dose in renal transplant recipients.[8]
Monitoring CsA in saliva, which has been described as an ultrafiltrate of plasma, has been suggested as an alternative to blood therapeutic drug monitoring in children and patients with difficult venous access.[9] Measurement of salivary concentrations offers several advantages over blood sampling – it does not require any venipuncture, it can be easily performed by the patient or caregiver, and has low cost storage.[10] However, whether the concentration of CsA in saliva is truly representative of the therapeutic drug levels in blood is an area of research that has not yet been fully elucidated. The objective of this study was to investigate the correlation between salivary CsA concentration and whole blood therapeutic CsA level using a novel extraction method of CsA from saliva developed and patented under the name of Middle East Research Institute (MERI). We hypothesized that this technique would enhance the accuracy of the noninvasive technique of CsA level measurements in saliva andcould then potentially replace the whole blood CsA method.
MATERIALS AND METHODS
STUDY POPULATION
All the renal transplant outpatient clinics at three major hospitals in Beirut, Lebanon – Saint-Georges, Rizk and Hôtel-Dieu de France – were included in our study (n = 33). The sample consisted of 17 females (52%) and 16 males (48%), age ranging from 20 to 50 years. Patients were included in the study if they: (1) had been in CsA therapy for at least 6 months prior to the study; (2) had been receiving a daily oral dose ranging between 1 mg and 8 mg/kg; and (3) were in a stable systemic condition and showed no renal graft rejection.
The study was approved by the ethical committees of the three institutions (ID: SAJF 11/04). In addition, written informed consent was obtained from all patients prior to initiating data collection. At the baseline, a full drug history was obtained from the patients' hospital records.
MEASUREMENT OF CYCLOSPORIN WHOLE BLOOD CONCENTRATION
Blood samples (2 ml) were collected in the Laboratory of Immunopathology at Rizk Hospital 2 h after the CsA morning dose. Whole blood levels of CsA were determined on the same day using the monoclonal FPIA kit (TDx®/TDxFLx® Cyclosporin Monoclonal, Abbott Diagnostics®, Wiesbaden, Germany) using a random and continuous access immunoassay analyzer.[11,12,13,14]
Calibrators, controls, reagents, and patient specimens were allowed to come to room temperature. One hundred fifty μl of each blood sample to be assayed were mixed with 50 μL of Solubilization Reagent (surfactant in water containing the preservative sodium azide and 300 μL of whole blood) and Precipitation Reagent/Probe wash (zinc sulfate solution in methanol and ethylene glycol in 2:35 ratio) for 10 s. This pretreatment of samples was applied to lyse the erythrocytes in whole blood and minimize interference from endogenous protein-bound fluorescent compounds. Subsequently, the tubes were centrifuged for 10 min at 10900 rpm. A clear supernatant and a hard-compact pellet of denatured protein were obtained. The supernatant was immediately decanted into another tube and assayed immediately. Thereafter, the assay was run with the carrousel placed into the TDx apparatus along with TDx Cyclosporin Monoclonal Reagent Pack.
Principle of cyclosporin measurement using the TDx immunoassay
The TDx system uses FPIA technology which is based on competitive binding that allows the tracer fluorochrome-labeled antigen and patient antigen to compete for binding sites on the antibody molecules coated on the wells of the plastic microtitration plate. If a patient sample contains a low concentration of antigen, after the competitive binding reaction reaches steady-state, there will be a high concentration of plate-bound tracer and polarization will be high. Conversely, if the concentration of antigen in the sample being tested is high, after the competitive binding reaction reaches the steady-state, a low concentration of bound tracer will be evident and polarization will be low. The precise relationship between polarization and concentration of the unlabeled antigen in the sample is established by measuring the polarization values in the presence of competing antigen calibrators with known concentrations and extrapolating the resulting calibration curve.
MEASUREMENT OF CYCLOSPORIN SALIVARY CONCENTRATION
All patients were instructed to eat, drink, and clean their teeth as usual before saliva sampling. To measure the CsA levels in saliva, a method developed and patented under the name of MERI (Middle East Research Institute, Beirut, Lebanon) drug extraction solution, was used.[15,16,17] Two milliliters of saliva were collected from patients 2 h post CsA morning dose. Unstimulated saliva was collected by asking patients to accumulate their saliva over 4–5 min and spit it into glass vials. The saliva sample was then centrifuged for 10 min at 4000 rpm. The supernatant was discarded and the pellet was dissolved in 200 μl of MERI solution. Then, 150 μl of the saliva/MERI solution was added to 350 μl of lysine/precipitation reagent and centrifuged for 10 min at 10000 rpm. The CsA salivary concentration was determined as detailed above using the FPIA kit and the TDx apparatus.
STATISTICAL ANALYSIS
With 30 patients, the study will have a power of at least 80% to detect a correlation coefficient of at least 0.50 between the two outcomes (Salivary and Blood CsA) using the Pearson correlation coefficient and a significance level of 0.05.
Patients' gender was summarized using frequency distribution. Blood and Salivary CsA levels were summarized using means and standard deviation. These were compared between males and females using the Wilcoxon rank sum test (because the variables were not normally distributed). Pearson's correlation coefficient was computed to assess the linear association between blood and salivary CsA. All analyses were done using IBM-SPSS version 23 (IBM Corp, Armonk, NY, USA). A P value of.05 or less was considered significant.
RESULTS
Among the 33 recruited participants, 17 were females (52%) and 16 were males (48%). Blood CsA levels had a mean of 565.02 ± 259.07 μg/L, which was significantly higher (P < 0.001) than that of salivary CsA with a mean of 182.62 ± 224.11 μg/L. There was no significant difference in blood CsA or salivary CsA between males and females (P values were 0.985 and 0.478 respectively) [Table 1]. Moreover, there was no significant correlation between Blood CsA and salivary CsA (r = 0.066, P = 0.726), as illustrated in Figure 1.
Table 1.
Summary of the measurements and gender differences
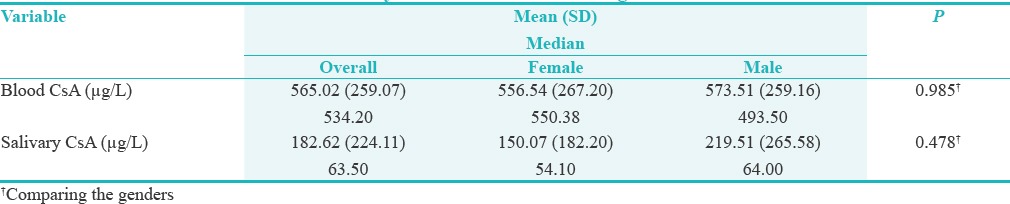
Figure 1.
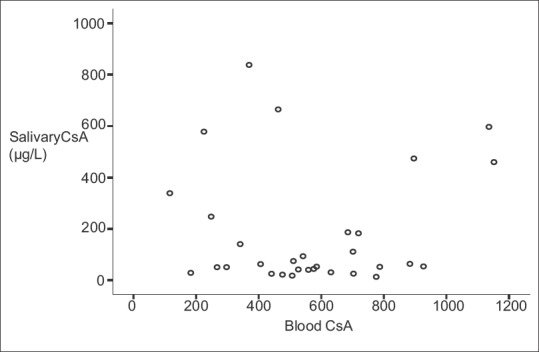
Whole blood CsA levels plotted against corresponding salivary CsA levels
DISCUSSION
The objective of this study was to investigate a potential correlation between salivary CsA concentration and whole blood therapeutic CsA level using the monoclonal FPIA technique.
Few previous studies that have attempted to correlate CsA salivary levels with CsA blood levels have been performed on either serum or saliva and have yielded conflicting results, with some authors reporting a significant correlation between serum and saliva levels,[9] while others failing to detect a correlation.[18] This could be explained by many factors including differences in the biological fluid of choice (whole blood, serum, or saliva), the treatment of the sample prior to measurements, and in measurement techniques.
Because CsA is insoluble, highly lipophilic, and readily present on most biological membranes, it is extensively distributed throughout body tissues and fluids.[19] However, CsA is more than 99% bound to blood cells and plasma lipids and proteins, leaving a very small portion of unbound drug.[20] The serum concentration, therefore, includes the fraction of the unbound drug and that of CsA bound to plasma soluble lipids/proteins. On the other hand, whole blood concentration includes, in addition to the two abovementioned fractions, the drug portion bound to blood cell membranes.
Among various CsA dosage techniques, high-performance liquid chromatography (HPLC) is currently considered as the reference method owing to its specific analysis of CsA without cross-reaction with metabolites. The technique, however, is not practical in clinical settings.[14,21,22] Alternatively, measurements of CsA level in the early polyclonal immunoassays, which are significanly easier, suffer from interference by metabolites present in unpredictable excess.[23] To resolve this, an effort was made to develop more specific and robust procedures for the measurements of CsA alone to give values similar to those obtained by HPLC. In particular, the Axsym monoclonal fluorescent polarization immunoassay (FPIA) technique (Abbott Laboratories) has been demonstrated to compare favorably with HPLC for the measurement of blood CsA concentration, and may be a more accurate method for the assessment of CsA salivary concentration.[14]
It is generally believed that the pharmacological action of a highly protein-bound drug, such as CsA, is related to the concentration of the unbound drug in plasma.[24,25] Determining CsA unbound concentration may, therefore, prove beneficial in the management of CsA therapy, however, neither CsA serum nor whole blood concentrations reflect the level of the unbound fraction of the drug in blood. The pharmacokinetic properties of CsA, timing after drug intake, interindividual patient variability (absorption and clearance),[26] and limitations of the available assay techniques render it practically impossible to measure the free fraction of CsA in blood. Because only the unbound portion of a CsA is believed capable of diffusing across the capillaries of salivary glands,[27] it is conceivable that the salivary concentration will better reflect the unbound and pharmacologically active fraction of the drug than serum or whole blood concentration.[9] It has, therefore, been speculated that saliva monitoring may be suitable for measuring the levels of neutral lipophilic compounds such as CsA. The availability of a saliva-based method is therefore essential to measure the salivary concentration of CsA and to explore its correlation with the total or unbound CsA concentration.[9] However, the few reported assays on saliva were performed in the late 80s and early 90s utilized the no longer commercially available polyclonal radioimmunoassay based on kits that are highly nonspecific because of extensive cross-reactivity with CsA metabolites.[9,18,28]
In an assessment of 36 kidney transplant recipients, the trough concentration of CsA in saliva was found to be 8.3 ± 5.2 μg/L using the radioimmunoassay method, which is much lower than the expected trough concentrations in whole blood.[9,28] In another study, to collect large volumes of saliva (±40 ml) participants were asked to chew on paraffin. This was not only impractical but also likely biased the results by releasing CsA molecules captured in the plaque reservoir.[18]
Adapting the monoclonal FPIA technique (TDx®/TDx FLx®, Abbott Laboratories) currently used for whole blood monitoring to saliva sampling may provide a more precise and specific method for the assessment of CsA salivary concentration;[21,29] however, also requires high volumes of saliva. To overcome the need for large amounts of saliva, Masri et al.(2006) proposed a new technical method developed and patented under the name of MERI drug extraction solution.[30] It is based on the use of MERI drug extraction to isolate CsA from saliva, and may further enhance the accuracy of CsA level measurements in saliva. The assay is sensitive to 2 ng/ml, and has an interassay coefficient of variance (CV) of 3.4% and intraassay CV of 6.7%.[30] It has improved reproducibility when compared with chromatography–tandem mass spectrometry (LC–MS/MS), which has been advocated as an ideal method for the measurement of drugs in saliva with an inter- and intrarun CV of 8.3–12.1% and 6.9–12.2%, respectively.[9]
In the present study, salivary and serum CsA concentrations were assessed 2 h after the morning dose (C2). CsA measures are often taken before the morning dose at the so-called trough (C0). While such single point measurement is useful for checking the compliance and the level of the immunosuppressive activity, it only reflects one aspect of the drug's pharmacokinetic profile. The AUC refers to an area under the plasma/serum concentration time curve and is a measure of the total concentration of a drug over a specific time period and is more accurate than C0. In the present study, AUC was not obtained as it is impractical and more expensive in large patient samples. Several authors have suggested a clinical benefit of CsA monitoring using the CsA at C2, which correlates better with AUC than C0 in different organ transplantation models.[2,18]
Our results showed no correlation between blood and salivary CsA concentrations (r = 0.066, P =0.725). In addition, no statistically significant differences were evidenced between the two genders relative to the correlation between blood and salivary CsA levels. These data are in agreement with the low correlations between CsA concentration in whole saliva with those in serum, parotid saliva, and submandibular saliva reported by McGaw et al.[18] Although the authors speculated that salivary CsA levels may have been biased due to chewing paraffin, our data based on the more accurate assessment of unstimulated saliva similarly suggests that salivary levels may not be an appropriate method of therapeutic monitoring of CsA.
Finally, our study conducted in a Lebanese population is not without limitations. Because of the limited number of patients, definite conclusions must be delayed until future research validates our findings.
CONCLUSION
According to the present study, it can be concluded that salivary CsA concentrations at C2 cannot be used instead of C2 blood levels as an indicator of CsA bioavailability despite the improved performance of the monoclonal FPIA and the application of the MERI technique for the assessment of salivary CsA concentrations. Novel studies are warranted to further elucidate the impact of CsA pharmacokinetics and design more reliable and less invasive procedures for therapeutic drug monitoring.
FINANCIAL SUPPORT AND SPONSORSHIP
Nil.
CONFLICTS OF INTEREST
There are no conflicts of interest.
ACKNOWLEDGMENT
A very special gratitude goes out to Professors Georges Aoun and Ziyad Mahfoud for their technical help during the write up of the study.
REFERENCES
- 1.Wada Y, Kotani T, Takeuchi T, Wakura R, Wakura D, Makino S, et al. Therapeutic drug monitoring of cyclosporine microemulsion in patients with corticosteroid-resistant systemic lupus erythematosus. Mod Rheumatol. 2015;25:708–13. doi: 10.3109/14397595.2015.1034401. [DOI] [PubMed] [Google Scholar]
- 2.Christians U, Vinks AA, Langman LJ, Clarke W, Wallemacq P, van Gelder T, et al. Impact of laboratory practices on interlaboratory variability in therapeutic drug monitoring of immunosuppressive drugs. Ther Drug Monit. 2015;37:718–24. doi: 10.1097/FTD.0000000000000205. [DOI] [PubMed] [Google Scholar]
- 3.Hosseini MS, Rostami Z, Einollahi B. Dyslipidemia after kidney transplantation and correlation with cyclosporine level. Nephrourol Mon. 2013;5:831–4. doi: 10.5812/numonthly.11890. [DOI] [PMC free article] [PubMed] [Google Scholar]
- 4.Stefoni S, Midtved K, Cole E, Thervet E, Cockfield S, Buchler M. Efficacy and safety outcomes among de novo renal transplant recipients managed by C2 monitoring of cyclosporine A microemulsion: Results of a 12-months, randomized, multicenter study. Transplantation. 2005;79:577–83. doi: 10.1097/01.tp.0000153158.91683.34. [DOI] [PubMed] [Google Scholar]
- 5.Rodríguez E, Delucchi MA, Cano F, Valdebenito S, Castillo MC, Villegas R. Comparison of cyclosporine concentrations 2 hours post-dose determined using 3 different methods and trough level in pediatric renal transplantation. Transplant Proc. 2005;37:3354–7. doi: 10.1016/j.transproceed.2005.10.004. [DOI] [PubMed] [Google Scholar]
- 6.Leichtle AB, Ceglarek U, Witzigmann H, Gäbel G, Thiery J, Fiedler GM. Potential of dried blood self-sampling for cyclosporine c(2) monitoring in transplant outpatients. J Transplant. 2010;2010:201918. doi: 10.1155/2010/201918. [DOI] [PMC free article] [PubMed] [Google Scholar]
- 7.Schubert S, Abdul-Khaliq H, Lehmkuhl HB, Hübler M, Abd El Rahman MY, Miera O, et al. Advantages of C2 monitoring to avoid acute rejection in pediatric heart transplant recipients. J Heart Lung Transplant. 2006;25:619–25. doi: 10.1016/j.healun.2006.02.002. [DOI] [PubMed] [Google Scholar]
- 8.Loichot C, Ferrer D, Bernard N, Bonardet A, Boulieu R. Cyclosporine monitoring in renal transplant recipients with induction therapy: C2 levels in patients monitored on C0. Fundam Clin Pharmacol. 2006;20:91–6. doi: 10.1111/j.1472-8206.2005.00383.x. [DOI] [PubMed] [Google Scholar]
- 9.Mendoza A, Gohh R, Akhlaghi F. Determination of cyclosporine in saliva using liquid chromatography-tandem mass spectrometry. Ther Drug Monit. 2004;26:569–75. doi: 10.1097/00007691-200410000-00016. [DOI] [PubMed] [Google Scholar]
- 10.Lima D, Diniz D, Moimaz S, Sumida D, Okamoto A. Saliva: Reflection of the body. Int J Infect Dis. 2010;14:e184–8. doi: 10.1016/j.ijid.2009.04.022. [DOI] [PubMed] [Google Scholar]
- 11.Soldin SJ, Hardy RW, Wians FH, Jr, Balko JA, Mendu DR, Chaffin CH, et al. Performance evaluation of the new ADVIA Centaur system cyclosporine assay (single-step extraction) Clin Chim Acta. 2010;411:806–11. doi: 10.1016/j.cca.2010.02.062. [DOI] [PubMed] [Google Scholar]
- 12.Masri M, Barbari A, Stephan A. Measurement of lymphocyte cyclosporine levels in transplant patients. Transplant Proc. 1998;30:3561–2. doi: 10.1016/s0041-1345(98)01437-7. [DOI] [PubMed] [Google Scholar]
- 13.Roberts NB, Dutton J, Higgins G, Allars L. Evaluation of a novel semi-automated HPLC procedure for whole blood cyclosporin A confirms equivalence to adjusted monoclonal values from Abbott TDx. Clin Chem Lab Med. 2005;43:228–36. doi: 10.1515/CCLM.2005.039. [DOI] [PubMed] [Google Scholar]
- 14.Jebabli N, Klouz A, Bahlous A, Gaïes E, Trabelsi S, Lakhal M, et al. Comparison of three methods for cyclosporine therapeutic monitoring. Transplant Proc. 2007;39:2557–9. doi: 10.1016/j.transproceed.2007.08.027. [DOI] [PubMed] [Google Scholar]
- 15.Barbari A, Masri M, Stephan A, Mourad N, El-Ghoul B, Kamel G, et al. Cyclosporine lymphocyte maximum level: A new alternative for cyclosporine monitoring in kidney transplantation. Exp Clin Transplant. 2005;1:293–300. [PubMed] [Google Scholar]
- 16.Masri M, Rizk S, Barbari A, Stephan A, Kamel G, Rost M. An assay for the determination of sirolimus levels in the lymphocyte of transplant patients. Transplant Proc. 2007;39:1204–6. doi: 10.1016/j.transproceed.2007.04.008. [DOI] [PubMed] [Google Scholar]
- 17.Barbari A, Masri M, Stephan A, Rizk S, Younan S. A novel approach in clinical immunosuppression monitoring: Drug lymphocyte level. Exp Clin Transplant. 2007;2:643–8. [PubMed] [Google Scholar]
- 18.McGaw T, Lam S, Coates J. Cyclosporin-induced overgrowth: Correlation with dental plaque scores, gingivitis scores and cyclosporin levels in serum and saliva. Oral Surg Oral Med Oral Pathol. 1987;64:293–7. doi: 10.1016/0030-4220(87)90007-7. [DOI] [PubMed] [Google Scholar]
- 19.Modéer T, Wondimu B, Larsson E, Jozson B. Levels of cyclosporin-A (CsA) in saliva in children after oral administration of the drug in mixture or in capsule form. Scand J Dent Res. 1992;100:366–70. doi: 10.1111/j.1600-0722.1992.tb01088.x. [DOI] [PubMed] [Google Scholar]
- 20.Akhlaghi F, Trull AK. Distribution of cyclosporine in organ transplant recipients. Clin Pharmacokinet. 2002;41:615–37. doi: 10.2165/00003088-200241090-00001. [DOI] [PubMed] [Google Scholar]
- 21.Keevil BG, Tierney DP, Cooper DP. Rapid liquid chromatography-tandem mass spectrometry method for routine analysis of cyclosporine A over an extended concentration range. Clin Chem. 2002;48:69–76. [PubMed] [Google Scholar]
- 22.Büyüktuncel E, Yücel Ç, Kaynak MS, Aktaş Y. Development of a HPLC method for the determination of Cyclosporine A from chitosan nanoparticles. Latin Am J Pharm. 2012;31:1083–8. [Google Scholar]
- 23.Lipman NS, Jackson LR, Trudel LJ, Garcia FW. Monoclonal versus polyclonal antibodies: Distinguishing characteristics, applications, and information resources. ILAR J. 2005;46:258–68. doi: 10.1093/ilar.46.3.258. [DOI] [PubMed] [Google Scholar]
- 24.Gurecki J, Warty V, Sanghvi A. The transport of cyclosporine in association with plasma lipoproteins in heart and liver transplant patients. Transplant Proc. 1985;17:1997–2002. [PubMed] [Google Scholar]
- 25.Langman LJ. The use of oral fluid for therapeutic drug management. Ann N Y Acad Sci. 2007;1098:145–66. doi: 10.1196/annals.1384.001. [DOI] [PubMed] [Google Scholar]
- 26.Semra YigitaslanA–F, Kevser Erol C, F , Cigdem Cengelli B. The effect of Pglycoprotein inhibition and activation on the Absorption and serum levels of cyclosporine and tacrolimus in rats. Adv Clin Exp Med. 2016;25:237–42. doi: 10.17219/acem/35254. [DOI] [PubMed] [Google Scholar]
- 27.Jusko WJ, Milsap RL. Pharmacokinetic principles of drug distribution in saliva. Annals of the New York Academy of Sciences. 1993;694:36–47. doi: 10.1111/j.1749-6632.1993.tb18340.x. [DOI] [PubMed] [Google Scholar]
- 28.Coates JE, Lam SF, Mc Gaw WT. Radioimmunoassay of salivary cyclosporine with use of 125I–labeled cyclosporine. Clin Chem. 1988;34:1545–51. [PubMed] [Google Scholar]
- 29.Rodríguez E, Delucchi MA, Cano F, Valdebenito S, Castillo MC, Villegas R. Comparison of cyclosporine concentrations 2 hours post-dose determined using 3 different methods and trough level in pediatric renal transplantation. Transplant Proc. 2005;37:3354–7. doi: 10.1016/j.transproceed.2005.10.004. [DOI] [PubMed] [Google Scholar]
- 30.Masri M, Rizk S, Aboujaoude S, Rost M. A novel assay for the determination of the levels of cyclosporine (CYA) in the saliva, dental plaque and the gum biopsy using a patent drug extraction. Exp Clin Transplant. 2006;4:551–2. [Google Scholar]