

Abstract
Alzheimer’s disease (AD) is a progressive neurological disorder that affects more than 30 million people worldwide. While various dementia-related losses in cognitive functioning are its hallmark clinical symptoms, ultimate diagnosis is based on manual neuropathological assessments using various schemas, including Braak staging, CERAD (Consortium to Establish a Registry for Alzheimer’s Disease) and Thal phase scoring. Since these scoring systems are based on subjective assessment, there is inevitably some degree of variation between readers, which could affect ultimate neuropathology diagnosis. Here, we report a pilot study investigating the applicability of computer-driven image analysis for characterizing neuropathological features, as well as its potential to supplement or even replace manually derived ratings commonly performed in medical settings. In this work, we quantitatively measured amyloid beta (Aβ) plaque in various brain regions from 34 patients using a robust digital quantification algorithm. We next verified these digitally derived measures to the manually derived pathology ratings using correlation and ordinal logistic regression methods, while also investigating the association with other AD-related neuropathology scoring schema commonly used at autopsy, such as Braak and CERAD. In addition to successfully verifying our digital measurements of Aβ plaques with respective categorical measurements, we found significant correlations with most AD-related scoring schemas. Our results demonstrate the potential for digital analysis to be adapted to more complex staining procedures commonly used in neuropathological diagnosis. As the efficiency of scanning and digital analysis of histology images increases, we believe that the basis of our semi-automatic approach may better standardize quantification of neuropathological changes and AD diagnosis, ultimately leading to a more comprehensive understanding of neurological disorders and more efficient patient care.
Keywords: Alzheimer’s disease, Braak, CERAD, digital analysis, neuropathology
INTRODUCTION
Alzheimer’s disease (AD) is characterized neuropathologically by the presence of neurofibrillary tangles created by abnormal phosphorylated tau protein accumulations organized as paired helical filaments and by “senile”, or neuritic plaques composed of extracellular deposits of beta-amyloid protein surrounded by abnormal neuronal processes.1,2 Three major pathological schemas are currently employed for the assessment of AD pathology. Braak staging focuses on regional neurofibrillary pathology,3 whereas CERAD (Consortium to Establish a Registry for Alzheimer’s Disease) scores measure neuritic plaque load for the diagnosis of AD,4 and finally, Thal phase scores measure the presence and distribution of amyloid beta (Aβ) deposits.5 In recent years, these three scoring systems have been combined to produce an “ABC” (Amyloid, Braak, CERAD) composite score describing the total level of AD neuropathological changes.6,7
Histopathological scoring systems are semi-quantitative and, by definition, are dependent on the interpretation of findings by neuropathologists, inevitably leading to some level of inter-rater variability.8 Even if this inter-rater variation has been considered acceptable for some aspects of scoring plaques and tangles, the variability among observers increases significantly for older patients and for samples on the lower end of the rating scale.9 Recent studies have also suggested that current manual neuropathological standards such as Braak and CERAD are limited in their ability to accurately characterize a wide enough spectrum of dementia-related pathology.10 Moreover, in measuring the concordance between neuropathological scores and ultimate clinical diagnoses using neuropathological scores as the gold standard, Beach and colleagues calculated sensitivity ranges for AD diagnosis between 70.9% and 87.3% and specificity only between 44.3% and 70.8%,11 highlighting a discrepancy possibly caused by a lack of a complete and accurate neuropathological assessment. Consistency in diagnosis depends on reducing inter-laboratory and inter-rater variability, particularly since the diagnosis of AD depends on quantitative measures of pathology. Thus, a more consistent digitalized quantitative approach has been suggested to improve standardization of scoring, especially for characterizing neuropathology of mixed-disease cases where a wide variety of factors are present (e.g., identifying phenotypic differences between classical AD and AD with neocortical Lewy body dementia).12
In this work, we investigated the potential of computer-driven image analysis to supplement, or, in some cases, even replace the current manual characterization of neuropathological changes in AD. A previous study demonstrated the ability to generate plaque counts in AD using several available algorithms,13 and we chose to extend these findings to standard neuropathology routines used in diagnosis. Briefly, we prepared a robust pixel count-based algorithm to specifically identify Aβ plaques, irrespective of patient diagnosis or staining differences, which could be easily reproduced for a large number of tissue samples. Our analysis of the resulting computer-generated data showed a tight correlation to manually derived neuropathological scores. Once validated, our results could justify the incorporation of digital quantification in the day-to-day neuropathological assessment to aid in better quantification of neuropathological change and standardization of AD diagnosis. Indeed, digital slide analysis has already been extended to the clinic in other fields14 and we envision this successful expansion into the AD field as well.
MATERIALS AND METHODS
Case material
Thirty-four autopsy cases were included in our study (Table 1). All autopsies were obtained with consent of next of kin at the time of death, as per Georgia state law (USA). Since our study was concerned primarily with digital-manual correlation rather than clinical prediction, cases were chosen to reflect a wide range of Aβ deposition and a variety of diagnoses were included: the 34 cases stemmed from 10 patients with AD, 22 with ALS, one with progressive supranuclear palsy (PSP), and one with dementia with Lewy bodies (DLB). Cases were nearly evenly split between males and females (n = 19 and 15, respectively) and the average age at death was just over 67years (range: 34–94).
Table 1.
Clinical and demographic summary statistics of the 34 cases used in this study. Duration of disease refers to time between initial diagnosis and death
| Clinical variable | Description |
|---|---|
| Clinical diagnosis | AD (n = 10), ALS (n = 22), other dementia (n = 2) |
| Age at onset, mean (SD) | 60.56 (13.32) |
| Age at death, mean (SD) | 67.38 (13.00) |
| Duration of disease, mean (SD) | 6.125 (4.60) |
| Gender | 15 female / 19 male |
| Race | 5 black / 27 white / 2 other |
Autopsy tissue
Brains collected at autopsy were processed by the Emory University Alzheimer’s Disease Center Neuropathology Core. Briefly, paraformaldehyde-fixed (8% paraformaldehyde, 4°C, 1–2 weeks) tissue blocks taken from multiple brain regions were embedded in paraffin, cut at 8 microns, and stained with HE and Bielschowsky silver stains. Additional sections were immunolabeled with antibodies to Aβ (4G8, BioLegend, Dedham, MA, USA), tau (Accurate, Westbury, NY, USA), alpha-synuclein (Covance, Emeryville, CA, USA) and trans-activation response DAN protein 43 (TDP-43: Cosmo Bio Co. Ltd., Tokyo, Japan). Aβ antibody was diluted to 1:5000 by volume and sections were pretreated in 90% formic acid at room temperature for 10 min. Di-aminobenzidine (DAB) as brown color was used for immunohisotchemical (IHC) development. Aqueous hematoxylin (GeneTex, Irvine, CA, USA) was used as counterstain. Briefly, after DAB treatment, hematoxylin was diluted in dH2O (2 parts hematoxylin: 1 part dH2O) and incubated for 30sec. Next, treated tissue was rinsed once in dH2O, twice in Tris-Brij and then once in dH2O. Stained sections were evaluated for neuritic plaques, neurofibrillary tangles, amyloid deposition and other neurodegenerative pathology, and AD pathology was assessed according to National Institute on Aging – Alzheimer’s Association (NIA-AA) criteria.6
Manual pathology assessment
Braak stages were assessed on Bielschowsky silver stained and tau immunolabeled slides (MG, JG).3 Briefly, the Braak score is based on the distribution of neurofibrillary tangles (NFTs) in different specified cortical regions. Braak stages I/II indicate NFTs are primarily localized to the entorhinal cortex, in stages III/IV they have spread to other limbic areas (e.g., the hippocampus and amygdala) and slightly into association cortex, and in stages V/VI, NFTs are widely distributed in primary motor and sensory areas of the neocortex. For this analysis, these six stages were also condensed into four categories (0 = First, I/II = Second, III/IV = Third and V/VI = Fourth) based on the work of Nagy et al.15
CERAD scores were generated based on Bielschowsky silver stained tissue sections according to standard practice.4 Briefly, neuritic plaques (i.e, plaques with thickened silver-positive neurites) on each neocortical section were scored as none, sparse, moderate or frequent based on a semi-quantitative assessment in the area of highest density. Each patient was assigned a final CERAD score based on the most severe neuritic plaque score among the frontal, temporal and parietal cortices. In 31/34 cases the most severe plaque score among these regions was also the most common score among these regions.
Thal scores describe the location of “sharp delineated” amyloid beta plaques using Aβ immunolabeled sections.5 Five phases are assigned based on the local differences in the occurrence of Aβ deposits. Briefly, plaques are localized to the frontal, parietal, temporal or occipital neocortex in phase 1, and additionally in the entorhinal region, CA1, and insular cortex in phase 2. In phase 3, Aβ is also present in various subcortical regions such as caudate nucleus, putamen, claustrum, thalamus, hypothalamus and white matter. Additional Aβ deposits in regions such as the inferior olivary nucleus, substantia nigra and red nucleus characterize phase 4, and lastly, phase 5 is characterized by deposits in more brainstem regions such as the reticulo-tegmental nucleus of the pons and the cerebellum.
Finally, the ABC score describing the severity of neuropathologic changes for each patient was calculated from the combination of Braak, CERAD and Thal scores using the rubric outlined in the work of Hyman et al.6,7
Image markup
Images from tissue sections were digitized using a Hamamatsu NanoZoomer 2.0-HT at 40× magnification with standard white light imaging parameters. Slide sets for 34 patients stained for Aβ protein were analyzed (see Supplementary Table 1). Ten brain regions were analyzed: eight cortical regions (frontal, temporal, parietal, occipital, cingulate, insular, parahippocampal and entorhinal) as well as two additional regions commonly assessed in standard neuropathological analysis (amygdala and cerebellum).
Markup of the digital images derived from the 34 patients and 10 brain areas was conducted by WD, blinded to patient diagnosis. Using Aperio ImageScope (version 12.1.0.5029: Leica Biosystems Inc.; Buffalo Grove, IL, USA) software, grey matter regions were manually delineated from surrounding tissue using the annotation tool based on visual inspection of gross observable differences in grey and white matter, by inspection of cellular density differences, as well as by using a brain atlas and information on how that particular tissue was cut from the brain. Obvious artifacts including regions of air bubbles, significant tissue folding and/or other debris were excluded from the resulting region of interest (ROI) (Fig. 1). A trained expert in neuropathology with significant neurodegenerative disease expertise (MG or JG) verified that annotations were correctly marked.
Fig. 1.
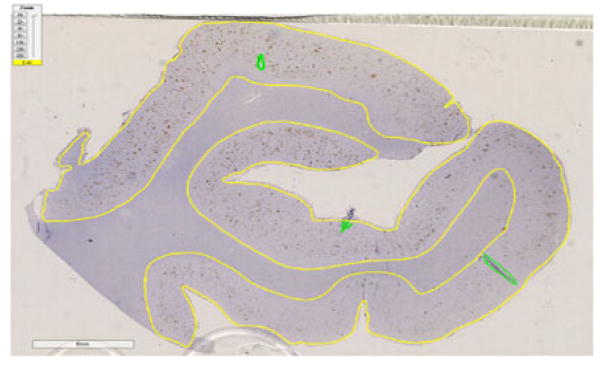
Region of temporal cortex for Pt_29, a 74-year-old male ALS patient, stained for Aβ protein. The yellow line delineates the cortex region where the image analysis algorithm will be performed. Irregular areas and slide artifacts (dirt, air bubbles, debris) are indicated in green and are excluded from the analysis.
Quantitative image analysis of amyloid plaque burden
Scanned images were analyzed using Aperio ImageScope, a commercial analysis package that features a variety of algorithms for detailed analysis of features such as stain intensity, pixel count and cellular morphology.
We used the Positive Pixel Count v9 algorithm with standard parameters for brown color quantification (Supplemental Table 2). This algorithm is designed to quantify the amount of a specific stain in a scanned slide image by segmenting each pixel within the outlined region into three intensity ranges, one for each color channel, specified by the user’s parameters. The algorithm uses these parameters to classify each pixel into background (blue), weak positive (yellow), medium positive (orange) and strong positive (red) intensities (Fig. 2). We chose to perform this initial analysis using only Aβ stained slides. This decision was based on the clinical and pathological relevance of Aβ in AD diagnosis, and also because the high contrast between stain and background made these images highly amenable to digital quantification.
Fig. 2.
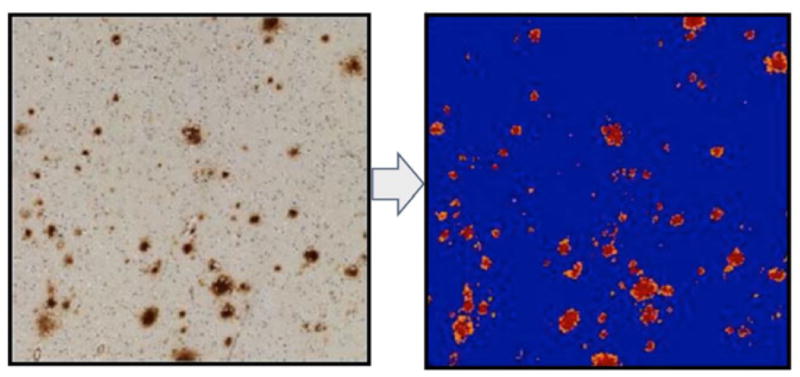
Visualization of Positive Pixel Count v1 set for the brown color quantification image analysis algorithm used in our study. Pixels are divided into three intensities: strong (red), medium (orange) and weak (yellow). Pixels not attaining minimum threshold for staining are omitted (blue).
Validation of digital measurements with manually derived plaque burden scores
In order to compare our measurements with standard manual neuropathological assessments, we investigated how our metric, Aβ plaque quantification, correlated to assigned manual scores of plaque intensities for each of the 10 brain regions analyzed.
The assigned manual scores of plaque intensities were generated using the combination of Bielschowsky and Aβ stains to identify both neuritic and diffuse plaques. Neuritic and diffuse plaques were each rated as none, sparse/mild, moderate or frequent/severe for each brain region using CERAD semi-quantitative rating scales. The highest score for either plaque type was recorded as the “manual” plaque score for that region. Since both neuritic and diffuse plaques are composed of Aβ protein, we propose that using the most severe semi-quantitative score serves as a reasonable estimate for Aβ within a region.
To validate that our digital measurements reflected those of manual assessment, we investigated the correlation in Aβ stain to the four possible plaque scores for each brain region by using the Spearman method. Briefly, for each brain region, digitally derived Aβ stain measures were correlated against corresponding plaque scores converted to quantitative scores (none = 1, sparse/mild = 2, moderate= 3 or frequent/severe= 4) using a Spearman correlation test. In addition, to assess the trend between quantitative and manual scores, we performed an ordinal logistic regression between measured Aβ stain and neuropathological plaque score for each brain region. Ordinal logistic regression has the additional merit of avoiding arbitrary numerical scores assigned to the four severity grades, at the price of a more sophisticated statistical analysis. The proportional-odds assumption of our models was verified by visually inspecting that the empirical odds ratios between larger versus smaller pathology grades and predictor variables were relatively constant over the grade levels, in a number of cases checked, and thus considered valid to the extent possible given our data. For significance, we used the Wald Chi-square test to test the null hypotheses that all the fitted coefficients in the model are zero, that is the quantitative scores do not predict the trend.
Correlation and assessment of trend between quantitative Aβ and overall patient scores
Next, to explore the potential that digital analysis could have in everyday neuropathological analysis, we repeated the above analyses to investigate the association of our digitally quantified measurements of Aβ to the manual neuropathologist rating for each of several commonly used scoring schema: those dealing specifically with Aβ such as Thal, but also other more general scoring systems that do not rely solely on Aβ (CERAD, Braak and ABC). Importantly, these are “global” scores, assigned at the patient level, rather than on each specific brain region as in the previous analysis. This correlation was measured between each separate region and the global score as well as between all regions combined into an average and the global score. Significance of correlation between digital measurements of Aβ in each brain region to these overall scores was again measured by Spearman correlation tests and corrected for multiple testing using Bonferroni correction. In addition, another set of ordinal regression models were performed for each brain region as well as the average of Aβ stain across all brain regions to assess the trend between the digitally quantified Aβ measurements and manually derived global CERAD, Thal, Braak and ABC scores.
All statistical analyses were performed in MATLAB (R2014b).
RESULTS
Parameter tuning and visual exploration of staining results
Using the same set of parameters for the Positive Pixel Count v9 algorithm (Supplementary Table 2) across all patients, we found robust segmentation of Aβ staining relative to background, verified first by gross visual inspection and then more thoroughly by trained pathologists (MG, JG). The specific Aβ staining metric reported here is strong positive pixel percent (SPPP), which was calculated by dividing the total number of strong positive pixels by the total number of pixels in the entire region (Fig. 3). We chose this due to the fact that the strong positive pixels were shown to be the most robust measure of Aβ plaques in that they remained specific to measuring the Aβ plaques regardless of differences in background staining for specific patients or regions. Indeed, as demonstrated in Figure 3, weak (yellow) and/or medium (orange) positive pixels tend to be involved in background staining (these later stains will be used as negative controls for digital-manual correlation assessment below). Finally, a pan-patient visualization of SPPP distributions across the 10 regions analyzed demonstrated sufficient variability that could be leveraged to distinguish patients based on neuropathology scores (Figs 4,5).
Fig. 3.
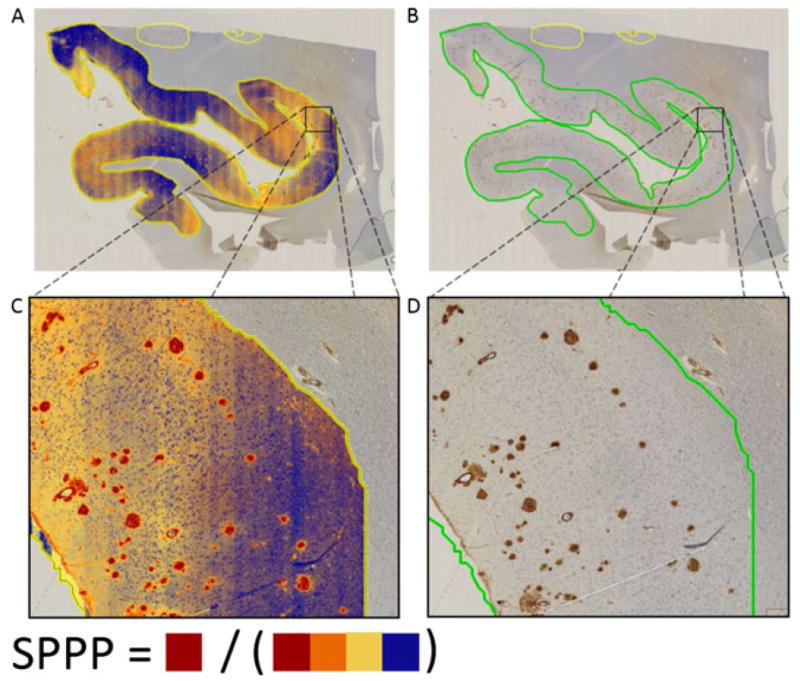
Occipital lobe region for Pt_4, an 83 year old white male showing staining analysis results (A/C) and corresponding images in original white light (B/D). For the cases analyzed, background staining was limited to weak positive (yellow) and medium positive (orange) pixels. In contrast, strong positive (red) pixels remain faithful to Aβ staining. In this work, we focus on the percentage of total area of strong positive pixels, which we refer to as strong positive percent (SPPP).
Fig. 4.
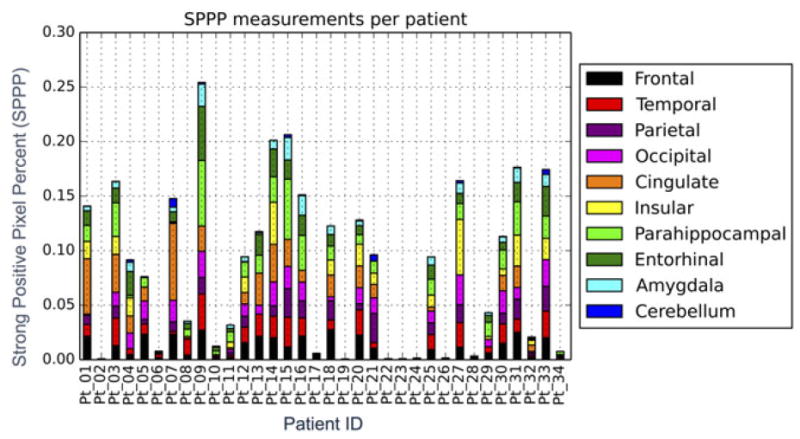
Strong positive percent (SPPP) as it differs among cases and between the 10 regions analyzed. The length of each bar represents the percentage of SPPP measured for the specific case in the specific region. Individual areas are shown as well to differentiate between cases.
Fig. 5.
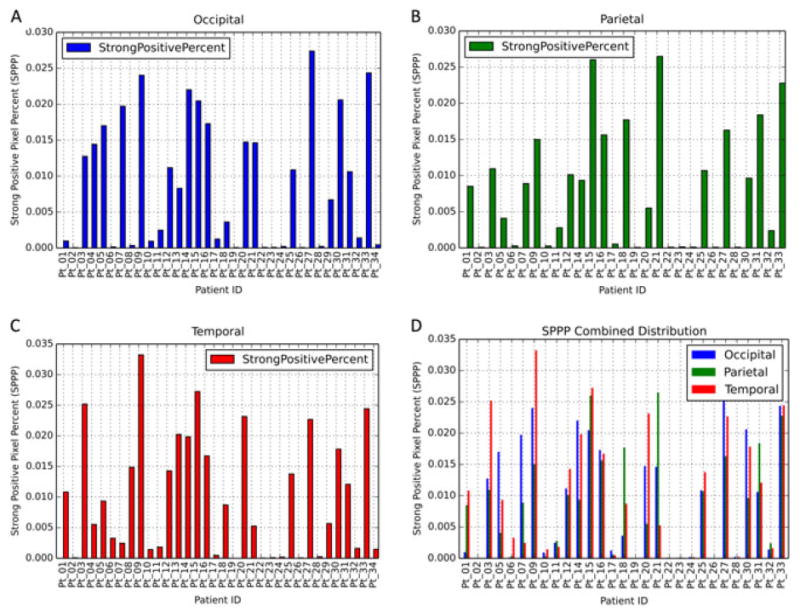
Strong positive percent (SPPP) as it differs between cerebral regions. The length of each bar represents the percentage of SPPP measured for the specific case. Individual areas are shown as well to differentiate between cases. Graph D represents graphs A, B and C grouped by case.
Validation of digital measurements with manually derived plaque burden scores
We next validated our automated digital measurements by comparing them with the “manual” plaque scores described above. Spearman correlation tests produced expected results. The strongest significant correlations were observed between SPPP and manual neuropathology plaque scores, while significant but weaker correlations were observed when medium positive pixel percent was analyzed and insignificant and weak correlations were observed when weak positive pixel percent was analyzed (Table 2). These results are in agreement with our earlier observations of abundant weak and medium positive pixels in random background staining not consistently targeting plaque regions. A visualization of our results demonstrating increasing SPPP as a function of manual plaque rating in parietal and temporal brain regions is available in Figure 6A,D.
Table 2.
Correlations between digital plaque quantification and manual neuropathology plaque scores for different brain regions (rows) using Spearman method. Correlation was measured by using strong positive pixel percent (SPPP), medium positive pixel percent and finally weak positive pixel percent as digital plaque quantification. In each cell, values represent Spearman correlation coefficient followed by associated P-value
| Brain Region | SPPP | Medium positive pixel percent | Weak positive pixel percent |
|---|---|---|---|
| Frontal | 0.658, 2.34E-05* | 4.63E-01, 5.83E-03* | 6.61E-02, 7.10E-01 |
| Temporal | 0.740, 5.57E-07* | 5.20E-01, 1.61E-03* | 2.48E-01, 1.58E-01 |
| Parietal | 0.849, 6.09E-09* | 5.46E-01, 2.17E-03* | 1.43E-01, 4.60E-01 |
| Occipital | 0.835, 8.06E-10* | 5.07E-01, 2.23E-03* | 8.84E-02, 6.19E-01 |
| Cingulate | 0.830, 7.83E-09* | 6.38E-01, 1.14E-04* | 3.61E-01, 4.60E-02* |
| Insular | 0.811, 8.85E-07* | 3.80E-01, 6.12E-02 | −8.74E-03, 9.67E-01 |
| Parahippocampal | 0.580, 3.20E-04* | 4.83E-01, 3.82E-03* | 2.49E-01, 1.56E-01 |
| Entorhinal | 0.777, 2.79E-07* | 5.56E-01, 1.17E-03* | 2.05E-01, 2.69E-01 |
| Amygdala | 0.781, 2.17E-07* | 5.52E-01, 1.30E-03* | 1.44E-01, 4.40E-01 |
| Cerebellum | 0.642, 7.44E-05* | 5.54E-01, 9.96E-04* | 2.25E-01, 2.15E-01 |
(P <0.05)
Fig. 6.
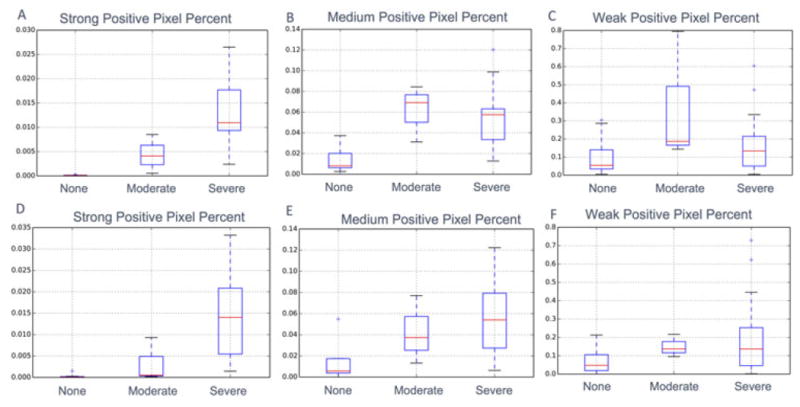
Visualization for differences in digitally quantified plaque measurements for different manually scored Aβ plaque intensities. (A–C) show these differences using the parietal lobe while (D–F) show these differences using the temporal lobe. For comparison, results using strong positive pixel percent (SPPP) (A, D), medium positive pixel percent (B, E) and weak positive pixel percent (C, F) are displayed.
In addition, significant P-values from ordinal logistic regression results demonstrate that increasing SPPP values lead to an increase in probability of a higher severity grade in the manual pathology assessment (Supplementary Table 3). These results demonstrate that conclusions based on Spearman correlation are robust (i.e, not sensitive to the assignment of numerical scores 1, 2, 3 and 4).
Correlation and assessment of trend between quantitative Aβ and overall patient scores
We next assessed the correlation between our automated quantification of Aβ versus the pathological scores obtained from the various global scoring schema commonly used in AD-related diagnoses. For each scoring system (CERAD, Braak, Thal, ABC), we measured how well Aβ was correlated to the various classes or stages within that system.
In particular, results from Spearman correlation tests confirmed moderate to strong significant correlations between digitally derived measures of SPPP and globally assigned CERAD, Braak, Thal and ABC scoring schemas for each brain region, even when corrected for multiple testing (Table 3). In addition, results from ordinal logistic regression indicate that SPPP from each brain region are significant predictors of the global CERAD, Braak and ABC scores assigned to each patient (Supplementary Table 4). As above, these results demonstrate that conclusions based on Spearman correlation are robust.
Table 3.
Correlations between digital plaque quantification using strong positive percent (SPPP) and manual ratings for various brain regions (rows) and various scoring schema (columns) using Spearman method. Average across all regions refers to the average SPPP across all brain regions for the specific case. In each cell, values represent the Spearman correlation coefficient followed by associated P-value.
| Brain region | CERAD | Braak6 | Braak4 | Thal | ABC |
|---|---|---|---|---|---|
| Frontal | 0.769, 1.10E-07* | 0.637, 5.10E-05* | 0.571, 4.24E-04* | 0.800, 1.42E-08* | 0.621, 8.86E-05* |
| Temporal | 0.718, 1.74E-06* | 0.587, 2.66E-04* | 0.536, 1.09E-03* | 0.781, 5.15E-08* | 0.613, 1.15E-04* |
| Parietal | 0.864, 1.62E-09* | 0.740, 4.42E-06* | 0.698, 2.58E-05* | 0.794, 2.72E-07* | 0.714, 1.34E-05* |
| Occipital | 0.799, 1.46E-08* | 0.702, 3.70E-06* | 0.651, 3.10E-05* | 0.857, 9.87E-11* | 0.680, 9.74E-06* |
| Cingulate | 0.851, 1.28E-09* | 0.726, 3.78E-06* | 0.682, 2.37E-05* | 0.823, 1.28E-08* | 0.740, 1.96E-06* |
| Insular | 0.823, 4.28E-07* | 0.669, 2.56E-04* | 0.607, 1.30E-03* | 0.845, 1.04E-07* | 0.665, 2.91E-04* |
| Parahippocampal | 0.772, 8.92E-08* | 0.701, 3.88E-06* | 0.642, 4.31E-05* | 0.729, 9.92E-07* | 0.688, 7.03E-06* |
| Entorhinal | 0.851, 1.29E-09* | 0.716, 5.90E-06* | 0.645, 9.10E-05* | 0.777, 2.73E-07* | 0.690, 1.77E-05* |
| Amygdala | 0.836, 4.76E-09* | 0.722, 4.53E-06* | 0.673, 3.31E-05* | 0.785, 1.71E-07* | 0.713, 6.62E-06* |
| Cerebellum | 0.548, 1.17E-03* | 0.560, 8.63E-04* | 0.605, 2.42E-04* | 0.669, 2.87E-05* | 0.579, 5.17E-04* |
| Average across all regions | 0.858, 9.28E-11* | 0.743, 4.92E-07* | 0.700, 3.98E-06* | 0.834, 9.37E-10* | 0.745, 4.34E-07* |
Significant (P <0.05) values corrected for multiple testing using Bonferroni correction to 0.01 are indicated with asterisk
As visualizations of our results, Figure 7 demonstrates the association of SPPP in the occipital cortex and increasing CERAD score (Fig. 7A) as well as SPPP in the parietal cortex and increasing ABC score (Fig. 7B). As indicated above, we also measured how an aggregate average measure of Aβ density across all measured regions for each patient was correlated with the various manual scores. Interestingly, this simple metric was still strongly correlated with overall CERAD (P = 9.28E-11), Braak using both six and four stages (P = 4.92E-07, P = 3.98E-06, respectively), Thal (P = 9.37E-10) and ABC (P = 4.34E-07) scoring stages (Fig. 8).
Fig. 7.
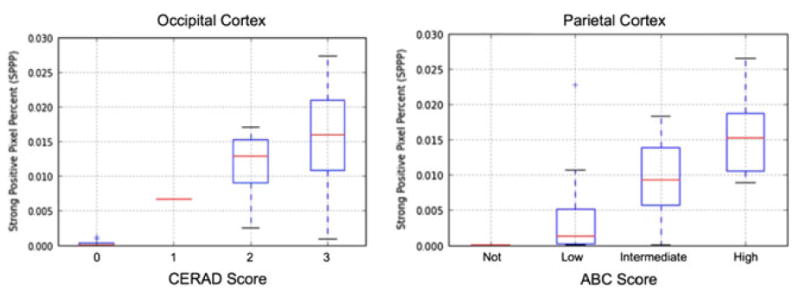
Visualization of strong positive pixel percent (SPPP) differentiated based on CERAD (Consortium to Establish a Registry for Alzheimer’s Disease) scores using only occipital regions (left) and ABC (Amyloid, Braak, CERAD) composite score using only parietal cortex regions (right). Respective analyses of variance P-values are 1.39E-05 and 1.46E-03. Respective Spearman coefficients are 0.799 (P = 1.46E-08) and 0.714 (P = 1.34E-05).
Fig. 8.
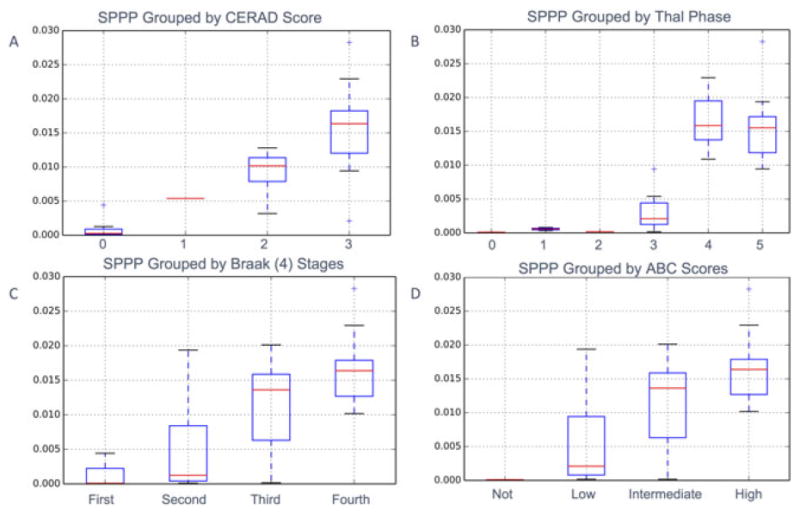
Difference in Aβ measurements between grades for four different scoring criteria using quantitative Aβ measurements (SPPP) combined across all brain regions for each case. Associated one-way analysis of variance results demonstrate that SPPP successfully distinguishes between CERAD (Consortium to Establish a Registry for Alzheimer’s Disease) (P = 2.80E-08), Braak scoring (P = 8.21E-03 and P = 1.23E-04 for both six and four stages respectively), Thal (P = 1.35E-8), and aggregate ABC (Amyloid, Braak, CERAD) scoring stage (P = 5.47E-5). Associated Spearman coefficients are also significant for CERAD (0.858, P = 9.28E-11), Braak using both six (0.743, P = 4.92E-07) and four (0.700, P = 3.98E-06) stages, Thal (0.834, P = 9.37E-10) and ABC (0.745, P = 4.34E-07) scoring stages.
DISCUSSION
Summary of results and immediate implications
Our results demonstrate that digitally derived data from immunostained histology slides strongly correlates with manually derived scores measuring corresponding features as well as a variety of overall manually derived “global” neuropathological scores. Specifically, we found the measurement of SPPP alone to be significantly correlated to stages of manually rated plaque scores as well as grades of CERAD, Braak and even aggregate ABC scores. Moreover, using ordinal logistic regression, we were able to show that our digital Aβ measurements could be significant predictors of manual neuropathology ratings, again not only in ratings describing corresponding Aβ intensity, but also in overall CERAD, Braak and ABC scores. This strong association between our digitally derived measures of SPPP and Braak, CERAD or ABC scores directly demonstrates the potential of digital assessment of tissue to supplement manual scoring in neuropathological analysis.
Importantly, in relation to Thal scoring, our results demonstrate that digital assessment of Aβ could even replace manual scoring. Since Thal scores are based simply on distribution of Aβ, and since digital analysis demonstrates high sensitivity for identifying amyloid deposits, we suggest that a future release of this algorithm could be programmed to automatically scan various brain regions to detect amyloid deposits above a predetermined threshold. This could potentially save significant time for a neuropathologist from having to scan roughly a dozen slides in their entirety to look for the occasional amyloid deposit.
Importance of algorithm robustness for implementation of digital neuropathological assessment
Given the diversity of neuropathological cases and the fact that autopsy cases are assessed over many years rather than all at once, it is important to minimize section-to-section variability in staining intensity and increase reproducibility through using consistent dilutions, incubation times, and positive and negative controls. Nonetheless, it is difficult to completely standardize all factors influencing stain quantification. Thus, as a requirement for the successful implementation of digital analysis in the neuropathological setting, it is necessary that digital measurements be robust enough to withstand common technically related variations. Our results show that it is possible to overcome this variability and measure exclusively the stain of interest by focusing on a specific range of pixel intensity. As a testament to the robustness of SPPP for example, after initial parameter tuning on a small set of exemplar images was performed, identical parameters were used for all subsequent analyses and were not tuned based on the specific characteristics of individual slides. Indeed, a detailed visual inspection of the slides analyzed in our study showed that given the parameters chosen, the SPPP metric was consistently enriched only in the regions of actual plaque deposition for all of our patients (such as Fig. 3). In contrast, other metrics such as medium positive pixel percent and especially weak positive pixel percent did depend on section-to-section immunostain light/dark variability. Apart from demonstrating the robustness of our SPPP measurement across patients, we believe this to be an important side discovery as this minimal tuning of detection algorithms required by the user will likely facilitate its acceptance as a useful tool in a standard neuropathological diagnosis setting.
It is important that other technical factors that could influence staining results in a neuropathological setting be controlled for and considered as well. For instance, one factor that varied among patients was the post mortem interval (PMI). While PMI has been shown to influence events such as pH and oxidative damage at the molecular level, its effect on gross structural changes at the tissue level, such as those measured with IHC in our experiment, has not been shown to be significant.16 In addition, it has been reported that routine post mortem intervals of at least 48 h, for most purposes, are acceptable and often have no demonstrable effect on the abundance or integrity of the parameter being studied.17 In our study, all PMIs were below 48h with an average of 13.8 h. We also verified the independence between PMI and staining results in our study through Pearson correlation: tests between PMI and SPPP in each brain region found no significant (P <0.05) correlations (data not shown). Another potential source of variability that could have affected Aβ plaque identification between institutions and even raters at the same institution is fixation technique. For example, while we are not aware of any systematic relation in how fixation may affect quantification of Aβ specifically, long-term (years) formalin fixation decreases staining. Fortunately for reasonable intervals, stain detection is likely to be unaffected. Indeed, studies have shown that fixation times up to 7 weeks in formalin lead to minimal effects in antigen detection.18 In addition, conditions can be optimized to allow adequate detection of neurodegenerative disease markers such as amyloid-beta and ubiquitin after more than a decade of fixation.19 Fortunately, in our study investigating Aβ, all of our fixation times were between 1 and 2 weeks; thus staining was unlikely to have been compromised.
Limitations
Because the purpose of our current work was to explore the potential of our algorithm for neuropathological diagnoses, we did not find it necessary to include a quantitative molecular gold standard to compare our Aβ measurements. Indeed, this would be especially difficult due to our institution procedures – while the semi-quantitation and Aβ were done on sections cut from the same tissue block, a biological measurement of Aβ, such as via ELISA, would necessarily involve two different pieces of tissue, likely from two different hemispheres, rendering faithful comparison difficult.
Moreover, while still leading to robust results in our current work, we used the prevailing practice of expressing Aβ staining as a percentage of the delimited area of the cortex for each brain region investigated, a method which may ignore pathologically significant differences in staining density across the selected area. As such, future work will more thoroughly examine these differences by, for example, systematically dividing our delimited area into smaller regions to find a representative Aβ density for that slide or by measuring average pixel intensity within an above-threshold region that is still able to correct for experimental variation in staining between or within cases.
Finally, while our results are encouraging, it is important to emphasize that despite these technological advancements and resulting benefits, the neuropathologist will likely always play the ultimate role in the clinic. Indeed, neuropathology is rarely straightforward – there are frequent comorbidities, rare cases and surprises that even the most advanced technology will not conquer.
Future directions
Importantly, our work serves as a proof of principle that digital assessment has the potential to supplement and even replace standard manual neuropathological scoring for a wide variety of features. Since we have shown that our measurements are robust and accurate with the specific example of analyzing Aβ plaque burden and that they compare favorably to expert assessment, we now have a more solid base to extend digital assessment of neuropathology slides to monitor a wide range of changes. In fact, we are currently planning on developing algorithms to identify more complicated features, such as neurofibrillary tangles based on morphology, which could potentially allow us to derive Braak scores. In addition, by distinguishing neuritic from diffuse plaques, one could envision applying this method to reproduce CERAD scores as well. As discussed above in the context of Thal scores, the assessment could even be more valuable, if it is able to distinguish between plaques and vascular amyloid, as it could standardize the assessment of vascular amyloid, which is not a typical procedure at the time of this publication.
Furthermore, studies have reported an important dearth of information on the interaction of different biomarkers, especially in cases where biomarkers will seem to conflict with each other (i.e, positive AB, negative neuronal injury) that a combined investigative approach could help elucidate.20 For example, image analysis algorithms in development can measure hundreds of features on a single slide, ranging from simple pixel clustering and counting to complex descriptions of tissue, including nuclear morphology and characterization of complex multicellular structures and tissue interfaces, each offering valuable information to a neuropathologist.21 As such, future directions will involve expanding this measurement from using only Aβ to take advantage of the possibility to measure a whole wealth of features to better characterize the pathological characteristics associated with prognosis and development. For example, because the brain slices used for each proteinopathy staining are cut from the same block at 8 microns, the manual mark up delimitation step discussed in the methods would only need to be conducted one time, facilitating implementation by reducing required time on the user end. In addition, efficiency could be increased even further by changing protocols to include a slide used for multi-color fluorescent staining where a wide variety of stains such as HE, Tau, α-synuclein, ubiquitin and TDP-43 could all be visualized at once. However, this option is somewhat limited due to experimental constraints – for example, some antibodies require pretreatments that are not compatible with other antibodies.
Lastly, recent improvements in imaging technology have made it possible to scan and digitally analyze hundreds of gigabytes of data in hours with minimal user intervention. The wealth of information available in these whole slide images (WSI) has motivated a range of software tools such as GENIE (Aperio, Vista, CA, USA), HALO (Indica Labs, Corrales, NM, USA), AQUA Analysis (HistoRx, Branford, CT, USA) and Visiopharm (Hoersholm, Denmark) to facilitate in day-to-day clinical and research activities.22 By being able to efficiently measure digital features on a large number of slides, the basis of our method thus offers the possibility to explore high-level correlations between features not normally associated with one another (i.e, CERAD neuritic plaques with Aβ), possibly leading to a more comprehensive insight into neuropathological developmental characteristics.
Toward implementation of digital analysis in neuropathology
We believe that our findings shed light on the benefits of digital analysis in neuropathology and open the door toward digital implementation in the clinic. Despite the fact that our method is not entirely automated (ROIs must still be drawn by the user) or that the initial cost of digital implementation in terms of personnel or resources is oftentimes prohibitively high, there are many factors which suggest that these costs would be outweighed by benefits resulting from successful implementation.
For example, the increased reproducibility obtained through the digital measurement of pathological characteristics both visible and not visible to the naked eye offers a wide range of benefits to the research and clinical care of dementia patients. Accurate neuropathological characterization is critical in facilitating our understanding of disease progression, as well as research in fields ranging from epidemiological to economic impact studies and even treatment and prevention trials.11 In addition, a robust neuropathological quantification system would be useful in studies correlating the frequency and location of dementia-related neuropathological features to a number of clinical features and genotypes.23–27
Apart from research promises, WSI analysis offers the potential to directly benefit clinical applications. For example, WSI used in surgical pathology has been shown to lead to several benefits such as to support off-site frozen section interpretation, primary diagnosis in telepathology consultations, improved service to underserved areas, educational activities and laboratory quality assurance.28 This has in turn led to commercial motivations: due to digital WSI analysis benefits and advantages in a range of diseases, the United States Food and Drug Administration (FDA) has approved its use for the commercial diagnostic evaluation/screening of HER2, PR, ER, Ki67 and/or p53 immunolabeling, suggesting its eventual standardized use in clinical care.29
However, it is likely that the greatest strength and most valuable driving factor for the implementation of digital analysis in neuropathological settings will stem from its standardization potential. For example, while manual ratings may be influenced by a variety of factors such as batch effect, distracting artifacts, or expertise or emotional state of rater, the algorithm will turn out the same results every time that it is run. That is, the intra-rater variability will always be zero. This could be especially applicable to scores such as Braak scores and plaque scores, and in turn, in diagnoses derived from these scores, such as the NIA-AA ABC score for AD pathology. These methods might also be useful for quantitation of features such as TDP-43 pathology in frontotemporal lobar degeneration - TDP, ALS and various other diseases such as AD, where TDP-43 pathology appears with regularity.
Finally, current time and cost obstacles toward digital implementations are certainly moving in the direction of facilitated implementation. For instance, the biggest time and costs investments in our protocol – including scanning, markup and analysis – are likely to decrease as WSIs gain footing in clinical workflow30 and as technology advances. For example, algorithms are currently in development to automatically segment the white/gray matter ROIs we discussed with other stains31 or diseases.29 Furthermore, while it is true that the upfront financial costs of digital analysis are high, implementation of WSI may be significantly cost-effective (~$14 million) in the long run after large-scale digital pathology implementation due to savings from improved productivity, workload distribution, and lab consolidation, as well as from reduced costs following incorrect decisions.32
CONCLUSION
Our results demonstrate the potential for digital analysis to be adapted to more complex staining procedures commonly used in neuropathological diagnosis. As the efficiency of scanning and digital analysis of histology images increases and as the clinic becomes more and more digital-friendly, we believe that the basis of the approach outlined in this manuscript may supplement current manual scoring methods by better standardizing AD diagnosis and the characterization of neuropathological changes, ultimately leading to a more comprehensive understanding of neurological disorders and more efficient patient care.
Supplementary Material
Acknowledgments
We would like to especially acknowledge the Emory Alzheimer’s Disease Research Center (NIA P50 AG025688) and the technical assistance of Deborah Cooper.
References
- 1.Perl DP. Neuropathology of Alzheimer’s disease. Mt Sinai J Med. 2010;77(1):32–42. doi: 10.1002/msj.20157. [DOI] [PMC free article] [PubMed] [Google Scholar]
- 2.Miao J, Xu F, Davis J, Otte-Höller I, Verbeek MM, Van Nostrand WE. Cerebral microvascular amyloid beta protein deposition induces vascular degeneration and neuroinflammation in transgenic mice expressing human vasculotropic mutant amyloid beta precursor protein. Am J Pathol. 2005;167(2):505–515. doi: 10.1016/s0002-9440(10)62993-8. [DOI] [PMC free article] [PubMed] [Google Scholar]
- 3.Braak H, Braak E. Neuropathological stageing of Alzheimer-related changes. Acta Neuropathol. 1991;82(4):239–259. doi: 10.1007/BF00308809. [DOI] [PubMed] [Google Scholar]
- 4.Mirra SS, Heyman A, McKeel D, et al. The Consortium to Establish a Registry for Alzheimer’s Disease (CERAD). Part II. Standardization of the neuropathologic assessment of Alzheimer’s disease. Neurology. 1991;41(4):479–486. doi: 10.1212/wnl.41.4.479. [DOI] [PubMed] [Google Scholar]
- 5.Thal DR, Rüb U, Orantes M, Braak H. Phases of A beta-deposition in the human brain and its relevance for the development of AD. Neurology. 2002;58(12):1791–1800. doi: 10.1212/wnl.58.12.1791. [DOI] [PubMed] [Google Scholar]
- 6.Hyman BT, Phelps CH, Beach TG, et al. National Institute on Aging-Alzheimer’s Association guidelines for the neuropathologic assessment of Alzheimer’s disease. Alzheimers Dement. 2012;8(1):1–13. doi: 10.1016/j.jalz.2011.10.007. [DOI] [PMC free article] [PubMed] [Google Scholar]
- 7.Montine TJ, Phelps CH, Beach TG, et al. National Institute on Aging-Alzheimer’s Association guidelines for the neuropathologic assessment of Alzheimer’s disease: a practical approach. Acta Neuropathol. 2012;123(1):1–11. doi: 10.1007/s00401-011-0910-3. [DOI] [PMC free article] [PubMed] [Google Scholar]
- 8.Chui HC, Tierney M, Zarow C, Lewis A, Sobel E, Perlmutter LS. Neuropathologic diagnosis of Alzheimer disease: interrater reliability in the assessment of senile plaques and neurofibrillary tangles. Alzheimer Dis Assoc Disord. 1993;7(1):48–54. [PubMed] [Google Scholar]
- 9.Halliday G, Ng T, Rodriguez M, et al. Consensus neuropathological diagnosis of common dementia syndromes: testing and standardising the use of multiple diagnostic criteria. Acta Neuropathol. 2002;104(1):72–78. doi: 10.1007/s00401-002-0529-5. [DOI] [PubMed] [Google Scholar]
- 10.Nelson PT, Kukull WA, Frosch MP. Thinking outside the box: Alzheimer-type neuropathology that does not map directly onto current consensus recommendations. J Neuropathol Exp Neurol. 2010;69(5):449–454. doi: 10.1097/NEN.0b013e3181d8db07. [DOI] [PMC free article] [PubMed] [Google Scholar]
- 11.Beach TG, Monsell SE, Phillips LE, Kukull W. Accuracy of the clinical diagnosis of Alzheimer disease at National Institute on Aging Alzheimer Disease Centers 2005–2010. J Neuropathol Exp Neurol. 2012;71(4):266–273. doi: 10.1097/NEN.0b013e31824b211b. [DOI] [PMC free article] [PubMed] [Google Scholar]
- 12.Walker L, McAleese KE, Thomas AJ, et al. Neuropathologically mixed Alzheimer’s and Lewy body disease: burden of pathological protein aggregates differs between clinical phenotypes. Acta Neuropathol. 2015;129(5):729–748. doi: 10.1007/s00401-015-1406-3. [DOI] [PubMed] [Google Scholar]
- 13.Neltner JH, Abner EL, Schmitt FA, et al. Digital pathology and image analysis for robust high-throughput quantitative assessment of Alzheimer disease neuropathologic changes. J Neuropathol Exp Neurol. 2012;71(12):1075–1085. doi: 10.1097/NEN.0b013e3182768de4. [DOI] [PMC free article] [PubMed] [Google Scholar]
- 14.Cantaloni C, Tonini RE, Eccher C, et al. Diagnostic value of automated Her2 evaluation in breast cancer: a study on 272 equivocal (score 2+) Her2 immunoreactive cases using an FDA approved system. Appl Immunohistochem Mol Morphol. 2011;19(4):306–312. doi: 10.1097/PAI.0b013e318205b03a. [DOI] [PubMed] [Google Scholar]
- 15.Nagy Z, Yilmazer-Hanke DM, Braak H, Braak E, Schultz C, Hanke J. Assessment of the pathological stages of Alzheimer’s disease in thin paraffin sections: a comparative study. Dement Geriatr Cogn Disord. 1998;9(3):140–144. doi: 10.1159/000017038. [DOI] [PubMed] [Google Scholar]
- 16.Chandana R, Mythri RB, Mahadevan A, Shankar SK, Srinivas Bharath MM. Biochemical analysis of protein stability in human brain collected at different postmortem intervals. Indian J Med Res. 2009;129(2):189–199. [PubMed] [Google Scholar]
- 17.Harrison PJ. Advances in post mortem molecular neurochemistry and neuropathology: examples from schizophrenia research. Br Med Bull. 1996;52(3):527–538. doi: 10.1093/oxfordjournals.bmb.a011565. [DOI] [PubMed] [Google Scholar]
- 18.Webster JD, Miller MA, Dusold D, Ramos-Vara J. Effects of prolonged formalin fixation on diagnostic immunohistochemistry in domestic animals. J Histochem Cytochem. 2009;57(8):753–761. doi: 10.1369/jhc.2009.953877. [DOI] [PMC free article] [PubMed] [Google Scholar]
- 19.Pikkarainen M, Martikainen P, Alafuzoff I. The effect of prolonged fixation time on immunohistochemical staining of common neurodegenerative disease markers. J Neuropathol Exp Neurol. 2010;69(1):40–52. doi: 10.1097/NEN.0b013e3181c6c13d. [DOI] [PubMed] [Google Scholar]
- 20.Albert MS, DeKosky ST, Dickson D, et al. The diagnosis of mild cognitive impairment due to Alzheimer’s disease: recommendations from the National Institute on Aging-Alzheimer’s Association workgroups on diagnostic guidelines for Alzheimer’s disease. Alzheimers Dement. 2011;7(3):270–279. doi: 10.1016/j.jalz.2011.03.008. [DOI] [PMC free article] [PubMed] [Google Scholar]
- 21.Cooper LA, Kong J, Gutman DA, Dunn WD, Nalisnik M, Brat DJ. Novel genotype-phenotype associations in human cancers enabled by advanced molecular platforms and computational analysis of whole slide images. Lab Invest. doi: 10.1038/labinvest.2014.153. [Internet] 2015 Jan 19. Available from URL. [DOI] [PMC free article] [PubMed] [Google Scholar]
- 22.Kothari S, Phan JH, Stokes TH, Wang MD. Pathology imaging informatics for quantitative analysis of whole-slide images. J Am Med Inform Assoc. 2013;20(6):1099–1108. doi: 10.1136/amiajnl-2012-001540. [DOI] [PMC free article] [PubMed] [Google Scholar]
- 23.Berg L, McKeel DW, Jr, Miller JP, et al. Clinicopathologic studies in cognitively healthy aging and Alzheimer’s disease: relation of histologic markers to dementia severity, age, sex, and apolipoprotein E genotype. Arch Neurol. 1998;55(3):326–335. doi: 10.1001/archneur.55.3.326. [DOI] [PubMed] [Google Scholar]
- 24.Markesbery WR, Schmitt FA, Kryscio RJ, Davis DG, Smith CD, Wekstein DR. Neuropathologic substrate of mild cognitive impairment. Arch Neurol. 2006;63(1):38–46. doi: 10.1001/archneur.63.1.38. [DOI] [PubMed] [Google Scholar]
- 25.Sonnen JA, Larson EB, Crane PK, et al. Pathological correlates of dementia in a longitudinal, population-based sample of aging. Ann Neurol. 2007;62(4):406–413. doi: 10.1002/ana.21208. [DOI] [PubMed] [Google Scholar]
- 26.Bancher C, Jellinger K, Lassmann H, Fischer P, Leblhuber F. Correlations between mental state and quantitative neuropathology in the Vienna Longitudinal Study on Dementia. Eur Arch Psychiatry Clin Neurosci. 1996;246(3):137–146. doi: 10.1007/BF02189115. [DOI] [PubMed] [Google Scholar]
- 27.Nelson PT, Jicha GA, Schmitt FA, et al. Clinicopathologic correlations in a large Alzheimer disease center autopsy cohort: neuritic plaques and neurofibrillary tangles “do count” when staging disease severity. J Neuropathol Exp Neurol. 2007;66(12):1136–1146. doi: 10.1097/nen.0b013e31815c5efb. [DOI] [PMC free article] [PubMed] [Google Scholar]
- 28.Isaacs M, Lennerz JK, Yates S, Clermont W, Rossi J, Pfeifer JD. Implementation of whole slide imaging in surgical pathology: A value added approach. J Pathol Inform. 2011;2:39. doi: 10.4103/2153-3539.84232. [DOI] [PMC free article] [PubMed] [Google Scholar]
- 29.Liu JYW, Ellis M, Brooke-Ball H, et al. High-throughput, automated quantification of white matter neurons in mild malformation of cortical development in epilepsy. Acta Neuropathol Commun. 2014;2:72. doi: 10.1186/2051-5960-2-72. [DOI] [PMC free article] [PubMed] [Google Scholar]
- 30.Pantanowitz L, Valenstein PN, Evans AJ, et al. Review of the current state of whole slide imaging in pathology. J Pathol Inform. 2011;2:36. doi: 10.4103/2153-3539.83746. [DOI] [PMC free article] [PubMed] [Google Scholar]
- 31.Webster JD, Dunstan RW. Whole-slide imaging and automated image analysis: considerations and opportunities in the practice of pathology. Vet Pathol. 2014;51(1):211–223. doi: 10.1177/0300985813503570. [DOI] [PubMed] [Google Scholar]
- 32.Ho J, Ahlers SM, Stratman C, et al. Can digital pathology result in cost savings? A financial projection for digital pathology implementation at a large integrated health care organization. J Pathol Inform. 2014;5:33. doi: 10.4103/2153-3539.139714. [DOI] [PMC free article] [PubMed] [Google Scholar]
Associated Data
This section collects any data citations, data availability statements, or supplementary materials included in this article.