

Organ dose is influenced by the presence of iodine, and this effect should be quantified and considered in designing CT acquisition and injection protocols.
Abstract
Purpose
To estimate the radiation dose as a result of contrast medium administration in a typical abdominal computed tomographic (CT) examination across a library of contrast material–enhanced computational patient models.
Materials and Methods
In part II of this study, first, the technique described in part I of this study was applied to enhance the extended cardiac-torso models with patient-specific iodine-time profiles reflecting the administration of contrast material. Second, the patient models were deployed to assess the patient-specific organ dose as a function of time in a typical abdominal CT examination using Monte Carlo simulation. In this hypothesis-generating study, organ dose refers to the total energy deposited in the unit mass of the tissue inclusive of iodine. Third, a study was performed as a strategy to anticipate the biologically relevant dose (absorbed dose to tissue) in highly perfused organs such as the liver and kidney. The time-varying organ-dose increment values relative to those for unenhanced CT examinations were reported.
Results
The results from the patient models subjected to the injection protocol indicated up to a total 53%, 30%, 35%, 54%, 27%, 18%, 17%, and 24% increase in radiation dose delivered to the heart, spleen, liver, kidneys, stomach, colon, small intestine, and pancreas, respectively. The biologically relevant dose increase with respect to the dose at an unenhanced CT examination was in the range of 0%–18% increase for the liver and 27% for the kidney across 58 patient models.
Conclusion
The administration of contrast medium increases the total radiation dose. However, radiation dose, while relevant to be included in estimating the risk associated with contrast-enhanced CT, may still not fully characterize the total biologic effects. Therefore, given the fact that many CT diagnostic decisions would be impossible without the use of iodine, this study suggests the need to consider the effect of iodinated contrast material on the organ doses to patients undergoing CT studies when designing CT protocols.
© RSNA, 2017
Introduction
The national Summit on Management of Radiation Dose in CT indicated a strong consensus among experts and leaders for targeting effective dose levels as low as 1 mSv or lower (1). Such a goal greatly accentuates the importance of optimizing current and emerging imaging applications in terms of image quality versus ionizing radiation dose through clinical trials. In the past decade, many research groups and institutions have addressed this concern of radiation dose by actively developing dose-monitoring programs by taking advantage of advanced computational human phantoms (2,3). While effective for dosimetry and optimization of many computed tomographic (CT) examinations, the current methods do not account for the effect of contrast material on the radiation dose (ie, total energy deposited in a unit-mass of tissue) delivered to the patient. Hence, they do not fully characterize contrast material–enhanced CT examinations, which are commonly used in CT imaging.
Contrast medium administration is used in CT to provide better image quality. However, it can also notably affect the radiation dose, as the application of iodinated contrast medium is accompanied by an increase in radiation absorption, part of which might lead to biologic damage. A clinical study (4) that applied a mathematic calculation technique revealed an increase in the total radiation dose during a routine thoracoabdominal CT examination. The increase in radiation damage to tissues and organs due to the presence of contrast material has been studied within the framework of contrast-enhanced radiation therapy (CERT) (5). Different techniques have been developed and proposed based on this concept (6–10). Dosimetric and microdosimetric studies of CERT across x-ray tube voltages (80–120 kVp) have shown significant impact (up to sixfold for an iodine concentration of 50 mg of iodine per milliliter [mg I/mL]) in tumors (11). In an in vivo study in mice, implanted tumors have been controlled by direct injection of iodinated contrast material in the tumor (12). The efficacy and safety of treating tumors by using a modified scanner and iodine were demonstrated in the treatment of spontaneous canine brain tumors; this was followed by the first clinical trial, which included eight patients (13).
Furthermore, there is a documented increase in the level of radiation-induced DNA double-strand breaks (DSBs) due to the presence of contrast material (14–16). A recent study of 179 patients undergoing a contrast-enhanced chest CT examination (17) demonstrated a significant increase (107% ± 19) in the number of phosphorylated histone H2AX foci per lymphocyte. DNA damage was investigated in peripheral blood lymphocytes. Similar damage could potentially be expected in other cells, but the study used lymphocytes because they are easily accessible through blood sampling. The formation of DSBs is generally followed by DNA repair, depending on the individual’s DSB repair capacity (18). However, that process presumably applies to both unenhanced and iodine-enhanced CT examinations. Therefore, the impact of iodine administration on radiation dose is relevant in spite of the biologic and physiologic complexities of cellular effects.
Moreover, prior studies have shown that patient-specific variabilities such as anatomy, size, age, and sex can have a notable effect on CT radiation dose (19). Thus, it is important to characterize the impact of the dose associated with contrast medium in the context of individual patients. In the first part of this study (20), we described a method to develop a library of patient models, five-dimensional extended cardiac torso (XCAT), that includes the patient-specific dynamics of blood flow and thus the perfusion of contrast medium resulting from the administration of a given injection function. This library provides the first practical platform, with the essential level of realism, to systematically study the impact of contrast medium in a patient-specific fashion.
In this study, we developed a method to quantify the patient-specific radiation doses (radiation dose to organ plus the dose to iodine molecules) as a function of time for a representative, routinely used contrast-enhanced abdominal CT protocol by employing our XCAT models along with Monte Carlo simulation to model the physics of radiation transport and absorption.
Materials and Methods
In part II of this study, first, we applied the technique described in part I of this study to enhance the XCAT models with patient-specific iodine-time profiles reflecting the administration of contrast material. Second, the patient models were deployed to assess the patient-specific organ doses as a function of time in a typical abdominal CT examination by using Monte Carlo simulation. In this hypothesis-generating study, organ dose is referred to as the total energy deposited in a unit-mass of the tissue inclusive of iodine. This study did not include intraorgan structures or vessels in the perfusion model, and thus did not exclude the intravascular contrast material within the organs. Third, a study was performed as a strategy to quantify the biologically relevant dose (absorbed dose to tissue). Sections below describe these three steps.
Preparation of Contrast-enhanced Patient Models
In part II of the study, the same population of 58 computational XCAT adult patient models was used (figure 3 in part I). To simulate contrast material perfusion in the XCAT phantoms, we used the previously validated patient-specific physiologically based pharmacokinetic (PBPK) contrast material model described in part I of the study (21). Contrast medium injection for each phantom was simulated on the basis of patient-specific iodine concentration-time results from our computational contrast medium propagation model for an intravenous injection protocol. In the second part of the study, the intravenous injection protocol was a uniphasic injection of 125 mL of contrast agent (320 mg I/mL) at 5 mL/sec (Fig 1). For each phantom, the patient-specific iodine concentration values as a function of time were first calculated for the different organs by using our PBPK model. By using these results, time-specific material files corresponding to different time points after the injection were generated. The material files contained a list of each organ’s concentration at different time points in the procedure.
Figure 1:

Graph shows intravenous contrast medium injection function, which was a uniphasic injection function of 125 mL of contrast agent (320 mg I/mL) at 5 mL/sec.
Radiation Dose Estimation
The library of our contrast-enhanced patient models combined with Monte Carlo simulations can characterize the organ dose changes attributed to iodine perfusion. An abdominal CT examination protocol in use at our institution was selected for this study (120 kVp, pitch of 1.375, beam collimation of 40 mm, and a large body scan field of view). The scan protocol and associated scan parameters were explicitly modeled in the Monte Carlo simulation. In this study, a Monte Carlo simulation package (PENELOPE, version 2011; Universitat de Barcelona, Barcelona, Spain) was used to model the CT examination (22). The organ dose was calculated by running a previously validated Monte Carlo code to simulate the geometry of a common 64-section CT system (LightSpeed VCT; GE Healthcare, Waukesha, Wis). The simulation included helical and axial modes and bowtie filters (19).
As described above, for each patient model, a time series of material files were generated and imported into the Monte Carlo simulation to compare the dose to the organs at discrete scan timings of 0, 5, 20, 30, 45, 55, 70, 80, 100, 120, and 180 seconds after contrast medium injection. (The scan at 0 second reflects any scan prior to the injection of contrast material.) For each patient model, the starting and ending points of the scan and the overranging length (6.40 cm, required for data interpolation in helical reconstruction) were estimated. The total scan length for the abdomen examination was determined by adding the total image coverage to the overranging length. In the Monte Carlo simulation for each CT examination, 80 million photons were initiated and tracked through each XCAT phantom (with relative errors within 1%–4%) (19).
For each scan timing, the radiation dose to the organs was calculated from the deposited energy by the photons in each organ across all the XCAT phantoms. The collision kerma estimator used can be classified as a track-length estimator, keeping track of the photon fluence track length (23). Dose delivered to the bone marrow was estimated by tallying the volume-averaged photon fluence spectrum at each skeletal site and by using the fluence-to-dose conversion coefficients of monoenergetic photons in the cancellous bone of the skeleton (24). A single active marrow dose was then calculated as its skeletal average by using the age-dependent fractional distribution of active marrow tabulated in International Commission on Radiological Protection 89 (25,26). The radiation dose delivered to the organs inside the scan coverage, including the spleen, liver, kidneys, stomach, small intestine, colon, and pancreas, as well as the heart (located on the periphery of the scan range), was calculated at the selected scan timings.
The organ doses normalized by volumetric CT dose index (CTDI) (CTDIvol) at the different scan time points across the different “patients” were calculated. The CTDIvol (6.23 mGy/100 mAs) used in this study was estimated on the basis of the technical reference manual of the GE LightSpeed VCT scanner by using the tables of CTDI100 and technique adjustment factors from a 32-cm-diameter CTDI phantom. The percentage increase in the normalized doses was calculated as follows:
where DoseBI and DoseAI are the radiation doses before and after the injection of contrast medium, respectively. Moreover, the distribution of the maximum dose increment across the XCAT population was plotted for all of the studied organs.
Sensitivity Study
Not all organs are similar in terms of the proximity of iodine to the tissue material during blood perfusion through the organ, and not all of the secondary electrons interacting with iodine molecules would interact with tissue cells, particularly for iodine in larger arteries and veins. Although not all factors affecting this influence are known, we performed a study to quantify the biologically relevant dose in liver and kidney. The study assumed that for highly perfused organs such as the liver and kidney, as the blood perfuses from the main artery to the capillaries and subsequently washes out from the veins, the proximity of iodine to tissue material follows a normal distribution as a function of time (Fig 2). (Following this approach, dose to the cardiac chambers would be excluded from the heart dose, as that blood does not perfuse through the organ.) The biologically relevant dose to the organ was then estimated by multiplying the tissue contribution of iodine by the total radiation dose to the organ across all the patient models.
Figure 2:

Graph shows tissue contribution of radiation dose increase due to the presence of iodine in different components of a vessels network. The distribution was approximated by the probability of the secondary electrons generated inside the iodine being deposited outside the vessel by using a Monte Carlo simulation of a simplified organ model.
For the above estimation, the peak tissue contribution value was computed assuming that the generation of secondary electrons, responsible for the majority of the biologic effect, is proportional to the fraction of photoelectrons that can escape the iodinated blood. By using this assumption, a Monte Carlo simulation was performed in a simplified organ to compute the probability of the secondary electrons generated inside the iodine being deposited outside the vessel (described in Appendix E1 [online]). The model consisted of two inner and outer cylinders representing the vessel and tissue, respectively. The upper range of the probability was approximated as 51% by modeling the capillary with the lower range of capillary diameter, 5 μm. This probability was used as the peak value of our tissue contribution.
Results
Iodine Concentration-Time and Contrast-enhanced Models
By using our PBPK contrast model, patient- and time-specific iodine concentrations were simulated for different organs across different XCAT patient phantoms. Figure 3 shows the iodine concentration curves as a function of time after the injection of contrast medium for the heart, spleen, liver, kidneys, stomach, small intestine, colon, and pancreas across the library of 58 XCAT patient models.
Figure 3:

Graphs show simulated iodine concentration curves for different organs (spleen, liver, kidneys, stomach, small intestine, colon, and pancreas) across a library of XCAT models for a contrast-enhanced abdominal CT examination.
Organ Doses
Applying our Monte Carlo simulation program, we estimated the patient-specific organ dose for the contrast-enhanced patient models. Figure 4 shows the organ dose normalized by CTDIvol as a function of time for all 58 XCAT phantoms. For individual patients, the dose data points shown with filled circles are connected to each other with dashed lines. The minimum, maximum, mean, and standard deviation values of the increase in the normalized dose results with respect to the dose results from the scans before the injection (time = 0 sec) are reported in the Table. The distribution of the maximum dose increments across the XCAT library simply follows a pattern with a high probability of getting an observation near the middle and lower probabilities as we get further from the middle (Fig 5).
Figure 4:

Graphs show results of Monte Carlo simulation of the organ dose to the heart, spleen, liver, kidneys, stomach, colon, small intestine, and pancreas as a function of time across the XCAT models for a contrast-enhanced abdominal CT examination. The organ doses are normalized by CTDIvol.
Values of the Increase in CTDIvol Normalized Organ Dose due to the Administration of Contrast Medium with Respect to the Dose before Injection
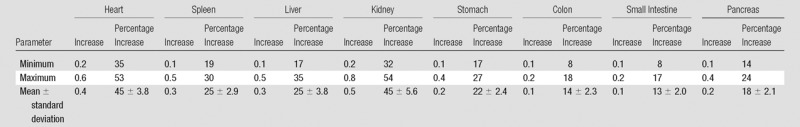
Figure 5:

Graphs show distribution of the maximum dose increment (as a percentage) in the heart, spleen, liver, kidney, stomach, colon, small intestine, and pancreas due to the administration of contrast medium across the XCAT models.
Sensitivity Study
Figure 6 shows the range of increase in dose normalized by CTDIvol as the blood distributes through the vessel network, including arteries, capillaries, and veins, in the liver and kidney for all the patient models. The predicted biologically relevant dose increase with respect to the dose at unenhanced CT was in the range of 0–0.28 (18% increase) for the liver and 0–0.39 (27%) for the kidney across the 58 patient models.
Figure 6:

Graphs show potential range of radiation dose alteration for, A, liver and, B, kidney. The impact of iodine on radiation dose increase varies as the iodinated blood circulates through the vascular system. A normal distribution was assumed for the impact of iodine on dose increase, as the blood enters the arteries and flows through the capillaries in which it experiences the maximum proximity to the tissue cells and washes out subsequently through the veins.
Discussion
As described in the introduction, although the majority of CT imaging applications use contrast medium administration to achieve better image quality, most of the imaging optimization studies lack consideration of the effect of contrast medium on radiation dose. Recent studies (15,17) have noted the impact of iodinated contrast materials on DNA damage, particularly an x-ray–induced DSB effect, during CT examinations. This study applied a previously validated contrast medium perfusion human model in a population of virtual patients to estimate organ doses (radiation dose to tissue plus the dose to iodine molecules) in contrast-enhanced CT examinations. The results indicate a marked increase in the total radiation dose due to the presence of iodine.
Results of previous studies (27,28) have shown that the increase in radiation dose is most likely caused by the photoelectric absorption and, particularly, the generation of secondary electrons when x-rays are absorbed by the contrast material. However, the radiation dose delivered to the tissue cannot be precisely known except through a complete biologic model, which is beyond the scope of the present study. In this study, we did not aim to calculate the biologic effect or the radiation risk. Our goal was to estimate the increase in total radiation dose delivered to the tissue mixed with iodine by using a validated Monte Carlo program with our library of patient-specific contrast-enhanced computer models. It is likely that a large percentage of x-rays are absorbed in contrast material and not in human soft tissues. However, in the absence of precise biologic models, estimation of the total radiation dose delivered to the organ is still relevant. A case in point is radiation dose to bones, where doses to calcium alone and doses to the osteal cells differ dramatically. Yet we rarely break the organs into subcomponents for dosimetry purposes. Organ dose is influenced by the presence of iodine, and this effect should be quantified and considered in designing CT acquisition and injection protocols.
Simulating the dose results by applying a large library of retrospectively chosen virtual patients representing a wide range of body types and age groups of adult men and women allowed us to estimate organ doses. It has been shown that normalizing the organ dose by CTDIvol makes the dose results largely scanner independent; hence, the results can be further generalized to other CT examinations with different CTDIvol values with reasonable (<10%) accuracy (29). Note that these numbers are averaged across the entire population, and for an individual patient, this error can be as large as 45% (stomach for abdominopelvic examinations), consistent with our earlier report (30). As a first-order approximation, as approached in this study, we attempted to isolate the impact of contrast medium alone. However, more accurate patient-specific dose calculations need to take both contrast medium and tube current modulation into account.
Our study revealed that for a contrast-enhanced abdominal CT examination, organ dose (dose to the organ plus the dose to iodinated contrast material) normalized by CTDIvol remarkably increased. The simulation results indicated up to a total 53%, 30%, 35%, 54%, 27%, 18%, 17%, and 24% dose increase in the iodinated contrast material–enhanced heart, spleen, liver, kidneys, stomach, colon, small intestine, and pancreas, respectively, with respect to the radiation dose in the absence of contrast material or at time of 0. Among the tissues studied here, the kidneys and heart showed the highest average dose increments (45%). For the kidneys, this marked increase can be explained by the high renal enhancement resulting from their high vascularization (28). For the heart, it can be explained by the higher iodine concentration observed in the right side of the heart. Notably, despite the fact that the maximum iodine concentration in the heart (5.6–10.1 mg I/mL) was relatively higher than the iodine concentration in the kidneys (3.9–6.8 mg I/mL), the radiation dose in the kidneys was slightly higher. This can be explained by the fact that for an abdominal CT examination, the heart, in contrast to the other organs, is only partially irradiated (ie, the heart is not fully located in the scan coverage) (22). However, as described before, this increase in radiation dose is calculated as the difference of energy deposited per unit-mass in iodine-enhanced and unenhanced organs. In the study, we further assumed that in highly perfused organs like the liver and kidney, the increase in radiation dose can be approximated by a normal distribution reflecting the proximity of iodine to the organs as it distributes through the blood vessels. Our results in 58 patient models showed that for an individual patient, the potential dose increase was in the range of 0%–18% in the liver while iodine is in the capillary network and in the range of 0%–27% for the kidney.
The distribution of the maximum dose increment across the XCAT library simply followed a pattern with a high probability of getting an observation near the middle and lower probabilities as we get further from the middle. Such behavior can be described by a Gaussian probability distribution defined by two parameters of the mean and the standard deviation of the dose increase due to the contrast medium. This basically implies that across a patient population, radiation dose increment due to the presence of contrast material as a variable reflects the effects of many other variables, such as age, sex, weight, and anatomy; hence, the contrast material distribution in this particular study was normally distributed. Our results illustrated a wider distribution (σ > 4%) in dose increment in some organs such as the kidney and spleen, while a narrower distribution (σ < 1.5%) was observed in other organs such as the small intestine and colon. This results from a larger variance in iodine concentration across different patients in the kidney and spleen in contrast with that for the small intestine and colon.
This study had several limitations. First, our study did not directly focus on the biologic dose. As described in part I, in the PBPK contrast model applied in this study, the uniform mixture of blood and contrast material was assumed to be distributed homogeneously throughout the organ compartment and subsequently washed out. In other words, the model does not account for the fraction of contrast material dose within large vessels in the organs that may not be contributing to the increased dose in tissues. To address this limitation, we hope to include intraorgan perfusion in the future version of the developed model. However, because the dose to the organs was tallied from the deposited energy in each organ as a whole, this simplifying assumption would not affect the total radiation dose results. Second, to create a library of contrast-enhanced XCAT models, a physiologic simplification assumption was made that the cardiac output of each model was governed by the height, weight, and age of the patient. Although a nominal cardiac output can be predicted on the basis of a patient’s attributes, there are other factors that can also affect cardiac output. Third, the tube-current modulation was not explicitly modeled in our simulation. However, this limitation does not substantially impact the validation of our results: In clinical practice, the tube-current modulation is largely planned prior to contrast medium administration so contrast enhancement due to the distribution of contrast medium does not alter the tube current. Thus, the relative dose increase values described in the Equation would be largely independent of tube current. Another limitation was the lack of diversity in the CT systems and protocol parameters. However, typical examination conditions were simulated, and, given the normalization of the dose to CTDIvol and dose-length product, these metrics are expected to be largely system and protocol independent. Finally, our study did not include an evaluation of image quality. The balance between radiation dose and image quality must be carefully evaluated on a case-by-case basis (31).
In summary, we introduced a technique to quantify the radiation doses delivered to patients undergoing contrast-enhanced CT examinations. We presented the Monte Carlo–simulated radiation doses to different enhanced organs as a function of time across a population of contrast-enhanced XCAT models. In this work, we also presented evidence that the administration of contrast medium increases the total radiation dose.
However, radiation dose, while relevant to be included in estimating the risk associated with contrast-enhanced CT, still may not fully characterize the total biologic effects. Therefore, given the fact that many CT diagnostic decisions would be impossible without the use of iodine, this hypothesis-generating study suggests the need to consider the effect of iodinated contrast material on the organ doses to patients undergoing CT when new CT protocols are designed.
Advances in Knowledge
■ Incorporation of contrast medium dynamics into human models enables total radiation dose estimation that accounts for the presence of the contrast medium in different organs as a function of time.
■ In the absence of precise biologic models, it is worthwhile to quantify organ dose in the presence of iodine as an additional metric of consideration in designing CT acquisition and contrast material injection protocols.
■ The administration of contrast material potentially can increase the total radiation dose (up to 54% in the kidney); the anticipated biologically relevant dose increase with respect to the dose at unenhanced CT is in the range of a 0%–18% increase for the liver and 27% for the kidney across 58 patient models.
Implication for Patient Care
■ Contrast enhancement is used in more than 60% of CT imaging studies, which not only remarkably affects the CT image quality but also increases the total radiation dose.
APPENDIX
SUPPLEMENTAL FIGURES
Acknowledgments
Acknowledgments
The authors thank Anuj Kapadia, PhD, Dr Manu Lakshmanan, and Dr Brian Harrawood from Duke University for their valuable discussions related to Monte Carlo techniques.
Received January 8, 2016; revision requested February 26; revision received September 16; accepted November 4; final version accepted January 20, 2017.
Study supported in part by the National Institutes of Health (2R01EB001838-09A1).
From the 2014 RSNA Annual Meeting.
See also the article by Sahbaee et al and the editorial by Boone and Hernandez in this issue.
Disclosures of Conflicts of Interest: P.S. disclosed no relevant relationships. E.A. disclosed no relevant relationships. W.P.S. Activities related to the present article: disclosed no relevant relationships. Activities not related to the present article: has been a consultant for CFD research; receives money from Duke University Licensing for software licensed through the Duke University Licensing Office. Other relationships: disclosed no relevant relationships. D.M. disclosed no relevant relationships. R.C.N. disclosed no relevant relationships. E.S. Activities related to the present article: disclosed no relevant relationships. Activities not related to the present article: has received grants from Siemens Medical Solutions and GE Healthcare. Other relationships: disclosed no relevant relationships.
Abbreviations:
- CTDI
- CT dose index
- CTDIvol
- volumetric CTDI
- DSB
- double-strand break
- PBPK
- physiologically based pharmacokinetic
- XCAT
- extended cardiac torso
References
- 1.McCollough CH, Chen GH, Kalender W, et al. Achieving routine submillisievert CT scanning: report from the Summit on Management of Radiation Dose in CT. Radiology 2012;264(2):567–580. [DOI] [PMC free article] [PubMed] [Google Scholar]
- 2.Cassola VF, Lima VJ, Kramer R, Khoury HJ. FASH and MASH: female and male adult human phantoms based on polygon mesh surfaces. I. Development of the anatomy. Phys Med Biol 2010;55(1):133–162. [DOI] [PubMed] [Google Scholar]
- 3.Lee C, Lodwick D, Hurtado J, Pafundi D, Williams JL, Bolch WE. The UF family of reference hybrid phantoms for computational radiation dosimetry. Phys Med Biol 2010;55(2):339–363. [DOI] [PMC free article] [PubMed] [Google Scholar]
- 4.Amato E, Salamone I, Naso S, Bottari A, Gaeta M, Blandino A. Can contrast media increase organ doses in CT examinations? a clinical study. AJR Am J Roentgenol 2013;200(6):1288–1293. [DOI] [PubMed] [Google Scholar]
- 5.Garnica-Garza HM. Contrast-enhanced radiotherapy: feasibility and characteristics of the physical absorbed dose distribution for deep-seated tumors. Phys Med Biol 2009;54(18):5411–5425. [DOI] [PubMed] [Google Scholar]
- 6.Weil MD. Dual-Use Radiation System. US 20080063142 A1, 2007. http://www.freepatentsonline.com/y2008/0063142.html. [Google Scholar]
- 7.Weil MD, Morris KN, Malzbender RM. Targeting agents for enhancing radiation therapy. US 8709380 B1, 2007. http://www.freepatentsonline.com/8709380.html. [Google Scholar]
- 8.Pietsch H. Contrast agent-reinforced radiotherapy having high-output tubes. US 20110200165 A1, 2009. http://www.freepatentsonline.com/y2011/0200165.html. [Google Scholar]
- 9.Edouard M, Broggio D, Prezado Y, Estève F, Elleaume H, Adam JF. Treatment plans optimization for contrast-enhanced synchrotron stereotactic radiotherapy. Med Phys 2010;37(6):2445–2456. [DOI] [PubMed] [Google Scholar]
- 10.Garnica-Garza HM. A Monte Carlo comparison of three different media for contrast enhanced radiotherapy of the prostate. Technol Cancer Res Treat 2010;9(3):271–278. [DOI] [PubMed] [Google Scholar]
- 11.Verhaegen F, Reniers B, Deblois F, Devic S, Seuntjens J, Hristov D. Dosimetric and microdosimetric study of contrast-enhanced radiotherapy with kilovolt x-rays. Phys Med Biol 2005;50(15):3555–3569. [DOI] [PubMed] [Google Scholar]
- 12.Santos Mello R, Callisen H, Winter J, Kagan AR, Norman A. Radiation dose enhancement in tumors with iodine. Med Phys 1983;10(1):75–78. [DOI] [PubMed] [Google Scholar]
- 13.Rose JH, Norman A, Ingram M, Aoki C, Solberg T, Mesa A. First radiotherapy of human metastatic brain tumors delivered by a computerized tomography scanner (CTRx). Int J Radiat Oncol Biol Phys 1999;45(5):1127–1132. [DOI] [PubMed] [Google Scholar]
- 14.Geisel D, Heverhagen JT, Kalinowski M, Wagner HJ. DNA double-strand breaks after percutaneous transluminal angioplasty. Radiology 2008;248(3):852–859. [DOI] [PubMed] [Google Scholar]
- 15.Grudzenski S, Kuefner MA, Heckmann MB, Uder M, Löbrich M. Contrast medium-enhanced radiation damage caused by CT examinations. Radiology 2009;253(3):706–714. [DOI] [PubMed] [Google Scholar]
- 16.Pathe C, Eble K, Schmitz-Beuting D, et al. The presence of iodinated contrast agents amplifies DNA radiation damage in computed tomography. Contrast Media Mol Imaging 2011;6(6):507–513. [DOI] [PubMed] [Google Scholar]
- 17.Piechowiak EI, Peter J-FW, Kleb B, Klose KJ, Heverhagen JT. Intravenous iodinated contrast agents amplify DNA radiation damage at CT. Radiology 2015;275(3):692–697. [DOI] [PubMed] [Google Scholar]
- 18.Löbrich M, Rief N, Kühne M, et al. In vivo formation and repair of DNA double-strand breaks after computed tomography examinations. Proc Natl Acad Sci U S A 2005;102(25):8984–8989. [DOI] [PMC free article] [PubMed] [Google Scholar]
- 19.Li X, Samei E, Segars WP, et al. Patient-specific radiation dose and cancer risk estimation in CT. II. Application to patients. Med Phys 2011;38(1):408–419. [DOI] [PMC free article] [PubMed] [Google Scholar]
- 20.Sahbaee P, Segars WP, Marin D, Nelson RC, Samei E. The effect of contrast material on radiation dose at CT: part I—incorporation of contrast material dynamics in anthropomorphic phantoms. Radiology doi:10.1148/radiol.2016152851. Published online January 13, 2017. Accessed March 2, 2017. [DOI] [PMC free article] [PubMed] [Google Scholar]
- 21.Sahbaee P, Segars WP, Marin D, Nelson R, Samei E. Determination of contrast media administration to achieve a targeted contrast enhancement in computed tomography. J Med Imaging (Bellingham) 2016;3(1):013501. [DOI] [PMC free article] [PubMed] [Google Scholar]
- 22.Sahbaee P, Segars WP, Samei E. Patient-based estimation of organ dose for a population of 58 adult patients across 13 protocol categories. Med Phys 2014;41(7):072104. [DOI] [PMC free article] [PubMed] [Google Scholar]
- 23.Cristy M, Eckerman K. Specific absorbed fractions of energy at various ages from internal photon sources. V. Fifteen-year-old male and adult female. ORNUTM-8381 A/5. Oak Ridge, Tenn: Oak Ridge National Laboratory, 1987. [Google Scholar]
- 24.Kerr GD, Eckerman KF, eds. Neutron and photon fluence-to-dose conversion factors for active marrow of the skeleton. In: Proceedings of the Fifth Symposium on Neutron Dosimetry. Luxembourg: Commission of the European Communities, 1985. [Google Scholar]
- 25.Basic anatomical and physiological data for use in radiological protection: reference values. A report of age- and gender-related differences in the anatomical and physiological characteristics of reference individuals. ICRP Publication 89. Ann ICRP 2002;32(3-4):5–265. [PubMed] [Google Scholar]
- 26.Cousins C, Miller DL, Bernardi G, et al. ICRP PUBLICATION 120: Radiological protection in cardiology. Ann ICRP 2013;42(1):1–125. [DOI] [PubMed] [Google Scholar]
- 27.Bushberg JT, Boone JM. The essential physics of medical imaging. Philadelphia, Pa: Lippincott Williams & Wilkins, 2011. [Google Scholar]
- 28.Thomsen HS, Morcos SK. Contrast media and the kidney: European Society of Urogenital Radiology (ESUR) guidelines. Br J Radiol 2003;76(908):513–518. [DOI] [PubMed] [Google Scholar]
- 29.Turner AC, Zankl M, DeMarco JJ, et al. The feasibility of a scanner-independent technique to estimate organ dose from MDCT scans: using CTDIvol to account for differences between scanners. Med Phys 2010;37(4):1816–1825. [DOI] [PMC free article] [PubMed] [Google Scholar]
- 30.van Straten M, Deak P, Shrimpton PC, Kalender WA. The effect of angular and longitudinal tube current modulations on the estimation of organ and effective doses in x-ray computed tomography. Med Phys 2009;36(11):4881–4889. [DOI] [PubMed] [Google Scholar]
- 31.Tian X, Li X, Segars WP, Frush DP, Paulson EK, Samei E. Dose coefficients in pediatric and adult abdominopelvic CT based on 100 patient models. Phys Med Biol 2013;58(24):8755–8768. [DOI] [PubMed] [Google Scholar]
Associated Data
This section collects any data citations, data availability statements, or supplementary materials included in this article.