MR imaging–based nonlinear finite element analysis measurements of the hip are reproducible and have the potential to be used in longitudinal studies to assess patient-specific hip fracture risk.
Abstract
Purpose
To describe a nonlinear finite element analysis method by using magnetic resonance (MR) images for the assessment of the mechanical competence of the hip and to demonstrate the reproducibility of the tool.
Materials and Methods
This prospective study received institutional review board approval and fully complied with HIPAA regulations for patient data. Written informed consent was obtained from all subjects. A nonlinear finite element analysis method was developed to estimate mechanical parameters that relate to hip fracture resistance by using MR images. Twenty-three women (mean age ± standard deviation, 61.7 years ± 13.8) were recruited from a single osteoporosis center. To thoroughly assess the reproducibility of the finite element method, three separate analyses were performed: a test-retest reproducibility analysis, where each of the first 13 subjects underwent MR imaging on three separate occasions to determine longitudinal variability, and an intra- and interoperator reproducibility analysis, where a single examination was performed in each of the next 10 subjects and four operators independently performed the analysis two times in each of the subjects. Reproducibility of parameters that reflect fracture resistance was assessed by using the intraclass correlation coefficient and the coefficient of variation.
Results
For test-retest reproducibility analysis and inter- and intraoperator analyses for proximal femur stiffness, yield strain, yield load, ultimate strain, ultimate load, resilience, and toughness in both stance and sideways-fall loading configurations each had an individual median coefficient of variation of less than 10%. Additionally, all measures had an intraclass correlation coefficient higher than 0.99.
Conclusion
This experiment demonstrates that the finite element analysis model can consistently and reliably provide fracture risk information on correctly segmented bone images.
© RSNA, 2016
Introduction
The World Health Organization defines osteoporosis as a disease of reduced bone strength and increased fracture risk due to low bone mass and microstructural deterioration (1). Hip fractures in particular have the most devastating consequences, with a mortality rate as high as 24% in the 1st year after fracture (2,3). The standard-of-care test used to diagnose osteoporosis is dual x-ray absorptiometry (DXA) estimation of areal bone mineral density in the hip and spine (1). In vivo, lower bone mineral density correlates with higher fracture risk (1,4). However, DXA cannot demonstrate many properties of bone that contribute to bone strength (5,6). While advancements in DXA processing have greatly improved the technique by accounting for volumetric differences (7), in vivo it is susceptible to measurement error from overlying soft-tissue calcifications and not taking bone architecture into account (5,6). Most notably, DXA alone cannot be used to identify most of the individuals who are at risk for fracture. Specifically, more than 50% of those who sustain fragility fractures, including hip fractures, do not have low enough bone mineral density to meet DXA criteria for an osteoporosis diagnosis (8,9). These patients could have benefitted from existing osteoporosis medications, which are capable of reducing fracture risk by approximately 50% (10).
In response to the clinical need for a more sensitive tool for fracture risk assessment, finite element analysis (FEA) models were developed and applied to computed tomographic (CT) images of skeletal structures to noninvasively estimate patient bone strength (11–13). However, CT-based FEA models are typically based on bone macrostructure, rather than more detailed bone microstructure (14). While advancements have been achieved in CT–based FEA by using section dimensions in the order of millimeters, especially in the vertebra (15), we focused on the proximal femur, which is the site of most osteoporosis fractures (8). Recently, in vivo imaging of bone microstructure was achieved via magnetic resonance (MR) imaging (16,17), followed by the application of subregional linear FEA to MR images of bone microstructure (18).
There is a need to take the next step forward in the fields of in vivo bone imaging and hip fracture risk assessment by incorporating an individual’s microstructural anatomy into the strength assessment. The purpose of our study was to describe a nonlinear FEA method by using MR images for the assessment of the mechanical competence of the hip and to demonstrate the reproducibility of the tool.
Materials and Methods
Subject Recruitment
Our prospective study received institutional review board approval and fully complied with all Health Insurance Portability and Accountability Act regulations for patient data. Our study was conducted between 2014 and 2016, during which written informed consent was obtained from all subjects. For reproducibility testing, we recruited 23 subjects from the Osteoporosis Center at our institution (20 postmenopausal women and three premenopausal women; mean age ± standard deviation, 61.7 years ± 13.8; mean body mass index, 20.9 kg/m2 ± 2.1; mean lumbar spine T score, −2.7 ± 0.9; mean femoral neck T score, −2.5 ± 1). We excluded subjects with a history of osteoarthritis, inflammatory arthritis, bone cancer, or Paget disease. Nine of the 23 subjects were taking or had previously taken oral bisphosphonate. For a case study, we recruited two additional individuals: a 56-year-old woman who did not have a history of hip or spine fracture and had a DXA hip T score of −2.5 with a diagnosis of osteoporosis and a 28-year-old man who sustained a left hip fracture and had a DXA hip T score of −1.2 and no diagnosis of osteoporosis.
Study Design
To thoroughly assess the reproducibility of the FEA method and analysis, this study involved three separate analyses: (a) a test-retest reproducibility analysis, in which each of the first 13 subjects underwent imaging on three separate occasions to determine longitudinal variability; (b) an interoperator reproducibility analysis, where four operators independently analyzed identical image sets from the next 10 subjects and results were compared between operators for consistency; and (c) an intraoperator reproducibility analysis, where the four operators independently analyzed the same images from the same 10 participants two times, 2 weeks apart, and results were compared within operators. Authors A.H., A.R., S.V., and R.M. performed the analysis and had varying levels of experience (1–5 years of experience as a medical student, expert rater, orthopedic surgery resident, and undergraduate student, respectively). Additionally, a case study was performed to demonstrate the ability of the finite element method to demonstrate differences in bone strength between a patient with a fracture (MR imaging performed on the hip contralateral to the fracture) and a patient with osteoporosis but without fracture.
MR Imaging
The nondominant hip of all subjects was imaged with a 3-T whole-body MR imaging unit (Skyra; Siemens, Erlangen, Germany) by using a 26-element receive-coil setup (18 elements from a body matrix coil anteriorly and eight elements from a spine coil posteriorly). The coil was wrapped and secured around the hip. We used a three-dimensional fast low-angle shot sequence with the following parameters: repetition time (msec)/echo time (msec), 37/4.92; voxel dimensions, 0.234 × 0.234 mm; section thickness, 1.5 mm; 60 coronal sections; bandwidth, 200 Hz per pixel; parallel acceleration (generalized autocalibrating partially parallel acquisition) factor of two; and acquisition time, 15 minutes 18 seconds. Resolution was confirmed previously and was slightly lower than the dimensions stated in our previous work (19), and field inhomogeneity across the field of view was negligible. The 13 subjects who participated in the test-retest portion of this study each underwent imaging a total of three times (twice in one day, with repositioning between examinations, and once 1 week later). The group of 10 subjects who participated in the inter- and intraoperator section of the study and the two participants selected for a case study each underwent imaging one time on different days.
Preprocessing of Images
The periosteal border of the whole proximal femur and the acetabulum was segmented on all MR images by using freely available Firevoxel software (https://wp.nyu.edu/firevoxel/). After segmentation of three-dimensional image data sets, the gray-scale values of the images were linearly scaled to cover the range from 0% to 100%, with pure marrow and bone intensity having minimum and maximum values, respectively (20,21). This approach allows us to account for both partial volume effects and the presence of red marrow, which may have different signal intensity than fatty marrow. We refer to the resulting three-dimensional array that represents the fractional occupancy of bone at each voxel location as the bone volume fraction map.
Development and Implementation of Nonlinear FEA Solver
Estimating femur strength from the bone volume fraction maps was performed by generating a microlevel finite element model of each femur. This technique involves the creation of a finite-element mesh, which represents each voxel in the segmented bone volume fraction map with an equally sized linear hexahedral finite element (0.234 × 0.234 × 1.5-mm dimensions). Since there are currently no unique quantitative criteria to identify the fracture point on a simulated stress-strain curve at each finite element, we used post-yield behavior of bone assumed to behave as an elastic-plastic failure theory similar to that described in the study of Betten (22). The tissue modulus of elasticity for each element was set proportionally to the gray-scale intensity range established by the bone volume fraction map (0%–100%), with 100% intensity assigned a value of 15 GPa for bone tissue (21,23). The Poisson ratio was set at 0.3 for each model. Nonlinear FEA was used, as it has been shown to enable more accurate assessment of hip strength relative to linear analysis (12). The finite element software was developed by using C++, similar to the approach described in the studies of Magland et al and Rajapakse et al (20,21).
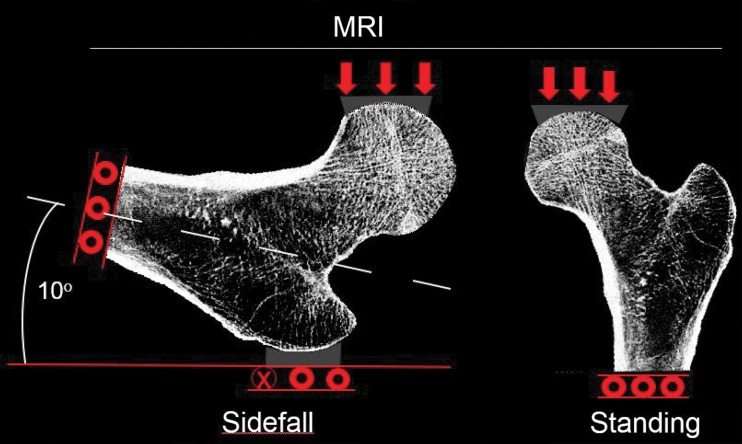
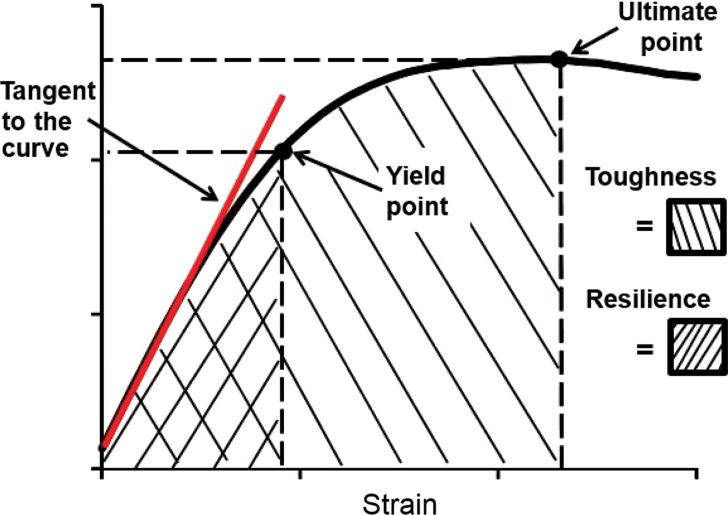
Estimations of hip strength were performed by conducting simulations on finite element models with two different loading conditions that mimic forces sustained by the femur. The first simulation was performed in a “sideways-fall” orientation to mimic the most common direction of hip fracture injuries (Fig 1a). This aimed to mimic displacement to the acetabular contact region of the femoral head while constraining the greater trochanter opposite the loaded surface of the femoral head. While most procedures in the literature involve the use of a generic shape to apply displacement to the femoral head, we instead segmented the bones of the pelvis and applied this shape in a patient-specific manner to more accurately demonstrate the individual differences in skeletal architecture. Other boundary conditions at the greater trochanter and shaft are similar to other established methods (24). As the displacements increase, the reaction force at the femoral head will initially increase, reach a peak point that indicates fracture (ie, MR imaging–derived strength), and finally decrease (Fig 1b). This mechanical behavior can be simulated in a finite element model of the hip by using a tissue-level kernel defined by a hyperbolic secant with heterogeneous isotropic tissue modulus, yield strength, and postyield properties used to describe a nonlinear stress-strain relationship at each bone voxel. Another simulation was performed to mimic loading conditions similar to “standing” orientation. Strain maps created with FEA were rendered in three dimensions by using the Digital Imaging and Communications in Medicine image viewer OsiriX (Pixmeo, Geneva, Switzerland).
Figure 1a:
(a) Diagram of boundary conditions for the sideways-fall and standing orientations demonstrates the direction of applied force and the side restrictions. (b) Stress-strain (or force-displacement) curve allows several measures of bone strength to be calculated. Bone stiffness is defined as the tangent to the initial point of the force–displacement curve (red line). The yield point is defined on the curve as the point at which plastic deformation begins to occur, obtained by using the 0.2% offset rule. Resilience is defined as the area under the curve up to the yield point. The ultimate point is defined as the point of maximum force. Toughness is defined as the area under the curve until the ultimate point.
Figure 1b:
(a) Diagram of boundary conditions for the sideways-fall and standing orientations demonstrates the direction of applied force and the side restrictions. (b) Stress-strain (or force-displacement) curve allows several measures of bone strength to be calculated. Bone stiffness is defined as the tangent to the initial point of the force–displacement curve (red line). The yield point is defined on the curve as the point at which plastic deformation begins to occur, obtained by using the 0.2% offset rule. Resilience is defined as the area under the curve up to the yield point. The ultimate point is defined as the point of maximum force. Toughness is defined as the area under the curve until the ultimate point.
Statistical Analysis
Intersession and intersubject variances associated with bone toughness, resilience, stiffness, ultimate load and strain, and yield load and strain were assessed, with these parameters being extracted automatically from the generated force-strain curves by using a specially designed computer script. The variance component estimates were used to compute the intraclass correlation coefficient (ICC) and the coefficient of variation (CV) as measures of reproducibility.
Results
A representative MR image, strain map, and force-displacement curve from a subject are shown in Figure 1. There is high strain within the greater trochanter and the femoral neck, which are the most common sites of hip fracture in the setting of a sideways fall.
Test-Retest Reproducibility
The median CVs for proximal femur stiffness, yield strain, yield load, ultimate strain, ultimate load, resilience, and toughness for both loading configurations were all below 8% (Table 1). The ICCs for all measures were higher than 0.99, indicating a high degree of consistency and reproducibility between examinations. Individual results showed a high degree of consistency in local strains sustained by the femur within subjects between examinations (Fig 2), while showing high variability in mechanical competence between subjects (Fig 3).
Table 1.
CV for the Test-Retest Study

Note.—Data are CVs, reported as medians with interquartile ranges in parentheses. Data were acquired in 13 patients who underwent three repeat imaging examinations each.
Figure 2a:
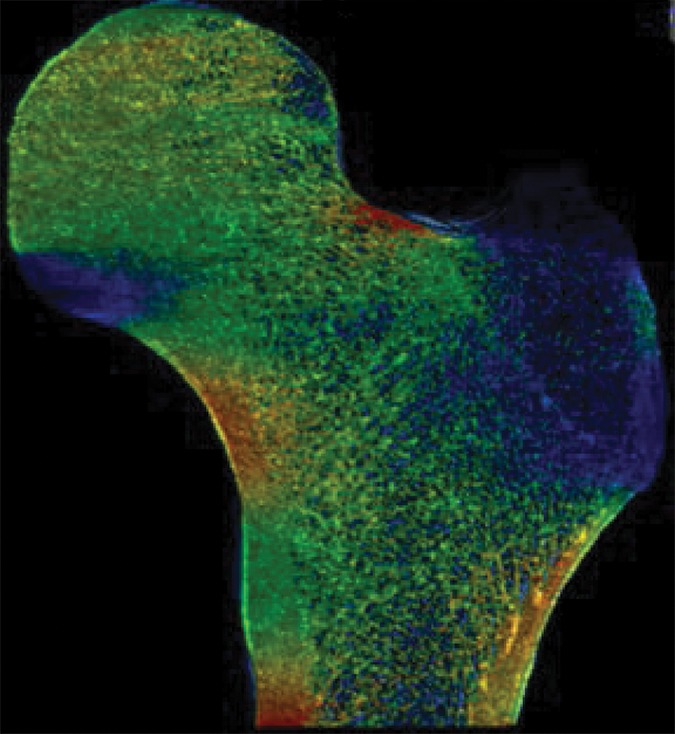
Example strain maps of (a–c) standing and (d–f) sideways-fall orientations. As part of the test-retest reproducibility experiment, all six strain maps are from the same individual, a 63-year-old man, and show a high degree of reproducibility over short time periods.
Figure 3a:
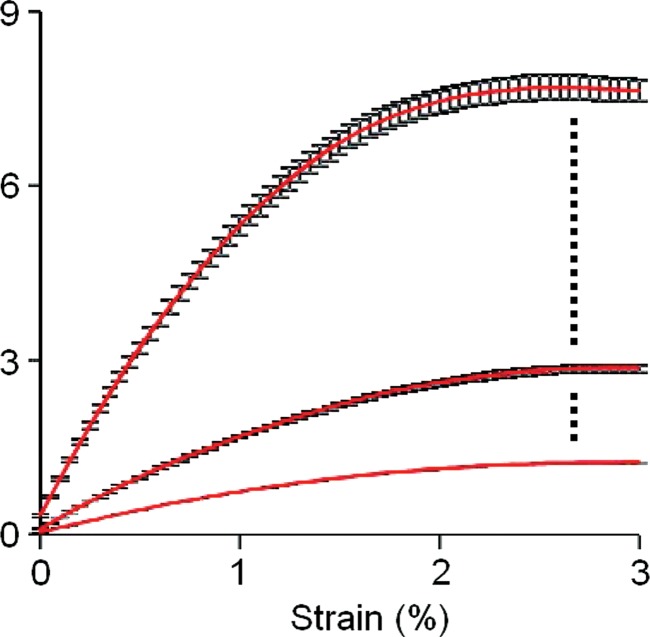
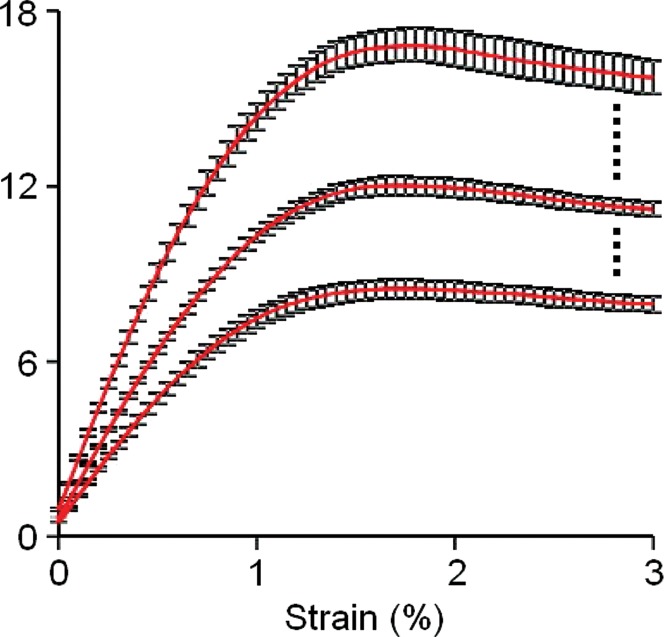
Graphs show the response of bone to applied strain in (a) a horizontal sideways-fall position and (b) a vertical standing position. Each individual underwent imaging and analysis in triplicate, and the results were averaged. The strongest, weakest, and median cases from the total group of 13 individuals are displayed on each graph with standard error.
Figure 2b:
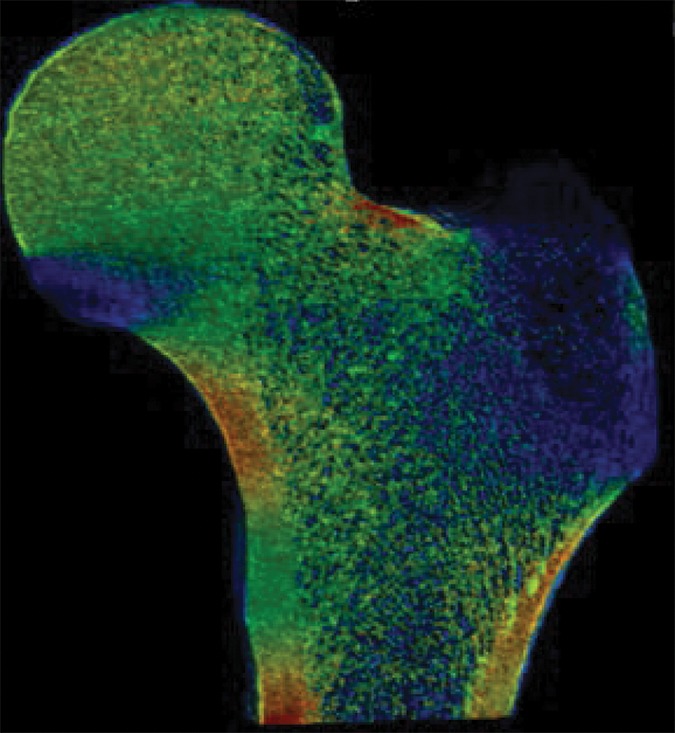
Example strain maps of (a–c) standing and (d–f) sideways-fall orientations. As part of the test-retest reproducibility experiment, all six strain maps are from the same individual, a 63-year-old man, and show a high degree of reproducibility over short time periods.
Figure 2c:
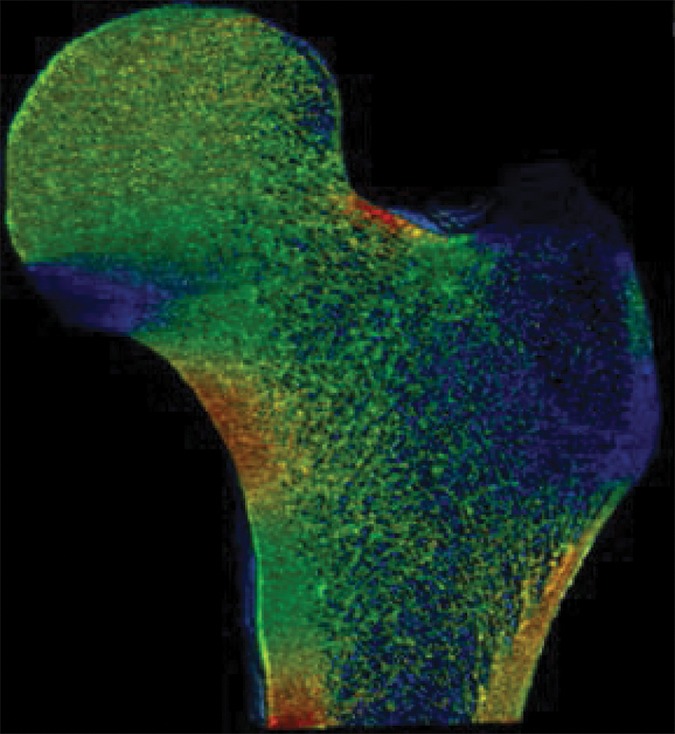
Example strain maps of (a–c) standing and (d–f) sideways-fall orientations. As part of the test-retest reproducibility experiment, all six strain maps are from the same individual, a 63-year-old man, and show a high degree of reproducibility over short time periods.
Figure 2d:
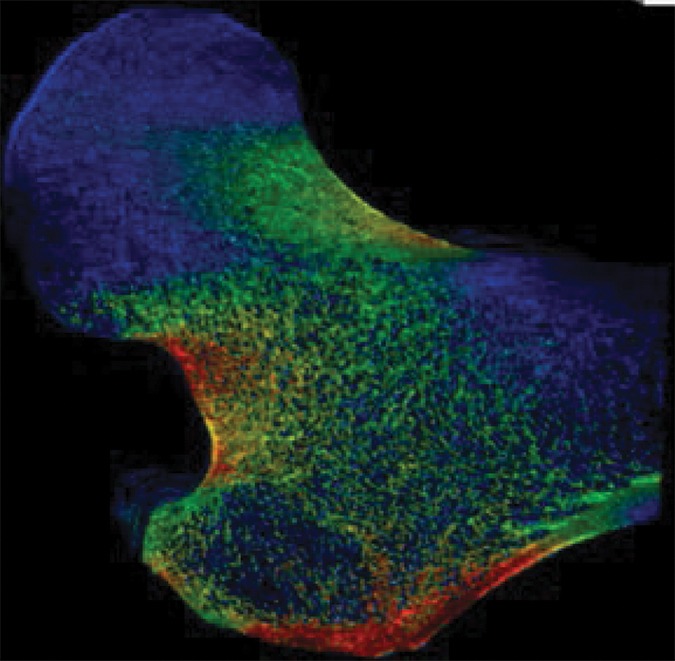
Example strain maps of (a–c) standing and (d–f) sideways-fall orientations. As part of the test-retest reproducibility experiment, all six strain maps are from the same individual, a 63-year-old man, and show a high degree of reproducibility over short time periods.
Figure 2e:
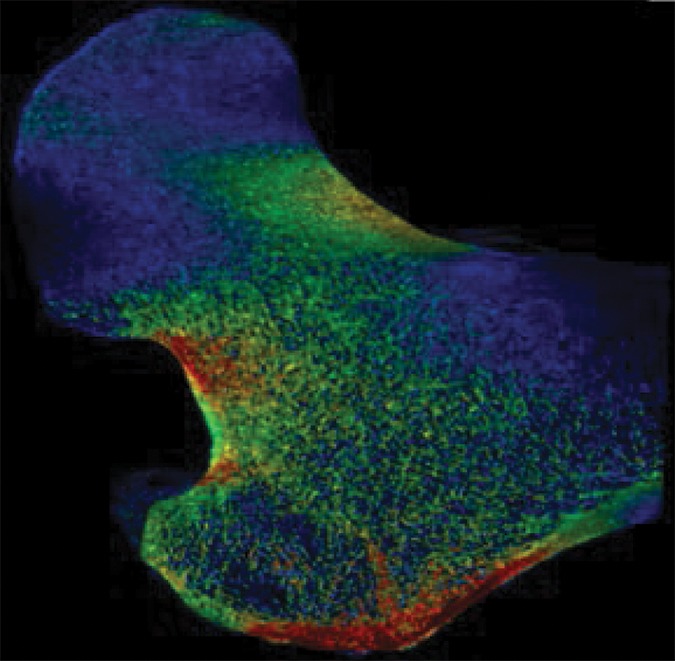
Example strain maps of (a–c) standing and (d–f) sideways-fall orientations. As part of the test-retest reproducibility experiment, all six strain maps are from the same individual, a 63-year-old man, and show a high degree of reproducibility over short time periods.
Figure 2f:
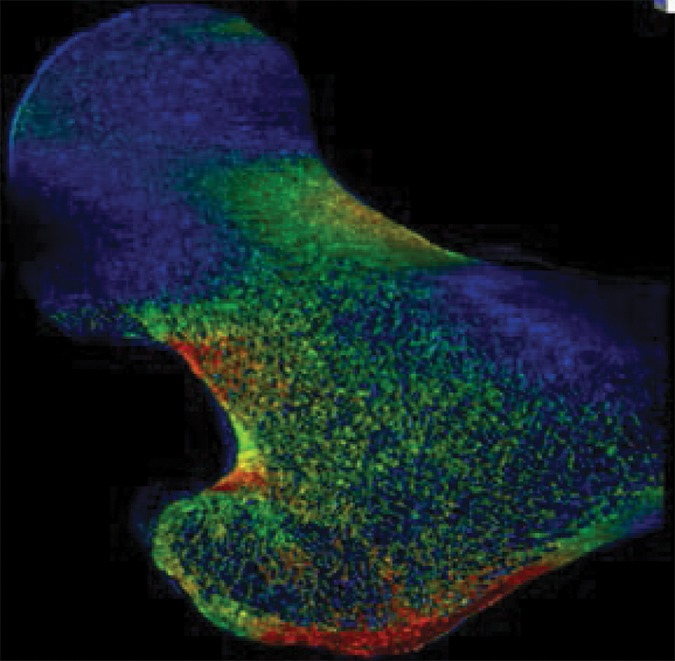
Example strain maps of (a–c) standing and (d–f) sideways-fall orientations. As part of the test-retest reproducibility experiment, all six strain maps are from the same individual, a 63-year-old man, and show a high degree of reproducibility over short time periods.
Figure 3b:
Graphs show the response of bone to applied strain in (a) a horizontal sideways-fall position and (b) a vertical standing position. Each individual underwent imaging and analysis in triplicate, and the results were averaged. The strongest, weakest, and median cases from the total group of 13 individuals are displayed on each graph with standard error.
Interoperator Reproducibility
The median CVs for proximal femur stiffness, yield strain, yield load, ultimate strain, ultimate load, resilience, and toughness for both loading configurations were all below 9% (Table 2). The ICCs for all bone strength measures were higher than 0.99, indicating a high degree of consistency and reproducibility between operators. A high degree of similarity in local strains sustained by the femur was observed between images processed by different operators (Fig E1 [online]), while showing clear differences in mechanical competence between subjects (Fig E2 [online]).
Table 2.
CV for Interoperator Reproducibility

Note.—Data are CVs, reported as medians with interquartile ranges in parentheses. Data were acquired in 10 patients; four operators performed two repeat segmentations per patient.
Intraoperator Segmentation Reproducibility
The median CVs for proximal femur stiffness, yield strain, yield load, ultimate strain, ultimate load, resilience, and toughness for both loading configurations were all below 5% (Table 3). The ICCs for all measures were higher than 0.99, indicating a high degree of intraoperator consistency and reproducibility. Strain maps generated from the same images with repeat analysis at different times showed consistency in strain distribution across the femur (Fig E3 [online]).
Table 3.
CV for Intraoperator Reproducibility

Note.—Data are CVs, reported as medians with interquartile ranges in parentheses. Data were acquired in 10 patients; four operators performed two repeat segmentations per patient.
Fracture versus Nonfracture Identification
As a case study, one participant who received a diagnosis of osteoporosis with DXA but who did not have a history of bone fractures and another subject who sustained a hip fracture but did not meet the diagnosis criteria for osteoporosis with DXA both underwent identical MR imaging examinations and nonlinear FEA procedures on the right proximal femur. Despite being almost 3 decades older and having been classified as osteoporotic according to DXA findings, the subject without fracture showed superior mechanical competence with our approach, compared with the patient with fracture who received a diagnosis of not being osteoporotic according to DXA—with 9% greater ultimate strength in the standing configuration (12.54 kN vs 11.51 kN, respectively) and 25% greater ultimate strength in the sideways-fall configuration (10.96 kN vs 8.80 kN, respectively) (Fig 4, Fig E4 [online]).
Figure 4a:
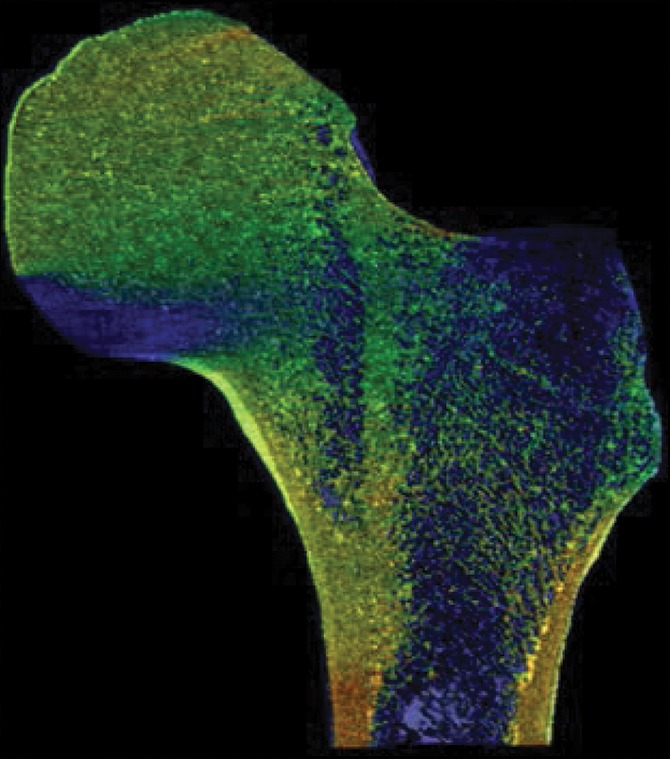
Strain map comparison between (a, c) a 56-year-old woman who received a diagnosis of osteoporosis and (b, d) a “healthy” 28-year-old man with a DXA total hip T score well short of the criterion for osteoporosis (criterion of −1.2). The comparatively reduced trabecular bone volume can be seen at visual inspection in the patient with osteoporosis (a and c); however, this patient never fractured her hip, whereas the patient on b and d sustained a hip fracture (in the contralateral femur). Regular DXA results led to classification of the patient on a and c as having a higher risk for fracture; however, the strain map clearly shows the “healthy” patient on b and d to be more susceptible to fracture.
Figure 4b:
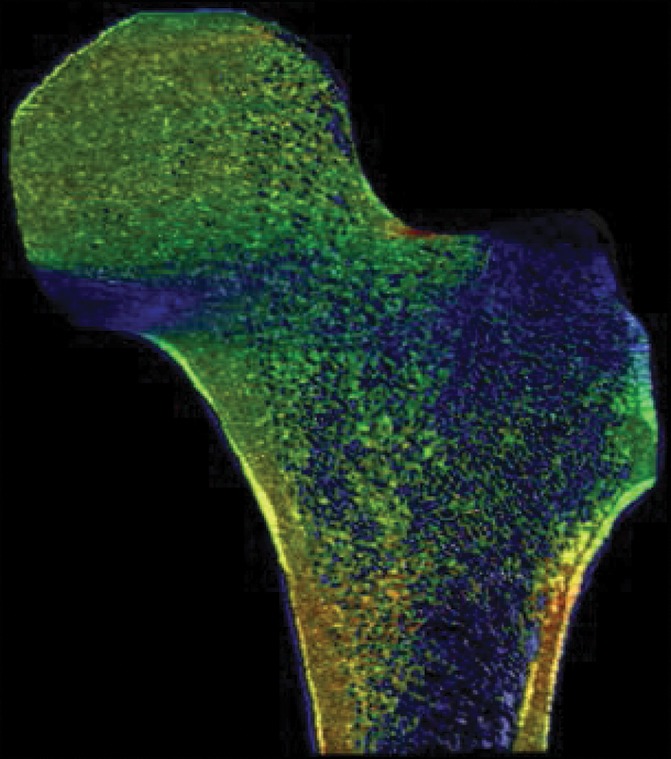
Strain map comparison between (a, c) a 56-year-old woman who received a diagnosis of osteoporosis and (b, d) a “healthy” 28-year-old man with a DXA total hip T score well short of the criterion for osteoporosis (criterion of −1.2). The comparatively reduced trabecular bone volume can be seen at visual inspection in the patient with osteoporosis (a and c); however, this patient never fractured her hip, whereas the patient on b and d sustained a hip fracture (in the contralateral femur). Regular DXA results led to classification of the patient on a and c as having a higher risk for fracture; however, the strain map clearly shows the “healthy” patient on b and d to be more susceptible to fracture.
Figure 4c:
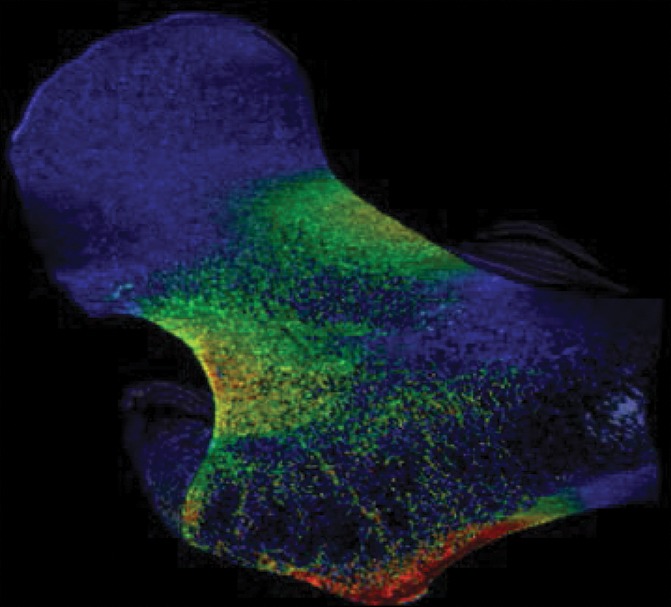
Strain map comparison between (a, c) a 56-year-old woman who received a diagnosis of osteoporosis and (b, d) a “healthy” 28-year-old man with a DXA total hip T score well short of the criterion for osteoporosis (criterion of −1.2). The comparatively reduced trabecular bone volume can be seen at visual inspection in the patient with osteoporosis (a and c); however, this patient never fractured her hip, whereas the patient on b and d sustained a hip fracture (in the contralateral femur). Regular DXA results led to classification of the patient on a and c as having a higher risk for fracture; however, the strain map clearly shows the “healthy” patient on b and d to be more susceptible to fracture.
Figure 4d:
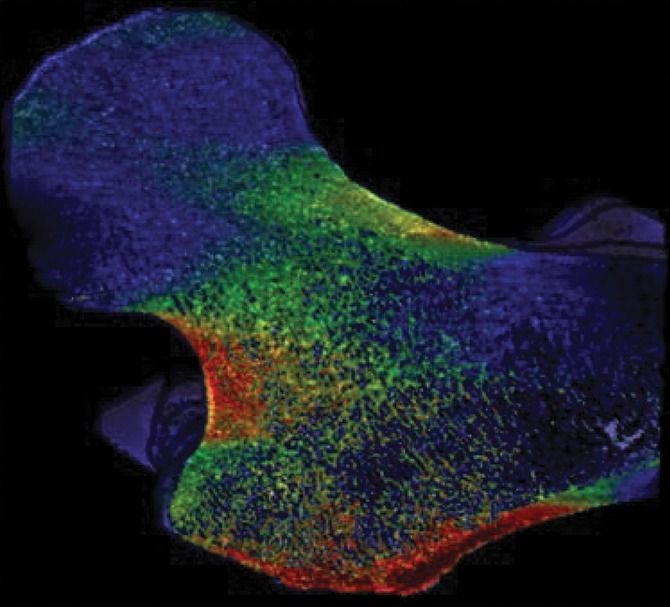
Strain map comparison between (a, c) a 56-year-old woman who received a diagnosis of osteoporosis and (b, d) a “healthy” 28-year-old man with a DXA total hip T score well short of the criterion for osteoporosis (criterion of −1.2). The comparatively reduced trabecular bone volume can be seen at visual inspection in the patient with osteoporosis (a and c); however, this patient never fractured her hip, whereas the patient on b and d sustained a hip fracture (in the contralateral femur). Regular DXA results led to classification of the patient on a and c as having a higher risk for fracture; however, the strain map clearly shows the “healthy” patient on b and d to be more susceptible to fracture.
Discussion
We described the development and application of a nonlinear finite element approach to compute whole femur strength under two realistic loading conditions based on images of bone microstructure of the hip obtained in vivo. Our approach accounts for the contribution of an individual’s own bone microstructure within the proximal femur on the whole femur strength. Since osteoporosis is ultimately a disease of reduced bone strength due to both low bone mass and deterioration in bone microstructure, a test that permits noninvasive estimation of bone strength and accounts for alterations in bone microstructure is highly desired. Additionally, we showed the high measurement reproducibility of the nonlinear finite element method, both for MR imaging examinations performed on the same day and on different days and for MR images segmented by the same user and by different users. The measurement reproducibility is within a range suitable for clinical cross-sectional studies of disease states or longitudinal studies of disease progression or treatment response. We also showed in a case study the potential of our approach to allow identification of patients at risk for hip fracture compared with the current clinical standard of DXA.
Our work bridges the previous technology gap that was separating the in vitro and in vivo realms of noninvasive bone strength assessment. Specifically, in the in vitro setting, nonlinear FEA has been applied to images of proximal femur microstructure obtained with micro-CT (25). In the in vivo setting, nonlinear FEA has been applied to images of proximal femur macrostructure (obtained with clinical CT) (26) or to images of distal radius and/or tibia microstructure (obtained with thin-section peripheral quantitative CT or MR imaging) (13) but never to images of proximal femur microstructure. The reason why nonlinear FEA applied to images of proximal femur microstructure is important is because nonlinear models are considered more accurate than linear models, and finite element modeling based on bone microstructure is more accurate than finite element methods based only on bone macrostructure (12).
The biomechanics approach used for our study provides a unique advantage when paired with the in vivo MR images of bone microstructure that were not available previously. We have developed a model that accounts for bone microstructure in a highly detailed manner while maintaining a quick and inexpensive analysis process that does not require specialized, costly computer equipment. This would allow for the future dissemination of both the imaging process and finite element modeling code to apply as a useful clinical tool for diagnostic studies and also for longitudinal studies of bone strength and fracture prediction in larger populations. The flexible application of the model to multiple orientations provides a more comprehensive tool to determine fracture risk and guide potential interventions.
The demonstration of reliable and consistent measures of bone strength gained from this study sets the stage for future clinical cross-sectional and longitudinal studies. The reproducibility of bone strength measures between operators and across patient visits is within a range that would be suitable for continuation of the method in a larger longitudinal cohort to reliably track changes in bone structure over time and in response to interventions and treatments. Until now, there has been no practical method for finite element modeling of the whole proximal femur that takes account of bone microstructure and is also not heavily dependent on outsized levels of computing power. Our FEA model can be favorably compared with one described by Dragomir-Daescu et al, which required 1 week to perform analysis on a model with approximately 2 million elements (27); our model involved 3–4 million elements, and analysis could be completed within 30 minutes on a powerful desktop computer.
Additionally, the case study performed between the patient with fracture and the patient without fracture suggests that finite element measures may provide additional useful information about fracture risk beyond traditional DXA T scores. The subject who had not received a diagnosis of osteoporosis still sustained a hip fracture not long before the MR imaging examination. In comparison, the subject who received a diagnosis of osteoporosis according to a low DXA hip T score had not sustained any fracture. Our finite element model showed that the “healthy” patient according to DXA was still at a higher risk of fracture (in the hip that had not been fractured) than the patient who received a diagnosis of osteoporosis with DXA. This ability to provide useful additional information about bone quality and fracture risk could allow clinicians to more accurately assess fracture risk in patients than if we used DXA alone. Future research should focus on the development of a comprehensive metric of bone fracture risk that includes FEA modeling, as well as successful existing techniques (28).
Potential limitations of our study include the careful oversight by an experienced musculoskeletal radiologist and other research staff to quality check MR measurements and train the operators for image segmentation. While such attention to reproducibility likely improved the consistency of our results, future studies could also include reliable and experienced investigators to quality check images before analysis. The development of best practice guidelines to support investigators in future studies is important. Another limitation of our study is that we did not calibrate the strain values on strain maps in terms of percentage of microstrain. Strain maps are designed to be purely illustrative of how greater strain can be visually represented and how accurate quantification of the relationship between voxel intensity and absolute strain value is not possible.
In conclusion, we have described a nonlinear FEA method by using MR images for the assessment of mechanical competence of the hip and demonstrated the reproducibility of the tool. Our experiment demonstrates that the FEA model can consistently and reliably provide fracture risk information on correctly segmented bone images. Future clinical trials could include a much larger cohort of postmenopausal women to test the relevance of our technique in monitoring disease progression and treatment effectiveness.
Advances in Knowledge
■ A method was developed and applied to assess patient-specific fracture properties of the entire proximal femur as a whole by using microstructural MR imaging and nonlinear finite element analysis.
■ The reproducibility of parameters relating to the mechanical competence of the proximal femur was demonstrated under loading conditions that mimicked falling onto the hip or standing.
Implication for Patient Care
■ Our approach would allow for the noninvasive assessment of hip fracture resistance in human subjects without exposing the pelvic regions to ionizing radiation; the strong reproducibility of the estimated mechanical parameters suggests that this tool would be suitable for tracking hip fracture risk and the response to treatment longitudinally.
SUPPLEMENTAL FIGURES
Received May 5, 2016; revision requested July 21; revision received August 24; accepted September 13; final version accepted October 12.
Supported by the National Institutes of Health (R01 AR066008, R01 AR068382).
Abbreviations:
- CV
- coefficient of variation
- DXA
- dual x-ray absorptiometry
- FEA
- finite element analysis
- ICC
- intraclass correlation coefficient
References
- 1.Kanis JA. Diagnosis of osteoporosis and assessment of fracture risk. Lancet 2002;359(9321):1929–1936. [DOI] [PubMed] [Google Scholar]
- 2.Leibson CL, Tosteson AN, Gabriel SE, Ransom JE, Melton LJ. Mortality, disability, and nursing home use for persons with and without hip fracture: a population-based study. J Am Geriatr Soc 2002;50(10):1644–1650. [DOI] [PubMed] [Google Scholar]
- 3.Cooper C, Atkinson EJ, Jacobsen SJ, O’Fallon WM, Melton LJ, 3rd. Population-based study of survival after osteoporotic fractures. Am J Epidemiol 1993;137(9):1001–1005. [DOI] [PubMed] [Google Scholar]
- 4.Marshall D, Johnell O, Wedel H. Meta-analysis of how well measures of bone mineral density predict occurrence of osteoporotic fractures. BMJ 1996;312(7041):1254–1259. [DOI] [PMC free article] [PubMed] [Google Scholar]
- 5.Bolotin HH. DXA in vivo BMD methodology: an erroneous and misleading research and clinical gauge of bone mineral status, bone fragility, and bone remodelling. Bone 2007;41(1):138–154. [DOI] [PubMed] [Google Scholar]
- 6.Bolotin HH, Sievänen H. Inaccuracies inherent in dual-energy x-ray absorptiometry in vivo bone mineral density can seriously mislead diagnostic/prognostic interpretations of patient-specific bone fragility. J Bone Miner Res 2001;16(5):799–805. [DOI] [PubMed] [Google Scholar]
- 7.Carter DR, Bouxsein ML, Marcus R. New approaches for interpreting projected bone densitometry data. J Bone Miner Res 1992;7(2):137–145. [DOI] [PubMed] [Google Scholar]
- 8.Wainwright SA, Marshall LM, Ensrud KE, et al. Hip fracture in women without osteoporosis. J Clin Endocrinol Metab 2005;90(5):2787–2793. [DOI] [PubMed] [Google Scholar]
- 9.Schuit SC, van der Klift M, Weel AE, et al. Fracture incidence and association with bone mineral density in elderly men and women: the Rotterdam study. Bone 2004;34(1):195–202. [DOI] [PubMed] [Google Scholar]
- 10.Crandall CJ, Newberry SJ, Diamant A, et al. Treatment to Prevent Fractures in Men and Women with Low Bone Density or Osteoporosis: Update of a 2007 Report. Rockville, Md: Agency for Healthcare Research and Quality, 2012. [PubMed] [Google Scholar]
- 11.van Rietbergen B, Majumdar S, Pistoia W, et al. Assessment of cancellous bone mechanical properties from micro-FE models based on micro-CT, pQCT and MR images. Technol Health Care 1998;6(5-6):413–420. [PubMed] [Google Scholar]
- 12.Keyak JH. Improved prediction of proximal femoral fracture load using nonlinear finite element models. Med Eng Phys 2001;23(3):165–173. [DOI] [PubMed] [Google Scholar]
- 13.Niebur GL, Feldstein MJ, Yuen JC, Chen TJ, Keaveny TM. High-resolution finite element models with tissue strength asymmetry accurately predict failure of trabecular bone. J Biomech 2000;33(12):1575–1583. [DOI] [PubMed] [Google Scholar]
- 14.Lang TF. Quantitative computed tomography. Radiol Clin North Am 2010;48(3):589–600. [DOI] [PubMed] [Google Scholar]
- 15.Keaveny TM, Donley DW, Hoffmann PF, Mitlak BH, Glass EV, San Martin JA. Effects of teriparatide and alendronate on vertebral strength as assessed by finite element modeling of QCT scans in women with osteoporosis. J Bone Miner Res 2007;22(1):149–157. [DOI] [PubMed] [Google Scholar]
- 16.Chang G, Deniz CM, Honig S, et al. Feasibility of three-dimensional MRI of proximal femur microarchitecture at 3 Tesla using 26 receive elements without and with parallel imaging. J Magn Reson Imaging 2014;40(1):229–238. [DOI] [PMC free article] [PubMed] [Google Scholar]
- 17.Han M, Chiba K, Banerjee S, Carballido-Gamio J, Krug R. Variable flip angle three-dimensional fast spin-echo sequence combined with outer volume suppression for imaging trabecular bone structure of the proximal femur. J Magn Reson Imaging 2015;41(5):1300–1310. [DOI] [PMC free article] [PubMed] [Google Scholar]
- 18.Chang G, Honig S, Brown R, et al. Finite element analysis applied to 3-T MR imaging of proximal femur microarchitecture: lower bone strength in patients with fragility fractures compared with control subjects. Radiology 2014;272(2):464–474. [DOI] [PMC free article] [PubMed] [Google Scholar]
- 19.Rajapakse CS, Magland J, Wald MJ, et al. Image-based estimation of trabecular bone mechanical parameters at resolutions achievable in vivo [abstr]. Presented at the 55th annual meeting of the Orthopaedic Research Society, Las Vegas, 2009. [Google Scholar]
- 20.Magland JF, Zhang N, Rajapakse CS, Wehrli FW. Computationally-optimized bone mechanical modeling from high-resolution structural images. PLoS One 2012;7(4):e35525. [DOI] [PMC free article] [PubMed] [Google Scholar]
- 21.Rajapakse CS, Magland JF, Wald MJ, et al. Computational biomechanics of the distal tibia from high-resolution MR and micro-CT images. Bone 2010;47(3):556–563. [DOI] [PMC free article] [PubMed] [Google Scholar]
- 22.Betten J. Generalization of nonlinear material laws found in experiments to multi-axial states of stress. Eur J Mech A Solids 1989;8(5):325–339. [Google Scholar]
- 23.Keyak JH, Sigurdsson S, Karlsdottir GS, et al. Effect of finite element model loading condition on fracture risk assessment in men and women: the AGES-Reykjavik study. Bone 2013;57(1):18–29. [DOI] [PMC free article] [PubMed] [Google Scholar]
- 24.Orwoll ES, Marshall LM, Nielson CM, et al. Finite element analysis of the proximal femur and hip fracture risk in older men. J Bone Miner Res 2009;24(3):475–483. [DOI] [PMC free article] [PubMed] [Google Scholar]
- 25.Yosibash Z, Padan R, Joskowicz L, Milgrom C. A CT-based high-order finite element analysis of the human proximal femur compared to in-vitro experiments. J Biomech Eng 2007;129(3):297–309. [DOI] [PubMed] [Google Scholar]
- 26.Kopperdahl DL, Aspelund T, Hoffmann PF, et al. Assessment of incident spine and hip fractures in women and men using finite element analysis of CT scans. J Bone Miner Res 2014;29(3):570–580. [DOI] [PMC free article] [PubMed] [Google Scholar]
- 27.Dragomir-Daescu D, Op Den Buijs J, McEligot S, et al. Robust QCT/FEA models of proximal femur stiffness and fracture load during a sideways fall on the hip. Ann Biomed Eng 2011;39(2):742–755. [DOI] [PMC free article] [PubMed] [Google Scholar]
- 28.Link TM. Osteoporosis imaging: state of the art and advanced imaging. Radiology 2012;263(1):3–17. [DOI] [PMC free article] [PubMed] [Google Scholar]
Associated Data
This section collects any data citations, data availability statements, or supplementary materials included in this article.


