Automated measures of breast density from synthetic digital mammograms correlate well with those from standard two-dimensional mammograms.
Abstract
Purpose
To evaluate agreement between automated estimates of breast density made from standard-dose versus synthetic digital mammograms in a large cohort of women undergoing screening.
Materials and Methods
This study received institutional review board approval with waiver of consent. A total of 3668 negative (Breast Imaging Reporting and Data System category 1 or 2) digital breast tomosynthesis (DBT) screening examinations consecutively performed over a 4-month period at one institution for which both standard-dose and synthetic mammograms were available for analysis were retrospectively analyzed. All mammograms were acquired with a Selenia Dimensions system (Hologic, Bedford, Mass), and synthetic mammograms were generated by using the U.S. Food and Drug Administration–approved “C-View” software module. The “For Presentation” standard-dose mammograms and synthetic images were analyzed by using a fully automated algorithm. Agreement between density estimates was assessed by using Pearson correlation, linear regression, and Bland-Altman analysis. Differences were evaluated by using the paired Student t test.
Results
Breast percentage density (PD) estimates from synthetic and standard-dose mammograms were highly correlated (r = 0.92, P < .001), and the 95% Bland-Altman limits of agreement between PD estimates were −6.4% to 9.9%. Synthetic mammograms had PD estimates by an average of 1.7% higher than standard-dose mammograms (P < .001), with a larger disagreement by 1.56% in women with highly dense breast tissue (P < .0001).
Conclusion
Fully automated estimates of breast density made from synthetic mammograms are generally comparable to those made from standard-dose mammograms. This may be important, as standard two-dimensional mammographic images are increasingly being replaced by synthetic mammograms in DBT screening in an attempt to reduce radiation dose.
© RSNA, 2017
Introduction
Digital breast tomosynthesis (DBT) is rapidly becoming the new standard of care in screening and diagnostic breast imaging because of improvements in both sensitivity and specificity (1–5). Thus far, most clinical DBT imaging has been in combination with digital mammography (DM) and is therefore associated with an increase in x-ray dose compared with imaging with DM alone (6,7). In May 2013, synthesized two-dimensional (2D) synthetic DM (sDM) was approved as an alternative to DM imaging in DBT screening. The “2Dlike”’ sDM images are reconstructed from the DBT acquisition, therefore reducing the x-ray dose received by the patient by up to 45% because no DM image is obtained (6,8). Preliminary results comparing sDM-DBT screening with DM-DBT screening have shown noninferior outcomes, prompting rapid implementation of this dose-reduction technology (6,9–12).
Breast density assessment has become increasingly important in screening because it is well known that increasing breast density limits both the sensitivity and the specificity of screening mammography (13). In addition, increasing breast density is known to be a strong independent risk factor for the development of breast cancers (14–16). Currently, more than 50% of U.S. states have enacted legislation mandating that women be notified of the implications of breast density, thereby encouraging discussion between health care providers and patients regarding the need for potential supplemental screening and risk assessment (17).
Currently, breast density is most often assessed by the breast imaging radiologist visually utilizing the DM portion of the DBT study. The patient is then assigned to one of the four breast density categories by using the American College of Radiology Breast Imaging Reporting and Data System (BI-RADS) (18). However, visual breast density estimates are subjective and fraught with significant intra- and interobserver variability (19–21). To overcome this limitation, fully automated software algorithms have been developed to generate reproducible quantitative measures of breast density (22–25), several of which have shown associations with both breast cancer masking and breast cancer risk (26–28).
Because sDM images have a somewhat different appearance (owing to differences in image processing) than DM images and because conventional DM images may no longer be available for automated density assessment in sDM-DBT imaging, it is important to understand the impact of sDM imaging on the assessment of breast density. The purpose of this study was to evaluate the agreement between automated estimates of breast density made from standard-dose DM and those made from sDM in a large cohort of women undergoing screening.
Materials and Methods
Study Population and Imaging Data
In this institutional review board–approved, Health Insurance Portability and Accountability Act–compliant study, and with a waiver of the need to obtain informed consent, we retrospectively analyzed 4 consecutive months (September 1, 2014, through December 31, 2014) of screening examinations at our institution. Specifically, these 4 months represented a transitional period for our site when all women undergoing breast cancer screening at our institution underwent both standard-dose DM and sDM, along with a DBT examination, as part of their routine screening. All screening examinations were performed with a Selenia Dimensions DBT unit (Hologic, Bedford, Mass), and all sDMs were generated by using the U.S. Food and Drug Administration–approved “C-View” software module by the same vendor. For the purposes of this study, we initially analyzed all screening examinations for which 2D bilateral mediolateral oblique (MLO) view sDM and standard-dose “For Presentation” DM images were available for analysis in a total of 3749 women. Of these 3749 women, 20 were excluded from this study for having a screening-detected malignant breast cancer, 57 for having breast implants, and four for whom reliable automated breast density assessments could not be obtained because of image quality that resulted in failed breast boundary or dense tissue segmentations (eg, poor breast boundary intensity or pectoral muscle delineation). This yielded a final study population of 3668 women with 7336 mammographic MLO-view images. All women included in this study had BI-RADS breast density assessed during their screening examination by the interpreting radiologist, during which both the sDM and DM images were available for review (BI-RADS 5th edition [18]). Demographic information regarding our study cohorts’ age, race, and BI-RADS breast density distributions is provided in the Table.
Demographic Characteristics of the Training and Testing Samples
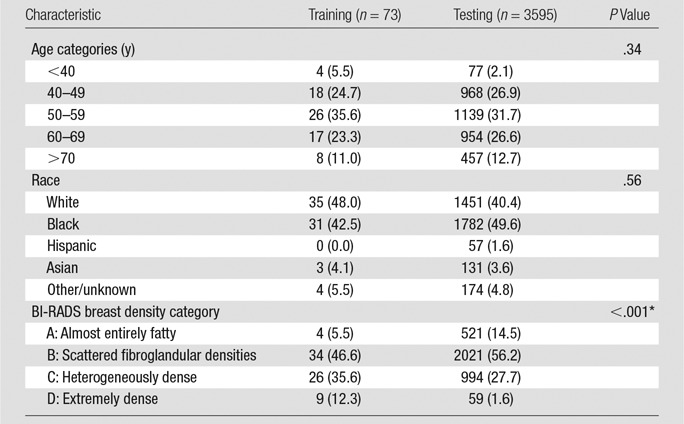
Note.—Data are numbers of cases, with percentages in parentheses.
*Note that differences in the distributions of breast density between the training and testing samples were purposefully introduced with enrichment of the training sample to ensure adequate representation of all four BI-RADS density categories in the training set for the algorithm, by using disproportionate stratified random sampling (see Materials and Methods section for details).
Automated Breast Density Assessment
For each woman included in this study, mammographic breast density was assessed in both DM and sDM by using a fully automated publicly available breast density estimation software, the Laboratory for Individualized Breast Radiodensity Assessment (LIBRA), which has been previously validated against radiologist estimates of breast density acquired by using the reference-standard Cumulus software (24). Its results have also been shown to have an association with breast cancer (26). The LIBRA software generates area-based measurements of breast area, dense tissue area, and percentage density (PD) from full-field DM images, and it has been previously shown to work equally well with both “For Processing” (ie, raw) and “For Presentation” (ie, processed) DM images (24,26,29,30). Briefly, the LIBRA algorithm first identifies and extracts the breast region and then segments the dense tissue within the breast by using a combination of fuzzy c-means clustering and support vector machine classification (24). From this dense tissue segmentation, absolute breast tissue area and absolute dense tissue area (both in square centimeters) are derived, and PD is obtained from the ratio of dense tissue area to breast tissue area. For the purposes of this study, we focused our analysis specifically on the evaluation of PD because it is the most widely validated quantitative estimate of breast density in terms of its association with breast cancer risk (15,31).
For the purpose of estimating breast density from sDM images, we extended the LIBRA algorithm to also have the capability to generate breast density estimates from sDM images. To accomplish this, we separated our study cohort into two distinct data sets: a training set of 73 randomly selected screening examinations (146 images), approximately 4% of our total cohort, and a second independent test set of the remaining 3595 examinations (7190 images). The size of our sample was based on prior work on the training of the LIBRA algorithm (24). In addition, to ensure that adequate numbers of cases across the different density categories were represented in our sample (especially cases with moderate-to-substantial dense tissue, where the algorithm needs to perform the most accurate segmentation), our sample was stratified so as to ensure at least 5% representation from all BI-RADS density categories, using as basis for this stratification the clinical assessment of BI-RADS density recorded in the patient’s radiology screening report (ie, disproportionate stratified random sampling). Utilizing the training data set, we retrained the support vector machine classifier of the LIBRA algorithm by the training paradigm described in the original LIBRA publication (24), where the ground-truth PD estimates used for training the algorithm to read sDM images were derived from the corresponding paired standard-dose DM images (see Appendix E1 [online] for details). This extended version of LIBRA was then used to generate dense tissue area and PD estimates for all sDM and DM images in the independent validation test set, to evaluate the agreement between the density estimates made at DM versus those made at sDM.
Statistical Analysis
To verify the consistency of the breast density estimates made by the software, between-breast correlations of absolute dense tissue area and PD density estimates were computed by using Pearson correlation. For all subsequent analyses, per-woman scores of absolute dense tissue area and PD were generated by averaging the corresponding density estimates made on each woman’s two MLO-view mammograms, as commonly done in prior studies (24,32–34). To determine the degree of agreement between breast density estimates made on DM versus sDM images, linear regression analysis was performed, and the Pearson product-moment correlation coefficient r was computed between the two image types on a per-woman basis. The paired Student t test was applied to determine the presence, if any, of a systematic difference in PD between estimates made on the two mammogram types. Bland-Altman analysis was also performed, and the 95% limits of agreement were computed. Finally, analysis of variance was performed to determine whether the automated PD estimates for both DM and sDM varied significantly according to the corresponding BI-RADS breast density categories as assessed clinically for the screening studies. The pairwise Student t test was further applied to determine differences in the means of DM versus sDM PD across the increasing BI-RADS density categories. All tests of statistical significance were at the standard α = .05 level, and statistical analyses were performed in Stata 13.1 (Stata, College Station, Tex).
Results
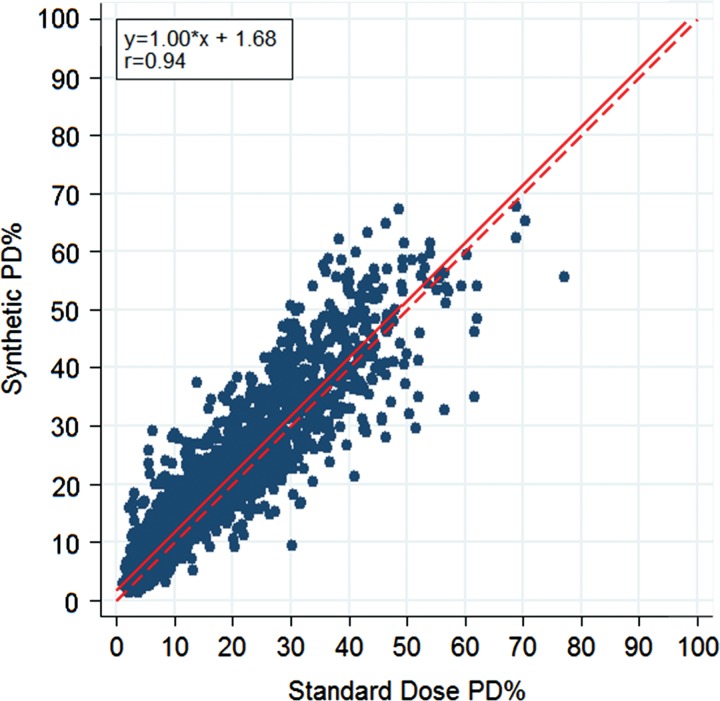
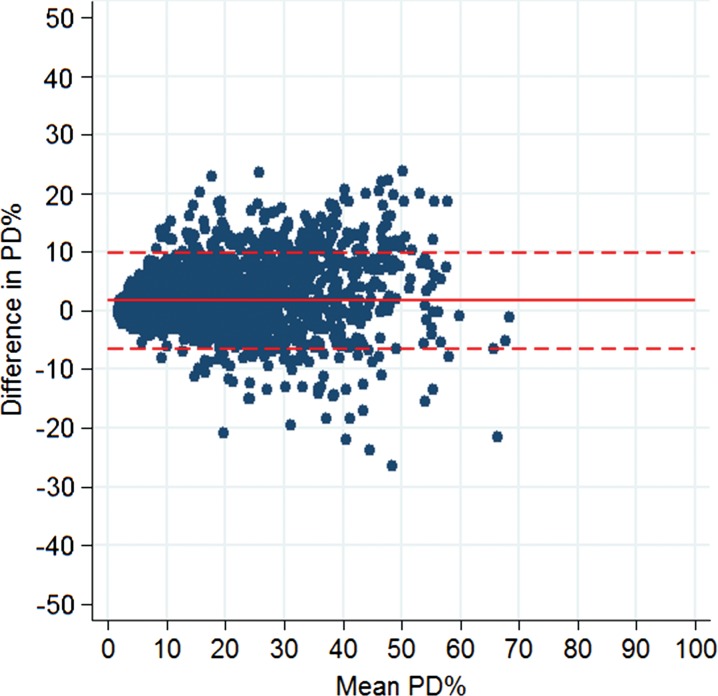
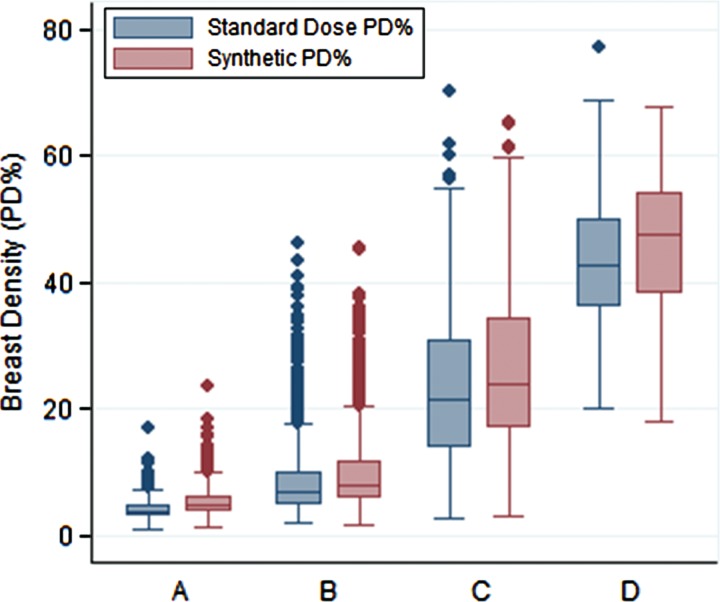
There was no significant difference in age and race between the training and test samples, but there was a difference in BI-RADS density owing to our sampling process (P values: .336, .556, <.001, respectively). For standard-dose DM images, left and right breast density measures were strongly correlated, both in terms of absolute dense area (r = 0.85, P < .001) and in terms of PD (r = 0.90, P < .001) (Fig 1). Left and right breast density estimates made on sDM images were also well correlated, although the strength of the correlations was somewhat attenuated relative to the standard-dose DM image estimates, both in terms of absolute dense area (r = 0.78, P < .001) and PD (r = 0.87, P < .001). When we evaluated the agreement between per-woman breast density estimates, DM and sDM PD estimates were very strongly correlated (r = 0.94, P < .001) (Fig 2), as were the absolute dense tissue area estimates (r = 0.89, P < .001) (Fig 3). However, sDM PD estimates were, on average, 1.7% higher than those made on DM images (P < .001), and absolute dense tissue area estimates were, on average, 2.0 cm2 higher on sDM images (P < .001). The Bland-Altman 95% limits of agreement were −6.4% to 9.9% (Fig 4) between the two automated PD estimates and were −9.0 to 13.0 cm2 between the absolute dense tissue area measures. Finally, both the absolute dense tissue area and PD estimates from both DM and sDM images were significantly different across the BI-RADS density categories clinically assigned to each woman (P < .001) (Fig 5). The observed PD differences were significant (P < .05) for all groups and were equal to 1.28% (95% confidence interval [CI]: 1.09, 1.48), 1.25% (95% CI: 1.12, 1.38), 2.81% (95% CI: 2.46, 3.17), and 2.86% (95% CI: 0.20, 5.53), for BI-RADS groups A, B, C, and D, respectively. When we combined the A-B and C-D groups, we found a difference of 1.56% (P < .0001) in their mean differences in PD, suggesting higher PD disagreement for the higher density groups.
Figure 1a:
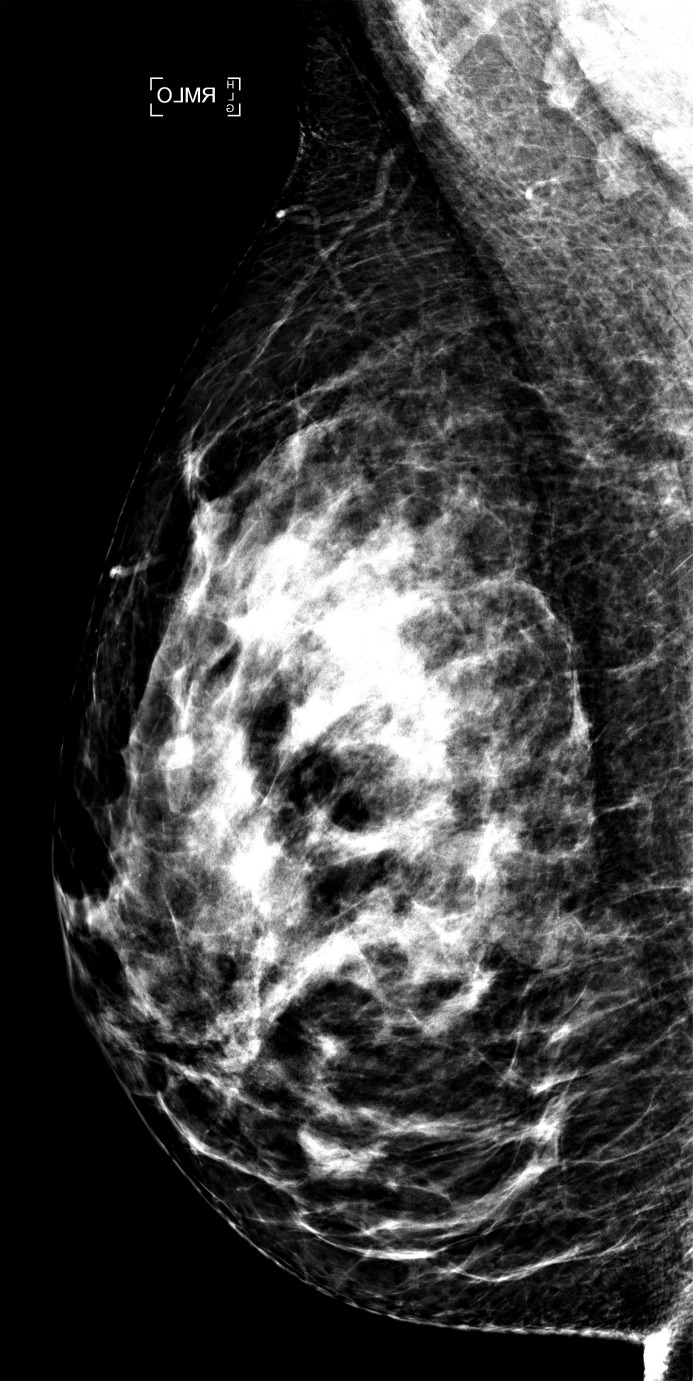
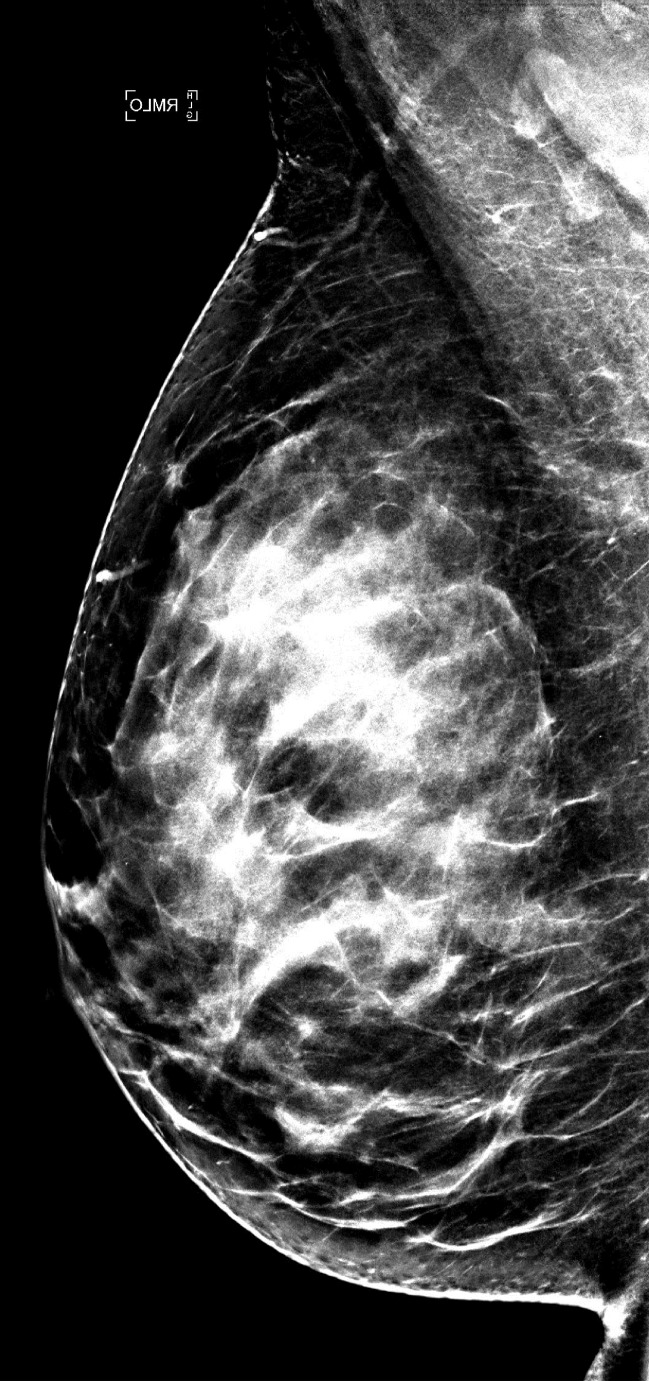
Examples of right MLO-view (a) standard-dose DM image and (b) sDM image in a 59-year-old white woman with heterogeneously dense breasts (BI-RADS density category C) show an overall similar dense-tissue appearance.
Figure 2:
Scatterplot shows the associations between PD estimates made on standard-dose DM images and those made on sDM images. Linear regression equation, Pearson correlation, regression line (solid line), and unity line (dashed line) are provided as reference.
Figure 3a:
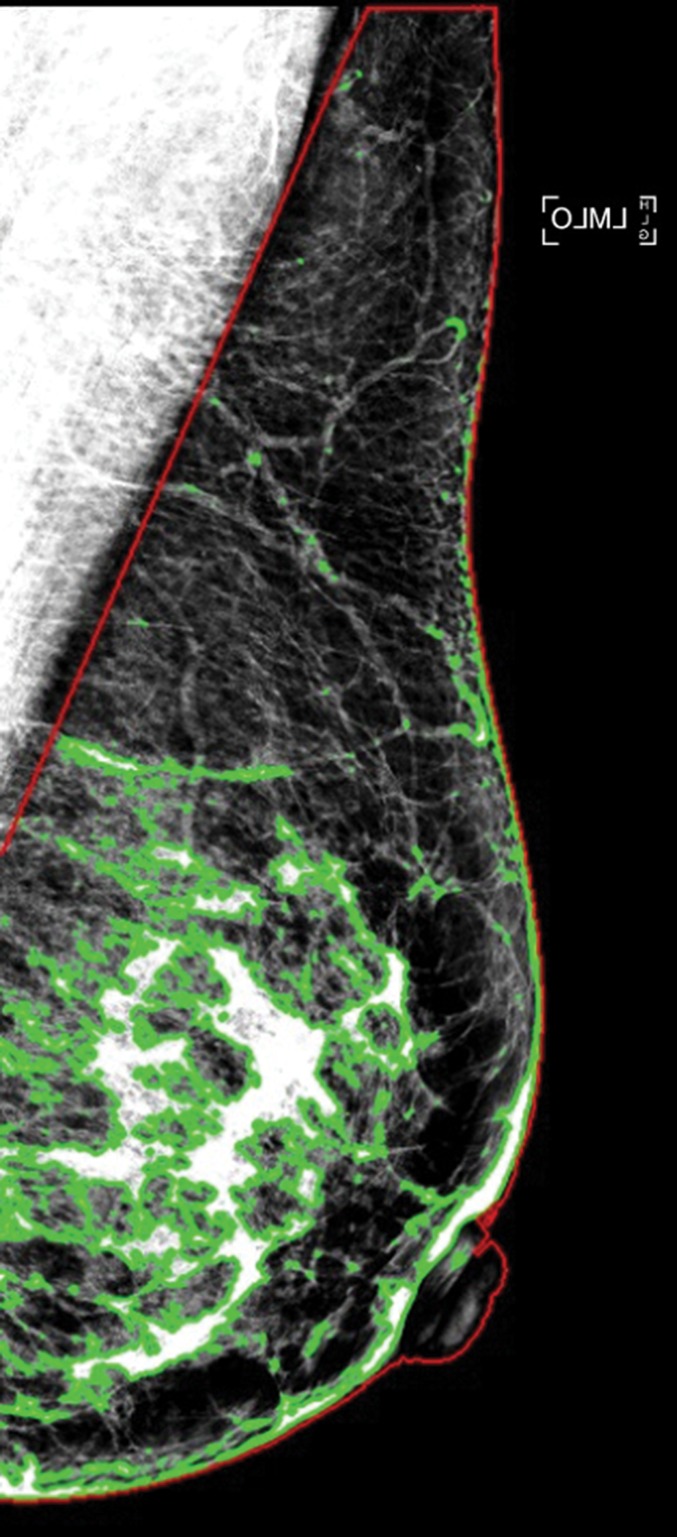
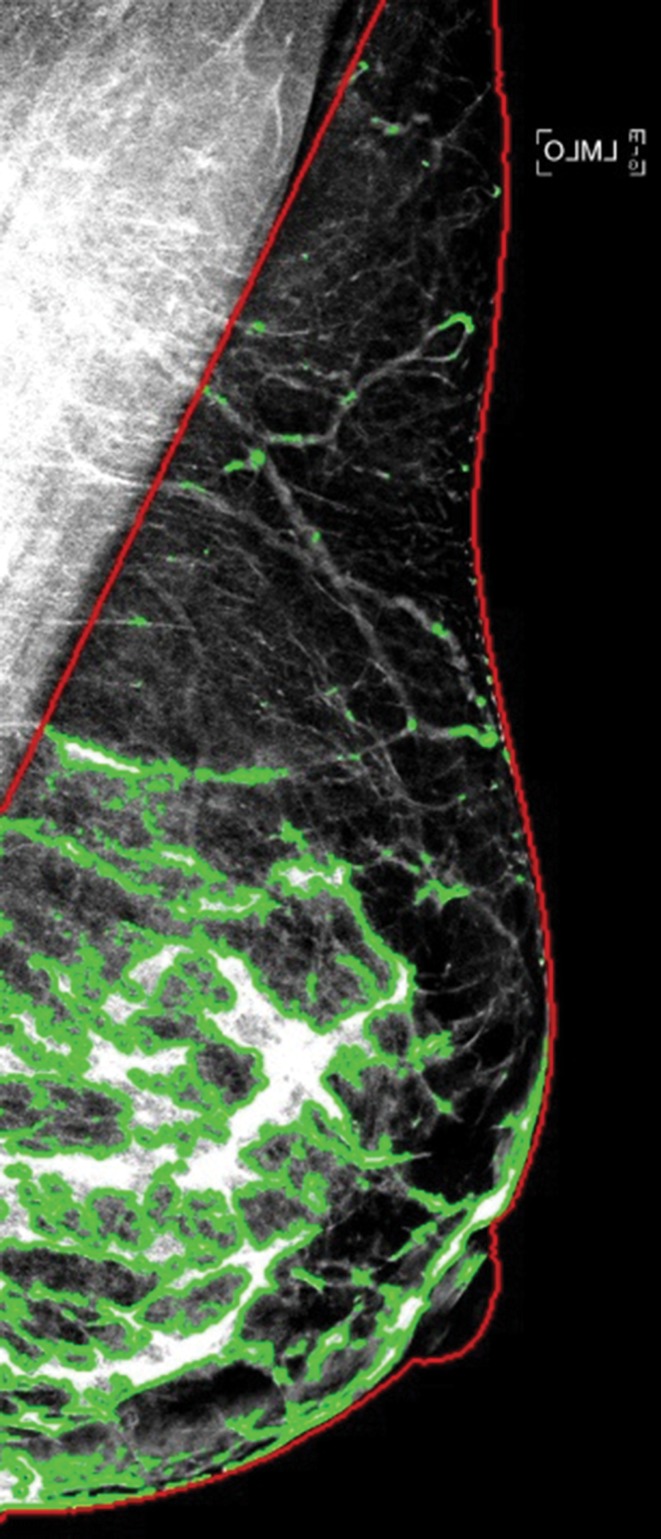
Examples of dense tissue segmentations on left MLO-view (a) standard-dose DM image and (b) sDM image in a 47-year-old woman with scattered fibroglandular densities (BI-RADS density category B), showing close agreement in the PD estimates made at standard-dose DM (PD: 18.2%) and those made at sDM (PD: 18.7%).
Figure 4:
Bland-Altman difference plot shows agreement between automated measurements of PD on standard-dose DM images and those on sDM images. Horizontal lines = mean difference (solid line) and 95% limits of agreement (dashed lines).
Figure 5:
Graph of distributions of PD estimates from sDM images versus those from standard-dose DM images shows significant associations with the BI-RADS density categories (A, B, C, and D) clinically assigned to each woman for both imaging formats (P < .001).
Figure 1b:
Examples of right MLO-view (a) standard-dose DM image and (b) sDM image in a 59-year-old white woman with heterogeneously dense breasts (BI-RADS density category C) show an overall similar dense-tissue appearance.
Figure 3b:
Examples of dense tissue segmentations on left MLO-view (a) standard-dose DM image and (b) sDM image in a 47-year-old woman with scattered fibroglandular densities (BI-RADS density category B), showing close agreement in the PD estimates made at standard-dose DM (PD: 18.2%) and those made at sDM (PD: 18.7%).
Discussion
We found that automated measures of breast density from sDM correlate well with those from standard 2D mammograms. Our work is timely, because the rapid implementation of sDM-DBT is occurring at the same time that breast density notification legislation has been passed in more than 50% of the United States, necessitating a reliable method of estimating density from synthetic images. The ability to reproducibly assess breast density independently of mammographic image type is important, as inconsistent breast density assessment could have implications for cancer risk assessment and also for whether it may be appropriate to pursue supplemental screening (21). We included a 4-month consecutive series of screening examinations for which every woman included had both sDM and standard-dose DM performed as part of their routine screening, providing a large sample to evaluate the consistency of breast density estimates between the two mammography image types and avoiding the biases inherent in a convenience sample.
Although the agreement between density estimates from DM versus sDM images has not yet been well evaluated, comparison of our results to prior work characterizing intra- and interreader agreement for breast density from standard-dose mammograms could serve as a useful reference for expected levels of agreement. For example, previous studies have shown that within-reader Bland-Altman 95% limits of agreement of PD on standard-dose images is between −11% and +7% (20,35) and that within-reader variability on a single MLO-view image can range upward to approximately ± 15% (36). The limits of agreement observed in our study of −6.4% to 9.9% between sDM and DM images are generally within this range, especially given that prior work has shown that between-reader variability in PD estimation is often much larger than within-reader variability, with Bland-Altman 95% limits of agreement ranging between −19% and 13% (20,37). In that context, the agreement observed between the sDM and DM PD estimates is acceptable, with limits of agreement approaching that of within-reader variability in most cases, and is better than interreader agreement in general. Ultimately, future studies will be needed to investigate the use of breast density estimates from synthetic mammograms in risk assessment and supplemental screening decision aids to fully assess the impact of the two image formats on clinical decision making.
Our study had limitations. First, we evaluated only a single area-based breast density estimation method by using data from a single institution. While area-based density is the most widely used type of density measure, future studies should also examine volume-based breast density measures (27), including three-dimensional measures developed for DBT (38). In addition, we evaluated this software using a single vendor. Further calibration of the automated algorithm may be needed to accurately estimate breast density from synthetic mammograms acquired by other vendors. Given the relatively good performance of the algorithm, and in consideration of the time required by our radiologist to perform the manual segmentation with Cumulus needed for validation, we also did not explore how different sampling strategies for the training set may affect the performance of LIBRA with the sDM data, which could be the subject of further optimization of the algorithm. We also did not assess how these measures perform in a risk-assessment setting, which will be the focus of future investigations. Last, this study evaluated only agreement between automated density measures; in our study, BI-RADS density was assessed by the interpreting radiologist after viewing both types of images, limiting our ability to assess reader agreement. Therefore, the agreement between BI-RADS density assessment and PD using semiautomated methods such as Cumulus remains to be investigated.
In conclusion, our study presents an evaluation of fully automated breast density assessment from synthetic mammograms using automated software in a large data set consisting of more than 3600 DBT screening examinations. The ability to obtain consistent breast density estimates from both sDM and standard-dose DM images should allow either image type to be used interchangeably for density assessment, which can be beneficial in settings where not all women may necessarily undergo standard-dose mammography, as well as in retrospective research-related studies.
Advances in Knowledge
■ Breast percentage density (PD) estimates from synthetic and standard-dose digital mammograms are strongly correlated (Pearson r = 0.92, P < .001).
■ While strongly correlated, synthetic mammograms yield slightly higher PD estimates compared with standard-dose mammaograms (average, 1.7%; paired Student t test P < .001). The difference in quantitative PD is greater at higher breast densities (average, 1.56%; P < .0001; when comparing high vs low Breast Imaging Reporting and Data System density groups).
Implication for Patient Care
■ Accurate quantitative measures of breast density that correlate highly with measures obtained from coregistered two-dimensional digital mammograms may be obtained from synthetic digital mammograms.
APPENDIX
Received June 6, 2016; revision requested July 18; revision received October 4; accepted October 31; final version accepted November 11.
Study supported by National Cancer Institute (1U24CA189523-01A1, 1U54CA163313-01, R01CA161749-01). E.S.M. is an American Roentgen Ray Society/Philips Healthcare Scholar.
Current address: Hologic, Newark, Del.
Disclosures of Conflicts of Interest: E.F.C. Activities related to the present article: received a grant from NCI; received personal fees for reader studies from Hologic and Siemens Healthcare. Activities not related to the present article: disclosed no relevant relationships. Other relationships: disclosed no relevant relationships. B.M.K. Activities related to the present article: disclosed no relevant relationships. Activities not related to the present article: became an employee of Hologic shortly before the submission of this manuscript to Radiology, but made contributions to this manuscript solely while employed by the University of Pennsylvania. Other relationships: disclosed no relevant relationships. L.P. disclosed no relevant relationships. A.G. disclosed no relevant relationships. E.S.M. disclosed no relevant relationships. D.K. disclosed no relevant relationships.
Abbreviations:
- BI-RADS
- Breast Imaging Reporting and Data System
- DBT
- digital breast tomosynthesis
- DM
- digital mammography
- LIBRA
- Laboratory for Individualized Breast Radiodensity Assessment
- MLO
- mediolateral oblique
- PD
- percentage density
- sDM
- synthetic DM
- 2D
- two-dimensional
References
- 1.Skaane P, Bandos AI, Gullien R, et al. Comparison of digital mammography alone and digital mammography plus tomosynthesis in a population-based screening program. Radiology 2013;267(1):47–56. [DOI] [PubMed] [Google Scholar]
- 2.Ciatto S, Houssami N, Bernardi D, et al. Integration of 3D digital mammography with tomosynthesis for population breast-cancer screening (STORM): a prospective comparison study. Lancet Oncol 2013;14(7):583–589. [DOI] [PubMed] [Google Scholar]
- 3.Friedewald SM, Rafferty EA, Rose SL, et al. Breast cancer screening using tomosynthesis in combination with digital mammography. JAMA 2014;311(24):2499–2507. [DOI] [PubMed] [Google Scholar]
- 4.McCarthy AM, Kontos D, Synnestvedt M, et al. Screening outcomes following implementation of digital breast tomosynthesis in a general-population screening program. J Natl Cancer Inst 2014;106(11):dju316. [DOI] [PMC free article] [PubMed] [Google Scholar]
- 5.Conant EF, Beaber EF, Sprague BL, et al. Breast cancer screening using tomosynthesis in combination with digital mammography compared to digital mammography alone: a cohort study within the PROSPR consortium. Breast Cancer Res Treat 2016;156(1):109–116. [DOI] [PMC free article] [PubMed] [Google Scholar]
- 6.Skaane P, Bandos AI, Eben EB, et al. Two-view digital breast tomosynthesis screening with synthetically reconstructed projection images: comparison with digital breast tomosynthesis with full-field digital mammographic images. Radiology 2014;271(3):655–663. [DOI] [PubMed] [Google Scholar]
- 7.Svahn TM, Houssami N, Sechopoulos I, Mattsson S. Review of radiation dose estimates in digital breast tomosynthesis relative to those in two-view full-field digital mammography. Breast 2015;24(2):93–99. [DOI] [PMC free article] [PubMed] [Google Scholar]
- 8.Barufaldi B, Zuckerman SP, Synnestvedt M, et al. Impact of 2D reconstructed mammograms on patient dose in the clinical practice of tomosynthesis [abstr]. In: Radiological Society of North America Scientific Assembly and Annual Meeting Program. Oak Brook, Ill: Radiological Society of North America, 2015; 223. [Google Scholar]
- 9.Zuley ML, Guo B, Catullo VJ, et al. Comparison of two-dimensional synthesized mammograms versus original digital mammograms alone and in combination with tomosynthesis images. Radiology 2014;271(3):664–671. [DOI] [PMC free article] [PubMed] [Google Scholar]
- 10.Gilbert FJ, Tucker L, Gillan MG, et al. Accuracy of digital breast tomosynthesis for depicting breast cancer subgroups in a UK retrospective reading study (TOMMY Trial). Radiology 2015;277(3):697–706. [DOI] [PubMed] [Google Scholar]
- 11.Zuckerman SP, Conant EF, Weinstein S, Korhonen K, Synnestvedt M, McDonald ES. Early implementation of synthesized 2D in screening with digital breast tomosynthesis: a pictorial essay of early outcomes [abstr]. In: Radiological Society of North America Scientific Assembly and Annual Meeting Program. Oak Brook, Ill: Radiological Society of North America, 2015; 220. [Google Scholar]
- 12.Zuckerman SP, Conant EF, Keller BM, et al. Implementation of synthesized two-dimensional mammography in a population-based digital breast tomosynthesis screening program. Radiology 2016;281(3):730–736. [DOI] [PMC free article] [PubMed] [Google Scholar]
- 13.Kerlikowske K, Zhu W, Tosteson AN, et al. Identifying women with dense breasts at high risk for interval cancer: a cohort study. Ann Intern Med 2015;162(10):673–681. [DOI] [PMC free article] [PubMed] [Google Scholar]
- 14.Harvey JA, Yaffe MJ, D’Orsi C, Sickles EA. Density and breast cancer risk. Radiology 2013;267(2):657–658. [DOI] [PubMed] [Google Scholar]
- 15.Ng KH, Lau S. Vision 20/20: Mammographic breast density and its clinical applications. Med Phys 2015;42(12):7059–7077. [DOI] [PubMed] [Google Scholar]
- 16.Boyd NF, Martin LJ, Bronskill M, Yaffe MJ, Duric N, Minkin S. Breast tissue composition and susceptibility to breast cancer. J Natl Cancer Inst 2010;102(16):1224–1237. [DOI] [PMC free article] [PubMed] [Google Scholar]
- 17.Slanetz PJ, Freer PE, Birdwell RL. Breast-density legislation–practical considerations. N Engl J Med 2015;372(7):593–595. [DOI] [PubMed] [Google Scholar]
- 18.Sickles EA, D’Orsi CJ, Bassett LW, et al. ACR BI-RADS Mammography. In: ACR BI-RADS Atlas, Breast Imaging Reporting and Data System. Reston, Va: American College of Radiology, 2013. [Google Scholar]
- 19.Redondo A, Comas M, Macià F, et al. Inter- and intraradiologist variability in the BI-RADS assessment and breast density categories for screening mammograms. Br J Radiol 2012;85(1019):1465–1470. [DOI] [PMC free article] [PubMed] [Google Scholar]
- 20.Keller BM, Nathan DL, Gavenonis SC, Chen J, Conant EF, Kontos D. Reader variability in breast density estimation from full-field digital mammograms: the effect of image postprocessing on relative and absolute measures. Acad Radiol 2013;20(5):560–568. [DOI] [PMC free article] [PubMed] [Google Scholar]
- 21.Sprague BL, Conant EF, Onega T, et al. Variation in mammographic breast density assessments among radiologists in clinical practice: a multicenter observational study. Ann Intern Med 2016;165(7):457–464. [DOI] [PMC free article] [PubMed] [Google Scholar]
- 22.Highnam R, Brady M, Yaffe MJ, Karssemeijer N, Harvey J. Robust breast composition measurement-VolparaTM. In: Martí J, Oliver A, Freixenet J, Martí R, eds. Digital mammography. Berlin, Germany: Springer, 2010; 342–349. [Google Scholar]
- 23.Heine JJ, Carston MJ, Scott CG, et al. An automated approach for estimation of breast density. Cancer Epidemiol Biomarkers Prev 2008;17(11):3090–3097. [DOI] [PMC free article] [PubMed] [Google Scholar]
- 24.Keller BM, Nathan DL, Wang Y, et al. Estimation of breast percent density in raw and processed full field digital mammography images via adaptive fuzzy c-means clustering and support vector machine segmentation. Med Phys 2012;39(8):4903–4917. [DOI] [PMC free article] [PubMed] [Google Scholar]
- 25.Byng JW, Boyd NF, Fishell E, Jong RA, Yaffe MJ. The quantitative analysis of mammographic densities. Phys Med Biol 1994;39(10):1629–1638. [DOI] [PubMed] [Google Scholar]
- 26.Keller BM, Chen J, Daye D, Conant EF, Kontos D. Preliminary evaluation of the publicly available Laboratory for Breast Radiodensity Assessment (LIBRA) software tool: comparison of fully automated area and volumetric density measures in a case-control study with digital mammography. Breast Cancer Res 2015;17(1):117. [DOI] [PMC free article] [PubMed] [Google Scholar]
- 27.Brandt KR, Scott CG, Ma L, et al. Comparison of clinical and automated breast density measurements: implications for risk prediction and supplemental screening. Radiology 2016;279(3):710–719. [DOI] [PMC free article] [PubMed] [Google Scholar]
- 28.Heine JJ, Scott CG, Sellers TA, et al. A novel automated mammographic density measure and breast cancer risk. J Natl Cancer Inst 2012;104(13):1028–1037. [DOI] [PMC free article] [PubMed] [Google Scholar]
- 29.McCarthy AM, Keller BM, Pantalone LM, et al. Racial differences in quantitative measures of area and volumetric breast density. J Natl Cancer Inst 2016;108(10):djw104. [DOI] [PMC free article] [PubMed] [Google Scholar]
- 30.Daye D, Keller B, Conant EF, et al. Mammographic parenchymal patterns as an imaging marker of endogenous hormonal exposure: a preliminary study in a high-risk population. Acad Radiol 2013;20(5):635–646. [DOI] [PMC free article] [PubMed] [Google Scholar]
- 31.Eng A, Gallant Z, Shepherd J, et al. Digital mammographic density and breast cancer risk: a case-control study of six alternative density assessment methods. Breast Cancer Res 2014;16(5):439. [DOI] [PMC free article] [PubMed] [Google Scholar]
- 32.Sovio U, Li J, Aitken Z, et al. Comparison of fully and semi-automated area-based methods for measuring mammographic density and predicting breast cancer risk. Br J Cancer 2014;110(7):1908–1916. [DOI] [PMC free article] [PubMed] [Google Scholar]
- 33.Couwenberg AM, Verkooijen HM, Li J, et al. Assessment of a fully automated, high-throughput mammographic density measurement tool for use with processed digital mammograms. Cancer Causes Control 2014;25(8):1037–1043. [DOI] [PubMed] [Google Scholar]
- 34.Busana MC, De Stavola BL, Sovio U, et al. Assessing within-woman changes in mammographic density: a comparison of fully versus semi-automated area-based approaches. Cancer Causes Control 2016;27(4):481–491. [DOI] [PubMed] [Google Scholar]
- 35.Sohn G, Lee JW, Park SW, et al. Reliability of the percent density in digital mammography with a semi-automated thresholding method. J Breast Cancer 2014;17(2):174–179. [DOI] [PMC free article] [PubMed] [Google Scholar]
- 36.Lobbes MB, Cleutjens JP, Lima Passos V, et al. Density is in the eye of the beholder: visual versus semi-automated assessment of breast density on standard mammograms. Insights Imaging 2012;3(1):91–99. [DOI] [PMC free article] [PubMed] [Google Scholar]
- 37.Winkel RR, von Euler-Chelpin M, Nielsen M, et al. Inter-observer agreement according to three methods of evaluating mammographic density and parenchymal pattern in a case control study: impact on relative risk of breast cancer. BMC Cancer 2015;15(1):274. [DOI] [PMC free article] [PubMed] [Google Scholar]
- 38.Pertuz S, McDonald ES, Weinstein SP, Conant EF, Kontos D. Fully automated quantitative estimation of volumetric breast density from digital breast tomosynthesis images: preliminary results and comparison with digital mammography and MR imaging. Radiology 2016;279(1):65–74. [DOI] [PMC free article] [PubMed] [Google Scholar]
Associated Data
This section collects any data citations, data availability statements, or supplementary materials included in this article.


