This study demonstrates the feasibility of MR fingerprinting in the characterization of prostate disease and indicates that MR fingerprinting–derived T1 and T2 with standard apparent diffusion coefficient can help differentiate peripheral zone cancer from normal prostate tissue and has the potential to help separate high- or intermediate-grade tumors from low-grade malignancy.
Abstract
Purpose
To develop and evaluate an examination consisting of magnetic resonance (MR) fingerprinting–based T1, T2, and standard apparent diffusion coefficient (ADC) mapping for multiparametric characterization of prostate disease.
Materials and Methods
This institutional review board–approved, HIPAA-compliant retrospective study of prospectively collected data included 140 patients suspected of having prostate cancer. T1 and T2 mapping was performed with fast imaging with steady-state precession–based MR fingerprinting with ADC mapping. Regions of interest were drawn by two independent readers in peripheral zone lesions and normal-appearing peripheral zone (NPZ) tissue identified on clinical images. T1, T2, and ADC were recorded for each region. Histopathologic correlation was based on systematic transrectal biopsy or cognitively targeted biopsy results, if available. Generalized estimating equations logistic regression was used to assess T1, T2, and ADC in the differentiation of (a) cancer versus NPZ, (b) cancer versus prostatitis, (c) prostatitis versus NPZ, and (d) high- or intermediate-grade tumors versus low-grade tumors. Analysis was performed for all lesions and repeated in a targeted biopsy subset. Discriminating ability was evaluated by using the area under the receiver operating characteristic curve (AUC).
Results
In this study, 109 lesions were analyzed, including 39 with cognitively targeted sampling. T1, T2, and ADC from cancer (mean, 1628 msec ± 344, 73 msec ± 27, and 0.773 × 10⁻³ mm2/sec ± 0.331, respectively) were significantly lower than those from NPZ (mean, 2247 msec ± 450, 169 msec ± 61, and 1.711 × 10⁻³ mm2/sec ± 0.269) (P < .0001 for each) and together produced the best separation between these groups (AUC = 0.99). ADC and T2 together produced the highest AUC of 0.83 for separating high- or intermediate-grade tumors from low-grade cancers. T1, T2, and ADC in prostatitis (mean, 1707 msec ± 377, 79 msec ± 37, and 0.911 × 10⁻³ mm2/sec ± 0.239) were significantly lower than those in NPZ (P < .0005 for each). Interreader agreement was excellent, with an intraclass correlation coefficient greater than 0.75 for both T1 and T2 measurements.
Conclusion
This study describes the development of a rapid MR fingerprinting– and diffusion-based examination for quantitative characterization of prostatic tissue.
© RSNA, 2017
Introduction
Magnetic resonance (MR) imaging is an important tool for the diagnosis of prostate cancer, with a potential for noninvasively separating tumor grade, that is, Gleason score (1–4). Diffusion-weighted imaging and T2-weighted imaging form the basis of qualitative tissue characterization in the clinical setting, with a relatively minor role for T1-weighted imaging, which currently has application mainly in contrast material–enhanced imaging of the prostate. Several studies have demonstrated the utility of apparent diffusion coefficient (ADC) and T2 mapping in the quantitative evaluation of prostate cancer (2,5–9). Currently, ADC mapping is the most widely used quantitative property in the imaging-based diagnosis and characterization of prostate disease.
MR fingerprinting is a recently developed technique that allows rapid, simultaneous generation of quantitative maps of multiple physical properties (10,11). In MR fingerprinting, the user-set acquisition parameters such as the repetition time and flip angle are allowed to vary in a pseudorandom manner. With use of these known settings and assuming a wide range of possible T1 and T2 values, a dictionary of all possible signal evolution time courses is generated for the acquisition sequence by means of Bloch simulations. The closest dictionary match for the signal time course from each pixel is identified, and the T1 and T2 values used to construct the matched dictionary entry are assigned as the T1 and T2 for that pixel. This technologic development has provided an opportunity for rapid, simultaneous T1 and T2 mapping in human tissues (12). On the basis of previous quantitative studies in prostate imaging, we hypothesized that three metrics (MR fingerprinting–generated T1 and T2 maps in combination with standard ADC maps) can be used together for the quantitative characterization of prostate tissue. The purpose of this study was to develop and evaluate an examination consisting of MR fingerprinting–based T1, T2, and standard ADC mapping for the multiparametric characterization of prostate disease.
Materials and Methods
Industry Support
Five authors (C.B., S.P., Y.J., V.G., and M.A.G.) receive research support from Siemens Healthineers (Erlangen, Germany). None of the remaining authors had a conflict of interest.
Subjects
This retrospective study of prospectively collected data was approved by the institutional review board and compliant with the Health Insurance Portability and Accountability Act. Informed written consent was obtained from all participants. Subjects were included if there was clinical indication for prostate MR imaging for diagnosis or surveillance. Exclusion criteria included contraindications to 3.0-T MR imaging, history of pelvic radiation, systemic chemotherapy, hormonal therapy for cancer, or prostate surgery. Two approaches were used for patient recruitment, and the patients recruited with these approaches were classified as group 1 and group 2.
Group 1 included patients who underwent MR imaging for suspicion of prostate cancer and had undergone systematic 12-core transrectal ultrasonography (US)–guided biopsy before or after MR imaging. Patients were recruited from February 2014 to January 2015. These patients provided consent for an additional MR fingerprinting examination at the time of their clinical MR examination.
Group 2 consisted of biopsy-naive patients with a clinical suspicion of prostate cancer. Patients were recruited from September 2014 to April 2016. These patients were recruited for the study during prebiopsy urology consultation and provided consent for a limited noncontrast MR examination, including MR fingerprinting. These patients subsequently underwent systematic 12-core transrectal US biopsy, with additional cognitively targeted sampling if focal lesions were seen at prebiopsy MR imaging.
A total of 140 patients (age range, 42–89 years) underwent imaging, including 68 patients from group 1 (mean age, 66 years; age range 47–87 years) and 72 biopsy-naive men from group 2 (mean age, 61 years; age range, 42–79 years). In group 1 patients with a history of biopsy before MR imaging (n = 47), the time since biopsy ranged from 1 week to more than 10 years (mean, 24 months ± 33; median, 12 months).
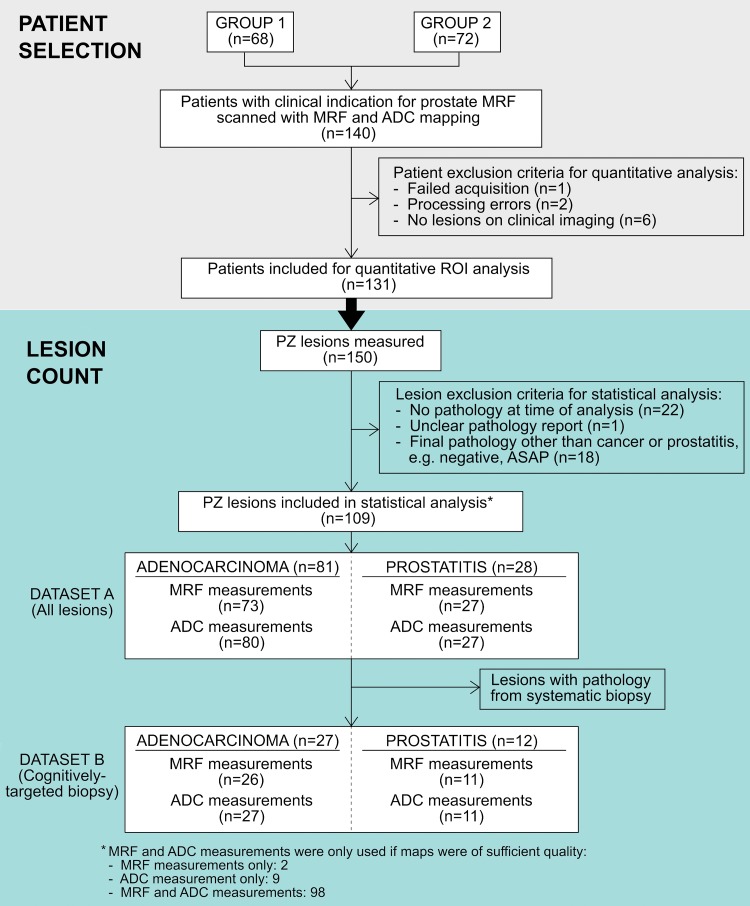
After undergoing MR imaging, the following subsets of patients were excluded from region of interest (ROI) analysis: Patients without peripheral zone lesions at clinical imaging (n = 6), patients in whom acquisition of MR fingerprinting data failed (n = 1), or patients with processing errors in MR fingerprinting data (n = 2). Specific lesions were excluded if there were no biopsy results at the time of analysis (n = 22), if there was an unclear pathology report (n = 1), or if there was a final pathologic diagnosis other than cancer or prostatitis (n = 18) (Fig 1). Statistical analysis was performed on the ROI measurements from peripheral zone lesions with histologic diagnosis of prostate cancer or prostatitis.
Figure 1:
Flow diagram of patient and lesion selection. ASAP = atypical small acinar proliferation, MRF = MR fingerprinting, PZ = peripheral zone.
Image Acquisition and Processing
All patients underwent imaging with a 3.0-T unit (Verio or Skyra; Siemens Healthineers). MR fingerprinting with fast imaging with steady-state precession (11) and ADC mapping with clinical standard diffusion-weighted echo-planar acquisitions were performed for patients in groups 1 and 2, with acquisition parameters and sequence durations detailed in Tables 1 and 2, respectively. The average acquisition time for the quantitative sequences of the examination totaled 12 minutes (7.5 minutes for MR fingerprinting and 4.5 minutes for ADC). The acquisition time for clinical standard sequences at our institution was 21 minutes (7.5 minutes for T2-weighted sequences, 9 minutes for T1-weighted sequences with dynamic contrast-enhanced perfusion, and 4.5 minutes for ADC). The highest b values used for ADC examinations were different between groups 1 and 2 owing to institutional adoption of Prostate Imaging Reporting and Data System (PI-RADS) version 2 recommendations at the time data collection for group 2 was initiated (13). For MR fingerprinting data processing, a dictionary containing expected MR fingerprinting signals was calculated with a T1 of 20–3000 msec and a T2 of 9–245 msec. Quantitative T1 and T2 maps were generated from raw MR fingerprinting data by using software (Matlab 2013a; MathWorks, Natick, Mass) as previously described (10,11) (Fig 2).
Table 1.
Imaging Parameters for Group 1
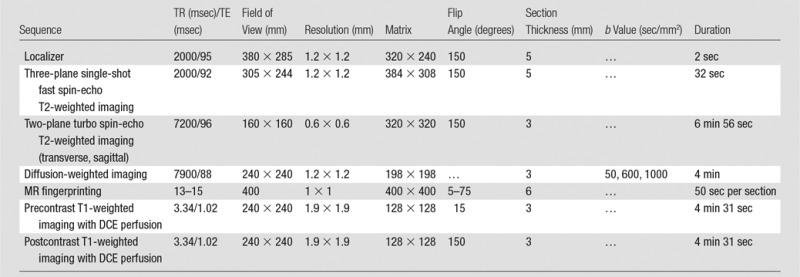
Note.—DCE = dynamic contrast-enhanced, TE = echo time, TR = repetition time.
Table 2.
Imaging Parameters for Group 2

*TE = echo time, TR = repetition time.
Figure 2a:
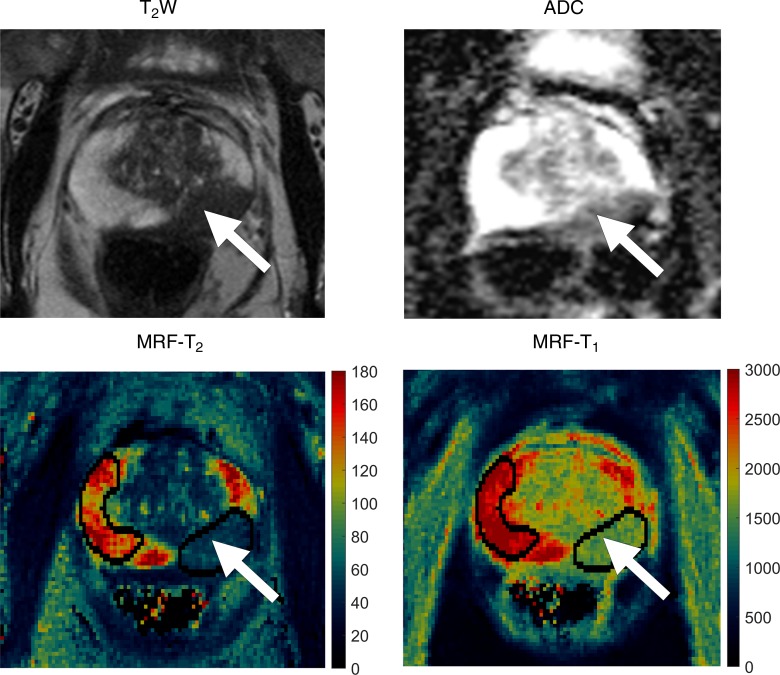
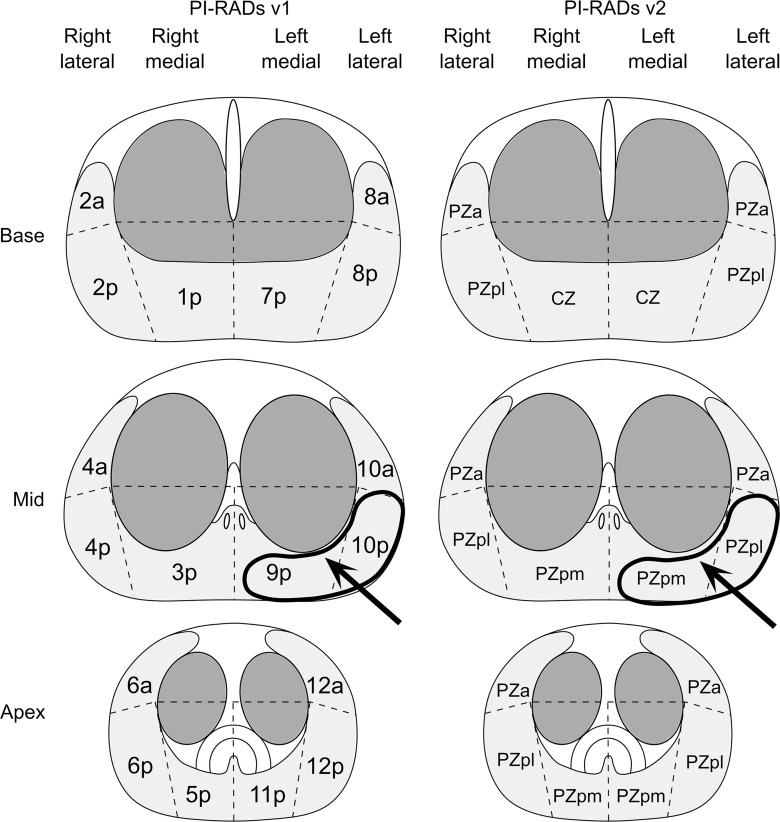
Images in 72-year-old man referred for elevated prostate-specific antigen level of 9.87 ng/mL with minimal urinary symptoms. Patient underwent limited MR imaging and targeted biopsy of lesion in left mid prostate. Prostate adenocarcinoma with Gleason score 4+3 = 7 was diagnosed at cognitively targeted biopsy. (a) T2-weighted image, ADC map, MR fingerprinting (MRF)–T2 map, and MR fingerprinting–T1 map show corresponding hypointense lesion in left mid prostate (arrow) and NPZ in right hemiprostate. (b) Sector maps with PI-RADS. Although this patient underwent cognitively targeted biopsy, if only systematic biopsy cores were available this lesion would correspond to 9p–10p with PI-RADS version 1 and left mid PZpm–PZpl with PI-RADS version 2 and correlate to left mid medial to lateral prostate cores. a = anterior, CZ = central zone, p = posterior, pl = posterior lateral, pm = posterior medial, PZ = posterior zone.
Clinical Interpretation and Quantitative ROI Analysis
Clinical interpretation of conventional MR images was performed by using PI-RADS version 1 in patients recruited into group 1. For group 1 patients, all lesions were identified on the basis of the image interpretation and scores available in the clinical MR imaging reports. For patients recruited into group 2, PI-RADS version 2 was used owing to updated recommendations at the beginning of group 2 recruitment (13,14). All lesions from group 2 were identified and scored by one fellowship-trained body radiologist (V.G., with 15 years of radiology experience). On the basis of the clinical reads, another radiologist (reader 1, C.B., a fellowship-trained radiologist with 8 years of experience), who was blinded to the final pathologic diagnosis, drew ROIs on MR fingerprinting–based T2 maps for both groups (a) in peripheral zone lesions identified on clinical MR images and (b) in normal-appearing peripheral zone (NPZ) (Fig 2a). The minimum ROI size was specified as 4 mm2. ROI sizes ranged from 7 to 174 mm2 (median, 26 mm2). The mean T1 and T2 from each ROI was recorded. Similarly, reader 1 redrew the ROIs to obtain ADC measurements in the corresponding regions. The reader took care to best replicate the location, shape, and size of the analogous ROI drawn on MR fingerprinting maps. Thus, for each lesion and each NPZ of the prostate, average T1, T2, and ADC values were recorded.
Another radiologist (reader 2, S.P., with 7 years of radiology experience), who was blinded to the histopathologic findings, redrew all ROIs on the same T1, T2, and ADC maps for the evaluation of interreader correlation of quantitative measurements. These measurements were not included in the analysis for lesion characterization.
The final histopathologic diagnosis was made by correlating the lesion locations on clinical images with the location descriptions on the standard 12-core biopsy reports or with the cognitively targeted core pathology reports when available (Fig 2b). Histopathologic correlation was performed by C.B. and V.G.. The tumor grade for each lesion (Gleason score) was also documented.
Figure 2b:
Images in 72-year-old man referred for elevated prostate-specific antigen level of 9.87 ng/mL with minimal urinary symptoms. Patient underwent limited MR imaging and targeted biopsy of lesion in left mid prostate. Prostate adenocarcinoma with Gleason score 4+3 = 7 was diagnosed at cognitively targeted biopsy. (a) T2-weighted image, ADC map, MR fingerprinting (MRF)–T2 map, and MR fingerprinting–T1 map show corresponding hypointense lesion in left mid prostate (arrow) and NPZ in right hemiprostate. (b) Sector maps with PI-RADS. Although this patient underwent cognitively targeted biopsy, if only systematic biopsy cores were available this lesion would correspond to 9p–10p with PI-RADS version 1 and left mid PZpm–PZpl with PI-RADS version 2 and correlate to left mid medial to lateral prostate cores. a = anterior, CZ = central zone, p = posterior, pl = posterior lateral, pm = posterior medial, PZ = posterior zone.
Statistical Analysis
All measurements of discernable NPZ as well as peripheral zone lesions proved at biopsy to be prostate cancer or prostatitis were included for analysis. The statistical analysis described below was performed in all lesions from all patients from recruitment groups 1 and 2. This statistical set was labeled as dataset A (81 adenocarcinomas, 28 prostatitis lesions). A similar analysis was replicated in the subset of lesions from dataset A that were diagnosed with cognitively targeted biopsy; this subset was labeled as dataset B (27 adenocarcinomas, 12 prostatitis lesions). Of note, lesions identified in group 2 patients who underwent cognitively targeted biopsy but which were diagnosed from positive systematic cores with negative cognitively targeted cores were included in dataset A only. The data were analyzed in two sets, A and B, to explore whether the cognitively targeted subset (dataset B) gave similar results as the overall dataset (dataset A).
Means of T1, T2, and ADC were compared between tissue types by using linear mixed models. Generalized estimating equations logistic regression analysis was used to assess the potential utility of MR fingerprinting–derived T1, T2, and ADC in the differentiation of (a) cancer versus NPZ, (b) cancer versus prostatitis, (c) prostatitis versus NPZ, and (d) high- and intermediate-grade tumors versus low-grade tumors. High grade was defined as a Gleason score of at least 4+4 = 8; intermediate grade included a Gleason score of 3+4 = 7 and 4+3 = 7; and low grade was defined as a Gleason score of 3+3 = 6. For the purpose of analysis, high- and intermediate-grade tumors (ie, Gleason score of 3+4 = 7 and higher) were grouped together because of similar clinical management; low-grade cancers, however, are commonly followed up with surveillance. For comparison of parameters between prostate abnormalities, when both groups included at least 15 measurements, both univariable and multivariable models including all combinations of T1, T2, and ADC measurements were evaluated. Otherwise, only univariable models were evaluated as the sample sizes were considered insufficient for reliable multivariable analysis. Receiver operating characteristic curves and areas under the receiver operating characteristic curve (AUC) (C-statistics) were obtained from ordinary logistic regressions by using the linear predictors obtained from the generalized estimating equations regressions.
Interreader reliability was examined by using paired t tests, Pearson correlation coefficients, and intraclass correlation coefficients. Pearson correlation coefficients were interpreted according to the method used by Evans (15), and intraclass correlation coefficients were interpreted according to the method used by Shrout and Fleiss (16). P < .05 was considered indicative of a statistically significant difference. All statistical analyses were performed by using software (SAS 9.4; SAS Institute, Cary, NC).
Results
In the 131 patients included for ROI analysis, NPZ was measured in 120 patients with MR fingerprinting (T1 and T2) and in 123 patients with ADC maps; NPZ measurements were not obtained in the remaining patients owing to unrecognizable NPZ, lack of NPZ due to tumor infiltration, image artifacts on MR fingerprinting–derived T1 and T2 maps and/or ADC maps, or missing data. Figure 1 is a flow diagram of all patient and lesion inclusion and exclusion criteria.
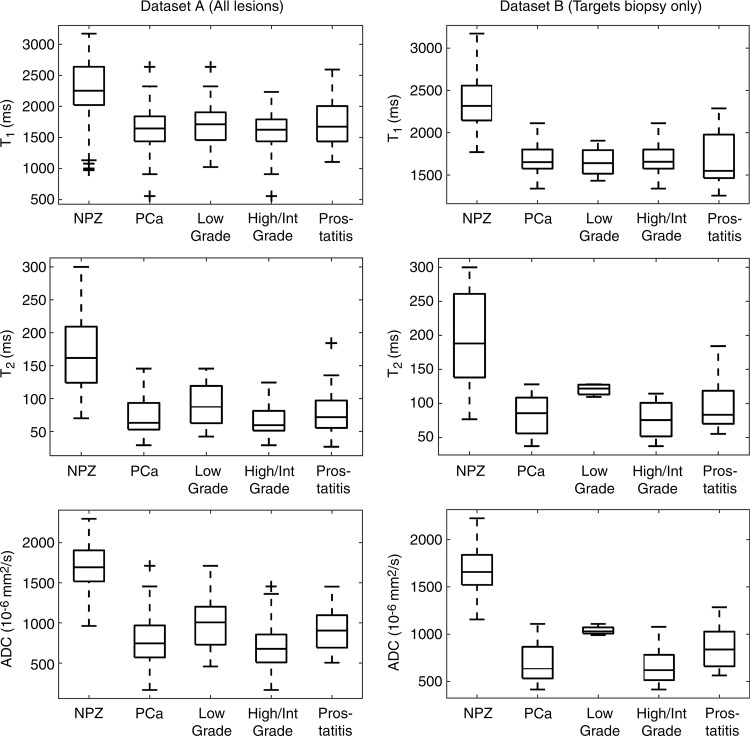
Histologically proved peripheral zone adenocarcinoma of the prostate was identified in 55 patients (81 lesions total), and histologic evidence of prostatitis was documented in 22 patients (28 lesions total). MR fingerprinting measurements were obtained in 73 cancers and 27 prostatitis lesions, and ADC measurements were obtained in 80 cancers and 27 prostatitis lesions (Fig 1). MR fingerprinting or ADC measurements were not attempted when there were artifacts on MR fingerprinting–derived T1 and T2 maps and/or ADC maps or poor correlation of section positioning between quantitative maps and clinical sections owing to differences in section thickness between MR fingerprinting and high-spatial-resolution MR imaging acquisitions. T1, T2, and ADC measurements in NPZ, histologically proved prostate cancer, prostatitis, and low-, intermediate-, and high-grade prostate cancer are presented as boxplots for each histologic type for datasets A and B separately (Fig 3, Table E1 [online]). PI-RADS scores for each histologic type for dataset B are presented in Table E2 (online).
Figure 3:
Box plots of T1, T2, and ADC measurements according to histologic subtype. Boxes represent 25th–75th percentiles; lines within represent median. Error bars extend from minimum to maximum of each distribution. + = outliers. For details on datasets used for each box plot, see Table E1 (online).
Prostate Cancer versus NPZ
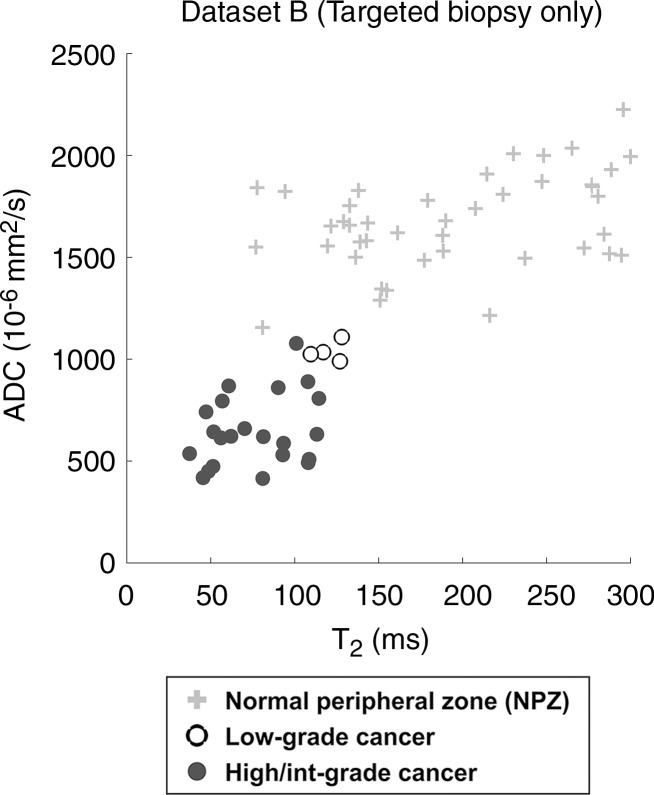
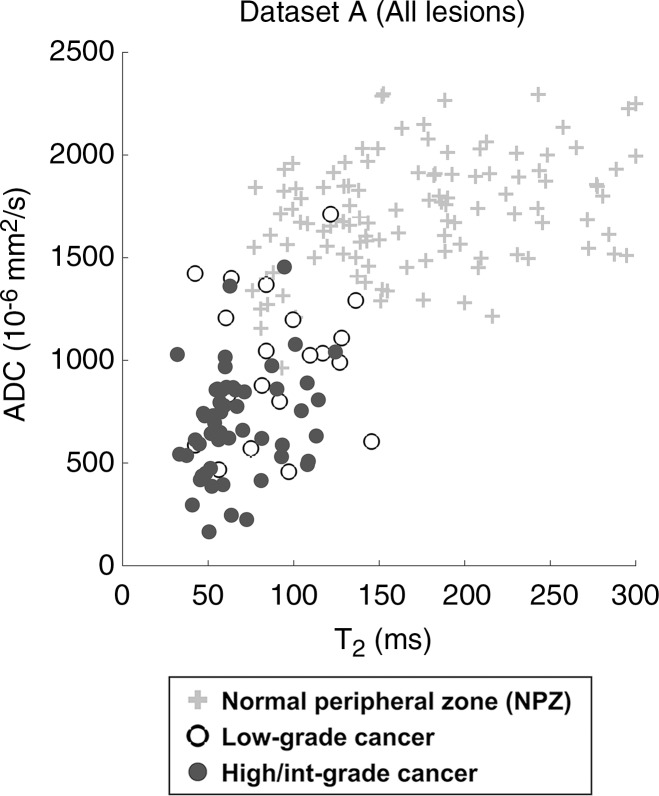
In the analysis of all lesions (dataset A), T1, T2, and ADC measurements were significant univariate predictors in the differentiation between histologically proved cancer and NPZ (P < .0001 for all parameters). T1, T2, and ADC were all significant independent predictors in a multivariable logistic model in the differentiation between prostate cancer and NPZ, where the estimated AUC for this model was 0.99 (Table 3). In the subset of lesions for which targeted biopsy was performed (dataset B), T1,, T2, and ADC differed significantly between prostate cancer and NPZ, and there was complete separation between groups with use of ADC alone (Fig 4b).
Table 3.
Differentiation of Histologic Findings with T1, T2, and ADC

Note.—Dataset A = all lesions, dataset B = cognitively targeted biopsy lesions. PCa = prostate cancer.
*AUC obtained by using a single variable and P value from univariable generalized estimating equation logistic regression. Numbers in parentheses are 95% confidence intervals. Number in brackets are P values.
†The highest AUC is for the generalized estimating equation logistic regression model with the highest AUC, where all variables included in the model were statistically significant (P < .05). Numbers in parentheses are the 95% confidence intervals. Variables in model are given in brackets.
‡Logistic regression could not be fit because of nonoverlapping distributions.
§The high-grade group includes high- and intermediate-grade lesions (Gleason score ≥7). Low-grade lesions had a Gleason score of 6.
||Sample sizes were too small to allow fitting the generalized estimating equation logistic regressions.
Figure 4b:
Scatterplots of ADC versus T2 in NPZ and histologically proved low-grade or high- or intermediate (Int)–grade prostate cancer. Data are shown for (a) all patients (n = 120, 19 low-grade and 54 high- or intermediate-grade lesions) and (b) patients in whom lesions measured on MR images were cognitively targeted during prostate biopsy (n = 43, four low-grade and 22 high- or intermediate-grade lesions). All NPZ regions were measured in NPZ on clinical images and were not sampled for biopsy.
Figure 4a:
Scatterplots of ADC versus T2 in NPZ and histologically proved low-grade or high- or intermediate (Int)–grade prostate cancer. Data are shown for (a) all patients (n = 120, 19 low-grade and 54 high- or intermediate-grade lesions) and (b) patients in whom lesions measured on MR images were cognitively targeted during prostate biopsy (n = 43, four low-grade and 22 high- or intermediate-grade lesions). All NPZ regions were measured in NPZ on clinical images and were not sampled for biopsy.
Correlation with Grade
In dataset A, ADC and T2 were significant univariate predictors for differentiating between histologically proved high- or intermediate-grade tumors and low-grade tumors, with the ADC and T2 combination producing the highest AUC of 0.83 (Table 3). In dataset B, sample sizes were too small in the low-grade group for multivariable analysis but demonstrated similar trends to those seen in dataset A (Figs 3, 4b).
Prostatitis versus NPZ
T1, T2, and ADC were significant univariate predictors in the differentiation between histologically proved prostatitis and NPZ (P < .0001 for T1 and T2; P = .0004 for ADC), where the combination of T1 and ADC offered the best discrimination (AUC = 0.99) in dataset A. In dataset B, all three variables were significant univariate predictors, where ADC alone had the highest AUC of 0.99. Sample sizes did not permit fitting multivariable models (Table 3).
Prostate Cancer versus Prostatitis
ADC offered minimal separation between cancer and prostatitis, with AUCs of 0.66 in dataset A and 0.68 in dataset B. T1 and T2, however, did not enable the differentiation between cancer and prostatitis in either group (Fig 3). In dataset A, the best discriminating model included only ADC (Table 3). Sample sizes did not permit fitting multivariable models in dataset B.
Interreader Variability
In the analysis of interreader agreement, MR fingerprinting–based T1 and T2 measurements were repeated in 135 lesions. Paired t tests showed no difference between measurements by the two readers. Pearson correlation coefficients and intraclass correlation coefficients for T1 and T2 were excellent (r = 0.81 and 0.79, respectively; intraclass correlation coefficient = 0.80 and 0.78).
Discussion
In this study, we demonstrated the feasibility of using MR fingerprinting in the characterization of prostate abnormalities and found that MR fingerprinting–derived T1 and T2 with standard ADC can help differentiate peripheral zone cancer from normal prostate tissue and has the potential to help separate high- and intermediate-grade tumors from low-grade malignancy. Here, T1, T2, and ADC were all individually significantly lower in cancer compared with NPZ. The MR fingerprinting–derived T2 values found in this study are within the range of those in the literature, whereas the ADC in cancer is slightly lower than that previously reported with 3.0-T units. The low ADC and T2 in cancer compared with NPZ are consistent with those in the literature, whereas T1 differences have not previously been reported (2,5–9,17–20). On the basis of the literature, low T2 in prostate cancer has been predominantly attributed to loss of glandular architecture and thus secretory function, as demonstrated by a concordant decrease in the concentration of citrate—a normal secretory product of the prostate (21). Lower ADC in cancer is a well-documented phenomenon related to the diminished water self-diffusivity. The increase in cellular density that occurs in neoplastic tissue has been shown to restrict movement of water protons by both reducing extracellular space and creating a more proteinaceous and viscous intracellular environment (22,23). Low T1 in prostate cancer compared with NPZ has not been previously reported, possibly because the change in T1 might be difficult to detect on weighted images. It is known that postbiopsy hemorrhage shortens T1 relaxation time. However, in the subset of patients with no history of biopsy (dataset B), the T1 difference between cancer and NPZ remained significant. The T1 differences may relate to the cellularity and protein content of tissue, which affect energy exchange between water and its surroundings (24). Further work is needed to elucidate the cause of the T1 changes in prostate cancer and prostatitis.
Although all three parameters enabled differentiation between cancer and NPZ independently, differentiation was better when the three parameters were used together. These results are based on an initial test dataset, and confirmation of these findings in an independent validation dataset is necessary. A possible explanation for this synergistic effect may be that each property is affected variably by different tissue changes that may not all be reflected in one property. Further radiologic-pathologic correlation studies are needed to conclusively elucidate how physiologic or pathologic differences are reflected quantitatively in each property.
The differentiation of low-grade disease from more aggressive intermediate- and high-grade variants is an important clinical goal in prostate imaging. Multiple studies have reported that ADC is helpful for assessing tumor aggressiveness (25–27). T2* and T2 mapping have also demonstrated measurable differences among cancer grades (28,29). In this study, we showed that ADC and T2 together have potential in differentiating high- and intermediate-grade tumors from low-grade disease. Insufficient numbers of low-grade lesions preclude statistical conclusions in the targeted biopsy group, although the scatterplot data produce intriguing separations. Further investigation with targeted biopsies in large patient groups is needed.
Prostatitis is not well differentiated from cancer on clinical MR images (30). Diffusion imaging has been used to differentiate prostatitis from prostate cancer with minimal success; our results with ADC were similar to those in the literature (9,22). The sample size was too small to determine if MR fingerprinting has a conclusive role in improving the differentiation between prostatitis and cancer.
This study has several limitations. Our data show the utility of MR fingerprinting for the purpose of objective and/or quantitative lesion characterization but not for lesion detection. For use in detection, map resolution would have to be improved to match the high spatial resolutions routinely used for structural T2-weighted imaging. Second, standard ADC maps and MR fingerprinting maps were acquired separately, which introduces the risk of misalignment between the ADC maps and MR fingerprinting–derived T1 and T2 maps. Simultaneous mapping of T1, T2, and ADC with perfect coregistration would be a desired technical innovation and is an active area of research (31). Another potential limitation of the described method is manual delineation of ROIs for sampling lesions and NPZ. Although this approach has been applied in previous studies on ADC mapping in prostate cancer and is commonly used in clinical practice to characterize lesions (2,4–8), a possible drawback of this method is that the full range of values that occur in pathologic and healthy tissue will not be captured. Another limitation is that the targeted validation was performed with cognitive guidance rather than US–MR imaging fusion or direct in-gantry biopsy, both of which have been shown to have higher detection rates of cancer (32,33). In addition to improved targeting, future studies that include segmentation of whole lesions and NPZ with correlation to whole-mount prostatectomy slices could conclusively address these limitations. Such a study design could help validate these initial results and also better establish ranges of expected values in each tissue type and/or abnormality. Finally, to better understand generalizability, future studies are needed to fully explore inter- and intrareader variability in using a multiparametric quantitative approach such as that studied herein. With use of a radiomics approach, MR fingerprinting measures in combination with individual patient characteristics may create decision support tools that could be used for diagnosis, prognostication, and outcomes prediction (34).
In conclusion, in this study we described the initial development and initial application of a combined MR fingerprinting and diffusion examination for the quantitative characterization of prostate tissue.
Advances in Knowledge
■ The combination of MR fingerprinting–derived T1 and T2 with standard apparent diffusion coefficients (ADCs) creates data for three key parameters to characterize prostate tissue.
■ T1, T2, and ADC from the normal peripheral zone (mean ± standard deviation, 2247 msec ± 450, 169 msec ± 61, and 1.711 × 10⁻³ mm2/sec ± 0.269, respectively) are significantly different from corresponding measurements in prostate cancer (mean, 1628 msec ± 344, 73 msec ± 27, 0.773 × 10⁻³ mm2/sec ± 0.311).
■ MR fingerprinting–derived T2 and ADC applied as a bivariate model help differentiate high- or intermediate-grade prostate cancer from low-grade cancer, with an area under the receiver operating characteristic curve of 0.83 (95% confidence interval: 0.71, 0.94).
Implication for Patient Care
■ The MR fingerprinting–derived T1 and T2 measurements with standard ADC acquisition may have a role in the quantitative characterization of prostate tissue, including the separation of normal tissue from cancer and the separation of low-grade from intermediate- or high-grade disease.
SUPPLEMENTAL TABLES
Received July 9, 2016; revision requested August 24; revision received October 6; accepted November 11; final version accepted December 8.
From the 2015 RSNA Annual Meeting.
Supported by Siemens USA and the National Institutes of Health (grants 1R01BB017219, 1R01DK098503, R01EB016728).
A.C.Y. and C.B. contributed equally to this work.
Disclosures of Conflicts of Interest: A.C.Y. disclosed no relevant relationships. C.B. Activities related to the present article: past research support from a Siemens Healthineers grant as a research fellow. Activities not related to the present article: disclosed no relevant relationships. Other relationships: has patents licensed to Siemens Healthineers; institution receives royalties from Siemens Healthineers. L.E.P. disclosed no relevant relationships. S.P. Activities related to the present article: past research support from a Siemens Healthineers grant as a research fellow. Activities not related to the present article: disclosed no relevant relationships. Other relationships: disclosed no relevant relationships. S.D. disclosed no relevant relationships. M.R. disclosed no relevant relationships. Y.J. Activities related to the present article: dislosed no relevant relationships. Activities not related to the present article: disclosed no relevant relationships. Other relationships: has patents licensed to Siemens Healthineers; institution receives royalties from Siemens Healthineers. S.M. disclosed no relevant relationships. M.S. disclosed no relevant relationships. W.T. disclosed no relevant relationships. R.A. disclosed no relevant relationships. D.M. Activities related to the present article: received research support from Siemens Healthineers. Activities not related to the present article: disclosed no relevant relationships. Other relationships: has patents licensed to Siemens Healthineers; institution receives royalties from Siemens Healthineers. M.A.G. Activities related to the present article: institution received a grant from Siemens Healthineers. Activities not related to the present article: institution has grants/grants pending from Siemens Healthineers; has patents from Siemens Healthineers, GE, and Bruker; institution has patents from Siemens Healthineers, GE, and Bruker; receives royalties from Siemens Healthineers, GE, and Bruker; institution receives royalties from Siemens Healthineers, GE, and Bruker. Other relationships: disclosed no relevant relationships. V.G. Activities related to the present article: received a grant from Siemens Healthineers. Activities not related to the present article: disclosed no relevant relationships. Other relationships: has patents licensed to Siemens Healthineers.
Abbreviations:
- ADC
- apparent diffusion coefficient
- AUC
- area under the receiver operating characteristic curve
- NPZ
- normal-appearing peripheral zone
- PI-RADS
- Prostate Imaging Reporting and Data System
- ROI
- region of interest
References
- 1.Turkbey B, Pinto PA, Mani H, et al. Prostate cancer: value of multiparametric MR imaging at 3 T for detection—histopathologic correlation. Radiology 2010;255(1):89–99. [DOI] [PMC free article] [PubMed] [Google Scholar]
- 2.Boesen L, Chabanova E, Løgager V, Balslev I, Thomsen HS. Apparent diffusion coefficient ratio correlates significantly with prostate cancer Gleason score at final pathology. J Magn Reson Imaging 2015;42(2):446–453. [DOI] [PubMed] [Google Scholar]
- 3.Oto A, Yang C, Kayhan A, et al. Diffusion-weighted and dynamic contrast-enhanced MRI of prostate cancer: correlation of quantitative MR parameters with Gleason score and tumor angiogenesis. AJR Am J Roentgenol 2011;197(6):1382–1390. [DOI] [PubMed] [Google Scholar]
- 4.Peng Y, Jiang Y, Yang C, et al. Quantitative analysis of multiparametric prostate MR images: differentiation between prostate cancer and normal tissue and correlation with Gleason score—a computer-aided diagnosis development study. Radiology 2013;267(3):787–796. [DOI] [PMC free article] [PubMed] [Google Scholar]
- 5.Kim CK, Park BK, Han JJ, Kang TW, Lee HM. Diffusion-weighted imaging of the prostate at 3 T for differentiation of malignant and benign tissue in transition and peripheral zones: preliminary results. J Comput Assist Tomogr 2007;31(3):449–454. [DOI] [PubMed] [Google Scholar]
- 6.Gibbs P, Liney GP, Pickles MD, Zelhof B, Rodrigues G, Turnbull LW. Correlation of ADC and T2 measurements with cell density in prostate cancer at 3.0 Tesla. Invest Radiol 2009;44(9):572–576. [DOI] [PubMed] [Google Scholar]
- 7.Hambrock T, Somford DM, Huisman HJ, et al. Relationship between apparent diffusion coefficients at 3.0-T MR imaging and Gleason grade in peripheral zone prostate cancer. Radiology 2011;259(2):453–461. [DOI] [PubMed] [Google Scholar]
- 8.Nagel KN, Schouten MG, Hambrock T, et al. Differentiation of prostatitis and prostate cancer by using diffusion-weighted MR imaging and MR-guided biopsy at 3 T. Radiology 2013;267(1):164–172. [DOI] [PubMed] [Google Scholar]
- 9.Simpkin CJ, Morgan VA, Giles SL, Riches SF, Parker C, deSouza NM. Relationship between T2 relaxation and apparent diffusion coefficient in malignant and non-malignant prostate regions and the effect of peripheral zone fractional volume. Br J Radiol 2013;86(1024):20120469. [DOI] [PMC free article] [PubMed] [Google Scholar]
- 10.Ma D, Gulani V, Seiberlich N, et al. Magnetic resonance fingerprinting. Nature 2013;495(7440):187–192. [DOI] [PMC free article] [PubMed] [Google Scholar]
- 11.Jiang Y, Ma D, Seiberlich N, Gulani V, Griswold MA. MR fingerprinting using fast imaging with steady state precession (FISP) with spiral readout. Magn Reson Med 2015;74(6):1621–1631. [DOI] [PMC free article] [PubMed] [Google Scholar]
- 12.Badve C, Yu A, Rogers M, et al. Simultaneous T1 and T2 brain relaxometry in asymptomatic volunteers using magnetic resonance fingerprinting. Tomography 2015;1(2):136–144. [DOI] [PMC free article] [PubMed] [Google Scholar]
- 13.Weinreb JC, Barentsz JO, Choyke PL, et al. PI-RADS prostate imaging—reporting and data system: 2015, version 2. Eur Urol 2016;69(1):16–40. [DOI] [PMC free article] [PubMed] [Google Scholar]
- 14.Dickinson L, Ahmed HU, Allen C, et al. Magnetic resonance imaging for the detection, localisation, and characterisation of prostate cancer: recommendations from a European consensus meeting. Eur Urol 2011;59(4):477–494. [DOI] [PubMed] [Google Scholar]
- 15.Evans JD. Straightforward statistics for the behavioral sciences. Pacific Grove, Calif: Brooks/Cole, 1996. [Google Scholar]
- 16.Shrout PE, Fleiss JL. Intraclass correlations: uses in assessing rater reliability. Psychol Bull 1979;86(2):420–428. [DOI] [PubMed] [Google Scholar]
- 17.Pickles MD, Gibbs P, Sreenivas M, Turnbull LW. Diffusion-weighted imaging of normal and malignant prostate tissue at 3.0T. J Magn Reson Imaging 2006;23(2):130–134. [DOI] [PubMed] [Google Scholar]
- 18.Yamauchi FI, Penzkofer T, Fedorov A, et al. Prostate cancer discrimination in the peripheral zone with a reduced field-of-view T(2)-mapping MRI sequence. Magn Reson Imaging 2015;33(5):525–530. [DOI] [PMC free article] [PubMed] [Google Scholar]
- 19.Fedorov A, Penzkofer T, Hirsch MS, et al. The role of pathology correlation approach in prostate cancer index lesion detection and quantitative analysis with multiparametric MRI. Acad Radiol 2015;22(5):548–555. [DOI] [PMC free article] [PubMed] [Google Scholar]
- 20.Jambor I, Pesola M, Merisaari H, et al. Relaxation along fictitious field, diffusion-weighted imaging, and T2 mapping of prostate cancer: prediction of cancer aggressiveness. Magn Reson Med 2016;75(5):2130–2140. [DOI] [PubMed] [Google Scholar]
- 21.Liney GP, Turnbull LW, Lowry M, Turnbull LS, Knowles AJ, Horsman A. In vivo quantification of citrate concentration and water T2 relaxation time of the pathologic prostate gland using 1H MRS and MRI. Magn Reson Imaging 1997;15(10):1177–1186. [DOI] [PubMed] [Google Scholar]
- 22.Esen M, Onur MR, Akpolat N, Orhan I, Kocakoc E. Utility of ADC measurement on diffusion-weighted MRI in differentiation of prostate cancer, normal prostate and prostatitis. Quant Imaging Med Surg 2013;3(4):210–216. [DOI] [PMC free article] [PubMed] [Google Scholar]
- 23.Szafer A, Zhong J, Gore JC. Theoretical model for water diffusion in tissues. Magn Reson Med 1995;33(5):697–712. [DOI] [PubMed] [Google Scholar]
- 24.Deoni SC. Quantitative relaxometry of the brain. Top Magn Reson Imaging 2010;21(2):101–113. [DOI] [PMC free article] [PubMed] [Google Scholar]
- 25.Woodfield CA, Tung GA, Grand DJ, Pezzullo JA, Machan JT, Renzulli JF, II. Diffusion-weighted MRI of peripheral zone prostate cancer: comparison of tumor apparent diffusion coefficient with Gleason score and percentage of tumor on core biopsy. AJR Am J Roentgenol 2010;194(4):W316–W322. [DOI] [PubMed] [Google Scholar]
- 26.Bittencourt LK, Barentsz JO, de Miranda LC, Gasparetto EL. Prostate MRI: diffusion-weighted imaging at 1.5T correlates better with prostatectomy Gleason grades than TRUS-guided biopsies in peripheral zone tumours. Eur Radiol 2012;22(2):468–475. [DOI] [PubMed] [Google Scholar]
- 27.Vos EK, Kobus T, Litjens GJ, et al. Multiparametric magnetic resonance imaging for discriminating low-grade from high-grade prostate cancer. Invest Radiol 2015;50(8):490–497. [DOI] [PubMed] [Google Scholar]
- 28.Wu LM, Zhou B, Lu Q, et al. T2* relaxation time in the detection and assessment of aggressiveness of peripheral zone cancer in comparison with diffusion-weighted imaging. Clin Radiol 2016;71(4):356–362. [DOI] [PubMed] [Google Scholar]
- 29.Hoang Dinh A, Souchon R, Melodelima C, et al. Characterization of prostate cancer using T2 mapping at 3T: a multi-scanner study. Diagn Interv Imaging 2015;96(4):365–372. [DOI] [PubMed] [Google Scholar]
- 30.Shukla-Dave A, Hricak H, Eberhardt SC, et al. Chronic prostatitis: MR imaging and 1H MR spectroscopic imaging findings—initial observations. Radiology 2004;231(3):717–724. [DOI] [PubMed] [Google Scholar]
- 31.Jiang Y, Ma D, Wright K, Seiberlich N, Gulani V, Griswold M. Simultaneous T1, T2, diffusion and proton density quantification with MR fingerprinting (abstr). In: Proceedings of the 2014 Joint Annual Meeting of ISMRM-ESMRMMB, Milan, Italy, May 10–16, 2014. [Google Scholar]
- 32.Vourganti S, Rastinehad A, Yerram NK, et al. Multiparametric magnetic resonance imaging and ultrasound fusion biopsy detect prostate cancer in patients with prior negative transrectal ultrasound biopsies. J Urol 2012;188(6):2152–2157. [DOI] [PMC free article] [PubMed] [Google Scholar]
- 33.Siddiqui MM, Rais-Bahrami S, Turkbey B, et al. Comparison of MR/ultrasound fusion-guided biopsy with ultrasound-guided biopsy for the diagnosis of prostate cancer. JAMA 2015;313(4):390–397. [DOI] [PMC free article] [PubMed] [Google Scholar]
- 34.Gillies RJ, Kinahan PE, Hricak H. Radiomics: images are more than pictures, they are data. Radiology 2016;278(2):563–577. [DOI] [PMC free article] [PubMed] [Google Scholar]
Associated Data
This section collects any data citations, data availability statements, or supplementary materials included in this article.


