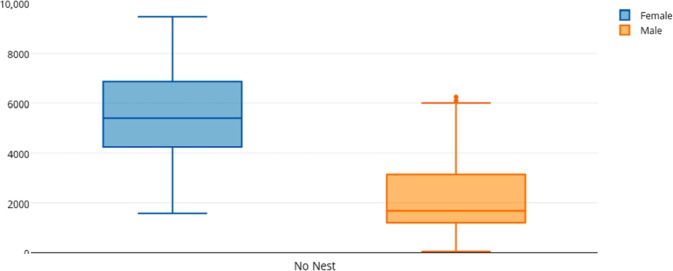
Figure 3. Box and whisker plot of the time spent (seconds) by flamingo partners away from the nest (No Nest).
The horizontal lines within the box indicate the medians, boundaries of the box indicate the 25th and 75th percentile and the whiskers indicate the minimum and maximum values of the data samples. Outliers are drawn as points.

