

Abstract
Objectives
To evaluate intra-observer variability of fibroid sonography measurements, and apply this to assessing fibroid growth.
Methods
Study participants were young African American women, aged 23–34, who had never been diagnosed with uterine fibroids. All participants underwent transvaginal ultrasound to screen for the presence of previously undiagnosed fibroids (≥0.5 cm diameter). The diameters of up to six fibroids were measured in three perpendicular planes at three separate times during the examination by experienced sonographers. Intra-observer variability as measured by the coefficient of variation (CV) for fibroid diameter and volume was calculated for each fibroid, and factors associated with CV were assessed using regression models. Impact of variability on growth assessment was determined.
Results
Ninety-six women out of three hundred women screened were found to have at least one fibroid, yielding a total of 174 fibroids for this analysis. The mean CV for the three measurements of fibroid maximum diameter was 5.9. The mean CV for fibroid volume was 12.7. Fibroid size contributed significantly to intra-observer variability, with more variability for smaller fibroids. Fibroid type (submucosal, intramural, subserosal) was not important. Fibroids from the same woman tended to have similar measurement variability when assessed for fibroid volume, but not for fibroid maximum diameter. Calculations showed that when following up fibroids, as much as a 20% increase in diameter could be due to measurement error, not “true growth”.
Conclusion
A small fibroid must have a larger change in size than a large fibroid to conclude that it is growing, but even for small fibroids an increase in diameter of >20% is likely to indicate “true growth,” not measurement variability.
Keywords: ultrasound, fibroid, variability, growth, coefficient of variation
Introduction
Estimating size change of an organ is a research and clinical assessment that is used to relate symptom development to organ growth, to identify treatment needs, and to evaluate treatment effectiveness. The assessment and evaluation of uterine fibroid growth is usually done with 2-D ultrasound. Assessing true growth has problems including variation in measurement, operator limitations, and patient characteristics that might impact image quality. While many of these factors cannot be accounted for accurately, measurement error due to operator variability (intra-observer variation) of fibroids can be assessed accurately, but data on intra-observer variation of the assessment of fibroids has rarely has been evaluated.
As research on the treatment and management of fibroids advances, the ability to treat fibroids with medical and less invasive surgical treatments is likely to expand[1] [2] Thus precise measurements of fibroid size and estimation of growth using ultrasound will become more and more important. The primary objective of this study is to report our findings regarding intra-observer variation. We then provide a method to determine the effect of this measurement error on the estimates of fibroid growth. We suggest that only increases in tumor size that is larger than measurement “noise” can be attributable to real growth.
METHODS
STUDY POPULATION
The data were collected in the Study of Environment, Lifestyle, & Fibroids (SELF), a study of fibroid development conducted in the Detroit, Michigan area and supported by the National Institute of Environmental Health Sciences, NIH. Study participants were premenopausal African American women ages 23–34 who had not been previously diagnosed with fibroids. Women were recruited from the community through local healthcare clinics, fliers, radio announcements, community events, and by word of mouth. Upon enrollment women completed detailed questionnaires about their current dietary habits, life-style habits, medical & family history, and symptoms such as bleeding and pain which may be caused by the presence of fibroids. A standardized research ultrasound examination was used to screen for the presence of fibroids. Of the first three hundred participants who enrolled, 96 were found to have one or more fibroids, despite having no prior clinical diagnosis of fibroids. These 96 women constitute the sample for this analysis. This study was approved by the institutional review boards of the National Institute of Environmental Health Sciences, and Henry Ford Health Systems, and all participants gave written informed consent.
FIBRIOD ASSESMENT
All fibroid measurements were taken during a single examination. Examinations were not scheduled according to a specific time during the menstrual cycle. Ultra-sonographers conducting exams had at least three years of gynecologic ultrasound experience, and were trained registered diagnostic medical sonographers (RDMS). Ultra sonographers used Phillips IU-22s to conduct study exams, with the exception of one GE Logic 9 machine of a similar age. Magnification was performed as needed, but ultrasonographers did not magnify to the point that the location position or type of fibroid could not be determined when reviewing images. Additional training in the detection and assessment of uterine fibroids was provided by the lead sonographer. Fibroid identification was based on ultra-sonographic criteria previously described in the literature, but extended to identify small fibroids (at least 0.5 cm in maximum diameter) [3, 4]. Care to distinguish fibroids from other pathologic changes in the uterus was addressed by including training on detecting the differences between adenomyosis and fibroids and polyps and fibroids [3, 5, 6].
Ultrasounds were conducted transvaginally. Transabdominal ultrasound examination was added if the transvaginal examination did not provide a complete assessment. Only 6.25 % (n=6) of our sample reported any “difficulty “ assessing the uterus during the scan due to participant factors such as body habitus, patient discomfort, and bowel activity. However, only two ultrasound exams out of 96 required a transabdominal approach due to patient discomfort with the vaginal probe. When we dropped these two participants, our results essentially stayed the same, and we present the results based on the entire sample. Fibroids were recorded as fibroids only if they were at least 0.5 cm in maximum diameter, and could be visualized in all three planes. The largest fibroid measured was 5.7 cm. If a fibroid-like echo pattern could not be visualized in all three planes, it was recorded as a “questionable fibroid” and the visualized diameters were recorded.
Each individual fibroid was measured with their 3 perpendicular diameters (sagittal, longitudinal, and transverse see figure 1). Each fibroid was relocated and re-measured two additional times during the examination. Caliper placement for each diameter was from outer border to outer border. Therefore, a total of 9 diameters were recorded for each fibroid. Sonographers used a standardized data collection form that included a diagram of the uterus where each fibroid was mapped and numbered. Therefore, in women with multiple fibroids each fibroid was carefully mapped, numbered, and measured separately three times.
Figure 1.

Fibroid measurements in the 3 perpendicular planes (sagittal, longitudinal, and transverse)
Fibroid type (intramural, submucosal, subserosal, and pedunculated) and location (fundus, uterine corpus, cervix/lower uterine segment) were assessed by each ultra-sonographer during the exam. Fibroid type was defined as intramural if it was mainly within the myometrium and did not impinge into the endometrial cavity. If a fibroid impinged upon the endometrial cavity, it was considered submucosal. A fibroid was considered subserosal if it projected from the serosal (uterine) surface, distorting the uterine contour with 1/3 or more of its volume. Fibroid location was determined with respect to the uterine axis, and divided into three categories (fundus, corpus, cervix/lower uterine segment) based on a reference picture kept at all sonography stations (see figure 2). Women were asked to void prior to examination.
Figure 2.
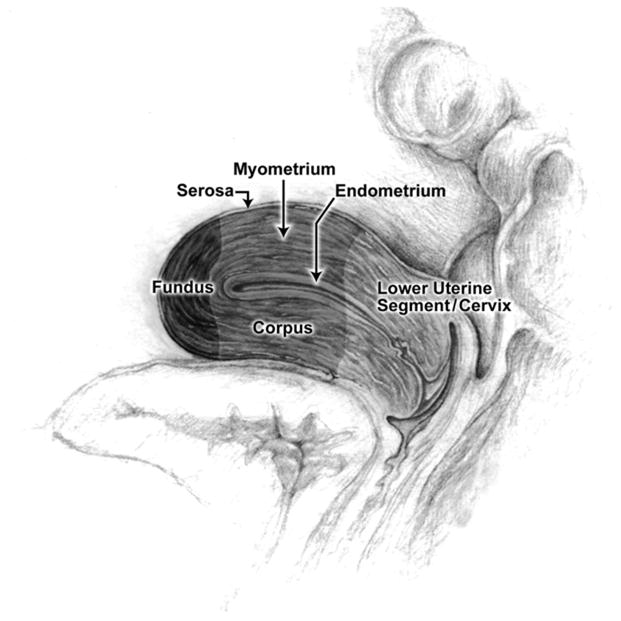
Reference illustration of the uterus
STATISTICAL ANALYSIS
We investigated which diameter (longitudinal, transverse, and anterior-posterior) had the greatest variability, by calculating coefficients of variation (CVs) for each diameter type. Analysis of variance was used to compare mean CVs for each diameter.
We calculated CVs for fibroid volume and fibroid maximum diameter for each fibroid. Fibroid volume was calculated using the ellipsoid formula (length × width × height) × 0.52 for each of the three measurements taken for a given fibroid. Thus, each fibroid had a total of 3 separate volumes calculated. The CV was then calculated for each fibroid using the 3 volume measurements. Similarly, the maximum diameter was determined for each of the 3 measurements of a given fibroid and the CV for maximum diameter was calculated based on the three maximum diameters recorded.
We evaluated fibroid size as a continuous and as a categorical variable. We created four categories of baseline fibroid size very small (0.5 cm to 0.9 cm), small fibroids (1.0 cm to 1.9 cm), medium sized fibroids (2.0 cm to 2.9 cm) and large fibroids (3.0 cm and over). The maximum mean diameter was used for categorizing fibroid size as follows. We calculated a mean diameter for each of the three planes (sagittal, longitudinal, and transverse), and chose the maximum mean diameter. We also investigated the influence of fibroid type and location (defined above).
Statistical analyses were done using SAS (version 9.2). We examined the relationship between fibroid characteristics (size, type, location) and measurement variation (CVs for each fibroid) with mixed model regression. This accounts for the possibility that fibroids from the same woman may have similar measurement variation using participant ID as a random effect. The mixed model provides a measure of this effect by including participant as a random effect to estimate within-woman and between-woman components of fibroid variability. All fibroid characteristics were included in the initial model, i.e., fibroid type, fibroid location, and fibroid size, and those characteristics that were not significant were dropped. The assumption of homoscedasticity of CV by baseline fibroid size was assessed using residual plots.
To estimate how much increase in fibroid diameter would be needed to identify what would likely represent true growth rather than measurement error, we used the 95% confidence interval of the CV to estimate the amount of increase that would be needed to exceed measurement “noise” (see appendix for sample calculations).
RESULTS
There were ninety-six women who had fibroids detected by ultrasound. There were a total of 178 fibroids; 174 were distinct, 4 fibroids were “questionable” and not used in the analysis. Age distribution and number of fibroids per woman are shown in Table 1. Most women had only one fibroid detected (61.5% n= 59). Type, location, and size of the fibroids can be seen in Table 1. Most fibroids were small (under 2cm in diameter n= 136, 78%). Most fibroids were intramural (n= 137, 79%). Only 4.0% (n=7) were submucosal. Approximately half of all fibroids were in the fundus (51%) and about another half in the uterine corpus (47%). Only 4 fibroids were detected in the cervix/lower uterine segment.
Table 1.
Characteristics of women with fibroids enrolled in the Study of Environment Lifestyle & Fibroids (SELF). A total of 300 women enrolled and 96 women had at least one fibroid at baseline examination (all are African American)
| Characteristics of Women | N=96 women | % |
|---|---|---|
| Age | ||
| 23–25 | 7 | 7 |
| 26–30 | 52 | 54 |
| 31–35 | 37 | 38 |
| Number (#) of fibroids | ||
| 1 | 59 | 62 |
| 2 | 12 | 12 |
| 3 | 7 | 7 |
| 4 | 5 | 5 |
| 5 | 4 | 4 |
| 6 or more* | 5 | 5 |
| Fibroid Characteristics | N=174 fibroids † | % |
| Type | ||
| Submucosal | 7 | 4 |
| Intramural | 137 | 79 |
| Subserosal | 28 | 16 |
| Pedunculated | 2 | 1 |
| Location | ||
| Fundal | 89 | 51 |
| Corpus | 81 | 47 |
| Cervix/lower segment | 4 | 2 |
| Fibroid size‡ | ||
| Very Small (0.5cm–0.9cm) | 45 | 26 |
| Small (1.0cm–1.9cm) | 91 | 52 |
| Medium (2.0cm–2.9cm) | 25 | 14 |
| Large (3 cm and over) | 13 | 8 |
3 women had 7 fibroids and 1 woman had 8 fibroids. Ultrasonographers recorded measurements for only the 6 largest fibroids detected.
174 fibroids included in the analysis; 4 fibroids were not visualized in all three planes (questionable fibroids) and were excluded from final analysis.
Fibroid size was calculated by taking the mean diameter from all three planes (longitudinal, transverse, and anterior-posterior) The maximum mean diameter from the three planes is the diameter used to determine size.
We found that the anterior-posterior diameter had significantly greater intra-observer variation (CV=14%) as compared to the longitudinal and transverse diameters (7% and 6% respectively, P-Valuedifference < 0.001).
Considering all 174 fibroids, the mean coefficient of variation (CV) for the three measurements of maximum fibroid diameter was 5.9% (95% CI 1.2, 13.5). Fibroid size contributed significantly to the variation in maximum diameter measurement, with smaller fibroids showing higher variability (P= 0.04) (Table 2). Fibroid location (with respect to the uterine axis) was also a significant predictor of measurement variation for maximum diameter (P = 0.03). Controlling for fibroid size, fibroids located in the fundus showed the lowest variability in measurement of maximum diameter (CVfundus= 4.9% 95% CI 1.2–10.0, CVcorpus= 6.9% 95% CI 1.2–17.2, CVcvx/lowersegment= 5.7% 95% CI 1.5–13.5).
Table 2.
Intra-observer measurement variability for fibroid maximum diameter and fibroid volume.
| Parameter
| ||||
|---|---|---|---|---|
| Fibroid maximum diameter (cm) | N | Mean CV(95% CI) | Threshold for True Growth, cm/cm3a | Threshold for True Growth, %a |
| Very small (0.5–0.9) | 45 | 6.3 (3.9–8.6) | 0.14 | 20 |
|
|
||||
| Small (1–1.9) | 91 | 4.7 (2.6–6.8) | 0.24 | 16 |
|
|
||||
| Medium (2–2.9) | 25 | 4.2 (1.9–6.5) | 0.37 | 15 |
|
|
||||
| Large (3 and over) | 13 | 3.2 (0.5–5.8) | 0.67 | 14 |
|
| ||||
| Fibroid volume (cm3)a | ||||
|
| ||||
| Very Small (0.065–0.51) | 45 | 14.9 (10.6–19.2) | 0.08 | 44 |
| Small (0.52–4.1) | 91 | 12.1 (8.2–16.1) | 0.66 | 38 |
| Medium (4.2–14.0) | 25 | 8.9 (4.4–13.5) | 2.56 | 31 |
| Large(over 14.0) | 13 | 7.2 (1.8–12.5) | 18.90 | 29 |
The threshold for growth was calculated by the formula described in “Appendix,” applied to a fibroid of 0.07, 1.5, 2.5, or 5.0 cm in diameter (and comparable 0.18, 1.76, 8.13, or 65 cm3 in volume) for each size category, respectively.
The size categories for diameter and volume were the same; ie, volume was calculated as that of the sphere listed (diameter3 × 0.52).
Measurement variability for fibroid volume, given that it was based on a formula using 3 diameters, was higher than for maximum diameter. The mean CV was 12.7% (95% CI 2.8, 28.7). The CV for volume varied significantly by fibroid size (P = 0.005), but not by fibroid type or location. Within woman effects were significant when considering the CV for fibroid volume but not for fibroid diameter. The significant within woman effects indicates that there was correlated measurement variation for multiple fibroids in a given woman. (P = 0.01). Volume measurements for small fibroids were much more variable than those for larger fibroids (Table 2). The significance of fibroid size was seen both when size was treated categorically and when it was treated as a continuous variable.
Given our results, small increases in fibroid size from one examination to the next could just be due to measurement error, not “true growth”. Our calculations showed that when following up fibroids, as much as a 20% increase in diameter could be due to measurement error, not true growth. We have calculated the threshold for true growth for fibroids for each size category to illustrate this (Table 2). See appendix for step-by-step calculation of such thresholds.
DISCUSSION
The intra-observer variability in 2-D ultrasound measurements of fibroid diameter and volume are within the general range of within-assay variability for biomarkers measured in blood or urine. Maximum diameter measurements had CVs <10, and the CVs for the fibroid volume estimates were also <10 for the fibroids ≥2 cm in size. Small fibroids were measured less accurately. Location appeared to also be a factor in measurement accuracy of the maximum diameter, with fibroids in the fundus being slightly more accurately measured than those in the corpus. The CVs for fibroid volume measurements are higher than those for fibroid diameter measurements. This is expected because volume is calculated using the longitudinal, AP, and transverse diameters, all of which have some measurement error. Within woman effects contributed to intra-observer variation for fibroid volume. One potential explanation of this finding is that sonogram quality differed somewhat between women. This would most likely be due to individual participant characteristics unique to that woman. These might be factors such as body habitus, shadowing from fibroids, and possible effects of time during the menstrual cycle, or retroversion of the uterus, which may interfere with image quality or image reproducibility.
We used the 95% CI of the model derived CV for maximum diameter to estimate the lower threshold for “true growth”, i.e., the smallest increase that can be distinguished from measurement error. For example, a fibroid measured initially at 1.5 cm maximum diameter would need to have a follow-up measurement of about 1.75 cm (a 16% increase) to attribute the increase to true growth rather than to measurement error. The appendix provides the step-by-step calculations required to estimate the increase in either diameter or volume to attribute the increase to “true growth”. As a useful rule of thumb, fibroids that increase in diameter by more than 20% can be assumed to have grown, while a <20% increase might be attributable to measurement variability.
Our study focused on intra-observer variation. Our estimate, based on 3 measures during the same examination could be an underestimate if the sonographer made a special effort to get near identical measures each time. That is unlikely given the protocol which requires a separate approach for each evaluation. We did not focus on inter-observer variation which would require multiple sonographers to measure the same fibroids (multiple examinations for the same woman). Ultrasonographers in our study had at least 3 years of experience in gynecologic ultrasound. They also underwent additional training to identify and measure fibroids according to research protocol. We know of no data for inter-observer variation in ultrasound measurements of fibroids, but increased variability between operators in other measurements have been linked to operator experience (more experienced operators have less inter-observer variation) [7] [8], and decreased variability has been linked with training prior to measuring the organ of interest, which was done in our study [9] [10]. Considering our lack of data on inter-observer variation, a fibroid size change needed to show true growth may be somewhat greater than the measure we calculated here especially in the context of less experienced operators.
We limited our calculation to the assessment of fibroid growth and not fibroid shrinkage, as fibroid growth tends to be more clinically relevant. However, as noted in the appendix of this paper, the method used to asses” true growth” can also be applied to the evaluation of “true shrinkage.”
Other limitations of our study included, small numbers of fibroids for certain subgroups of fibroids (submucosal, cervix and very large fibroids),, the fact that ultrasound examinations were not performed at a designated time during the menstrual cycle, and it is possible that our measured variability could also be increased because our protocol include a pre-examination void which has been shown to increase myometrial contractions [11]. There is no data available that has evaluated the impact of the stage of the menstrual cycle on the variability of fibroid measurements. However, it is possible that a thickened echogenic endometrium often found in the secretory phase of the menstrual cycle may be more likely to interfere with image quality of fibroids as compared to images taken during the menses or follicular stage of the cycle where the endometrium is likely to be thinner with a uniform multi-layered appearance [12]. This may be especially true for small submucosal fibroids that are close to or within the endometrial cavity. However, this effect would most likely have little impact on most other types of fibroids. Our study, like others, found few submucousal fibroids (4%, n=7).
2-D ultrasound is the most common radiologic modality to diagnose and evaluate fibroids. Magnetic resonance imaging (MRI) is more accurate when a woman has more than four fibroids [13], but is far more expensive. The addition of saline infusion to 2-D ultrasound improves evaluation of the endometrial cavity, but is more invasive than ultrasound alone [14]. 3-D ultrasound may also improve measurement accuracy especially for irregular structures, including the uterus [15–17], but measurement error for fibroids based on 3-D ultrasound has not been evaluated.
We are not aware of other data like ours on fibroid measurement error with 2-D ultrasound. Similar assessments for measurement of other structures are also limited, but appear to be similar to our findings. Intra-observer CVs for muscle diameter and cross sectional area was 8.5 and 8.9, respectively, and CVs for echocardiograph measures in foals was 5–15[18]. Our estimates of size change needed to identify true growth based on volume change is generally similar to that calculated for the prostate using 2-D ultrasound. A relative increase in prostate volume of 43% was needed [16], while we estimate a 29% volume increase would be needed for a 5-cm fibroid.
The ability to accurately measure fibroids will become more important as pharmacologic treatments become available [19]. Currently we know very little about fibroid and symptom progression, even though fibroids are the leading cause of hysterectomy in the United States [20]. While fibroid growth has often been linked to increased symptomatology in women, there are very few studies evaluating the relationship [21] [22]. This is in part due the difficulty of assessing fibroid growth accurately using 2-D ultrasound the most commonly used modality to assess fibroids. Our work will aid clinicians and researchers who want to evaluate tumor growth by allowing them to take intra-observer variation into account. We suggest using the upper bound of the 95% CI of model based CVs to estimate the lower threshold for “true growth” (see Table 2 and appendix for details).
CONCLUSION
Using 2-D Ultrasound, measurement error for fibroid diameter and volume varies with fibroid size. However, our estimates suggest that for most fibroids a 20% increase in diameter from one examination to another is likely to be indicative of “true growth”, while less change may just be “measurement noise”.
Acknowledgments
This research was supported in part by the Intramural Research Program of the NIH, National Institute of Environmental Health Sciences.
Funding also came from the American Recovery and Reinvestment Act funds designated for National Institutes of Health research.
Drs Grace Kissling and Zongli Xu provided helpful comments on an earlier draft of the manuscript. Melissa Williams, Deborah Cousins, and Sue Edelstein provided additional support with images for the figures.
Appendix
To obtain an estimate of what would constitute “true grow”th that exceeds measurement error (“noise”), we used the right hand tail of normal distribution for computing the probabilities (hence a one-sided tail). This assumes that growth, not shrinkage is the outcome of interest. The probability that the increase in the fibroid size at follow-up is larger than , given that there is no change in size, is 0.05. Thus there is only a 5% chance of observing a growth exceeding , when in reality there is just noise. To obtain a suitable estimate of standard deviation, a clinician may refer to Table 2 and obtain an upper bound of the CV for the measurement of interest. The SD of the fibroid measurement is back-calculated as fibroid measurement of interest x CV/100.
Then the upper bound for measurement error is derived as follows. Suppose X1 and X2 are the measurements of a tumor at two different time points, and we make the assumptions that; (a) Variance (X1) = Variance (X2), and (b) X1 and X2 are independent. Then the estimated variance for the change in size will be the sum of the variances at each point in time, times the estimated standard deviation (SD) = √2 x (SD). That is, we can be 95% confident that the growth exceeding (1.645) x √2 x SD (i.e., 2.33 x SD) is real. Similarly if an investigator is specifically looking for shrinking tumors then a decrease in excess of (1.645) x √2 x SD (i.e., 2.33 x SD) is considered to be “true shrinkage”.
For example, a fibroid with maximum diameter measured as 1.5 cm would be in the “small” (1.0 – 1.9cm) category. From Table 2, the upper bound of the 95% confidence interval for the intra-observer CV is 6.8%. The SD would be 1.5 × (6.8/100) = 0.102. An increase in diameter that would likely constitute real growth would be 2.33 x 0.102 = 0.238 or approximately 0.25 cm. Thus a fibroid diameter of 1.5 cm would have to increase to 1.74 cm or more (at least a 16% increase in diameter) to be considered to have undergone real growth.
Likewise, if volume is being used to assess growth, one would use the Table 2 values associated with volume. For example, a 65 cm3 fibroid (the size of a 5 cm diameter sphere) is within the “large” category. The upper bound of the 95% confidence interval for CV is 12.5. Thus, an estimated SD = 65 × .125 =8.12. The increase in volume that would likely constitute real growth would be 8.12 × 2.33 = 18.9 cm3. Thus a fibroid initially of volume 65 cm3 would need to increase to approximately 84 cm3 (an increase of about 29% in volume) to be considered true growth.
References
- 1.Laughlin SKSE. Uterine leiomyomas: individualizing the approach to a heterogeneous condition. Obstet Gynecol. 2011;117:396–403. doi: 10.1097/AOG.0b013e31820780e3. [DOI] [PMC free article] [PubMed] [Google Scholar]
- 2.Islam MSPO, Giannubilo SR, Toti P, Tranquilli AL, Petraglia F, Castellucci M, Ciarmela P. Uterine leiomyoma: available medical treatments and new possible therapeutic options. J Clin Endocrinol Metab. 2013;98:921–34. doi: 10.1210/jc.2012-3237. Epub 2013 Feb 7. [DOI] [PubMed] [Google Scholar]
- 3.Fedele L, Bianchi S, Dorta M, Zanotti F, Brioschi D, Carinelli S. Transvaginal ultrasonography in the differential diagnosis of adenomyoma versus leiomyoma. Am J Obstet Gynecol. 1992;167:603–6. doi: 10.1016/s0002-9378(11)91558-0. [DOI] [PubMed] [Google Scholar]
- 4.Wilde S, Scott-Barrett S. Radiological appearances of uterine fibroids. Indian J Radiol Imaging. 2009;19:222–31. doi: 10.4103/0971-3026.54887. [DOI] [PMC free article] [PubMed] [Google Scholar]
- 5.Kupfer MC, Schiller VL, Hansen GC, Tessler FN. Transvaginal sonographic evaluation of endometrial polyps. J Ultrasound Med. 1994;13:535–9. doi: 10.7863/jum.1994.13.7.535. [DOI] [PubMed] [Google Scholar]
- 6.Reinhold CTF, Wang L. Imaging features of adenomyosis. Hum Reprod Update. 1998;4:337–49. doi: 10.1093/humupd/4.4.337. [DOI] [PubMed] [Google Scholar]
- 7.Neukam K, Macias J, Ferrete C, Palomares J, Fernandez A, Mira J, et al. Impact of observer experience on the reproducibility of transient elastometry in HIV/HCV co-infected patients. HIV Clin Trials. 2009;10:276–81. doi: 10.1310/hct004-276. [DOI] [PubMed] [Google Scholar]
- 8.Abele H, Hoopmann M, Wright D, Hoffmann-Poell B, Huettelmaier M, Pintoffl K, et al. Intra- and interoperator reliability of manual and semi-automated measurement of fetal nuchal translucency by sonographers with different levels of experience. Ultrasound Obstet Gynecol. 2010;36:417–22. doi: 10.1002/uog.8809. [DOI] [PubMed] [Google Scholar]
- 9.Yang F, Leung K, Lee Y, Chan H, Tang M. Fetal biometry by an inexperienced operator using two- and three-dimensional ultrasound. Ultrasound Obstet Gynecol. 2010;35:566–71. doi: 10.1002/uog.7600. [DOI] [PubMed] [Google Scholar]
- 10.Sarris I, Ioannou C, Dighe M, Mitidieri A, Oberto M, Qingqing W, et al. Standardization of fetal ultrasound biometry measurements: improving the quality and consistency of measurements. Ultrasound Obstet Gynecol. 2011;38:681–7. doi: 10.1002/uog.8997. [DOI] [PubMed] [Google Scholar]
- 11.Schnettler WMM, Hacker MR, Modest AM, Rodriguez D. Impaired ultrasonographic cervical assessment after voiding: a randomized controlled trial. Obstet Gynecol. 2013;121:798–804. doi: 10.1097/AOG.0b013e3182860b8d. [DOI] [PMC free article] [PubMed] [Google Scholar]
- 12.Nalaboff KMPJ, Ben-Levi E. Imaging the endometrium: disease and normal variants. Radiographics. 2001;21:1409–24. doi: 10.1148/radiographics.21.6.g01nv211409. [DOI] [PubMed] [Google Scholar]
- 13.Dueholm M, Lundorf E, Hansen ES, Ledertoug S, Olesen F. Accuracy of magnetic resonance imaging and transvaginal ultrasonography in the diagnosis, mapping, and measurement of uterine myomas. Am J Obstet Gynecol. 2002;186:409–15. doi: 10.1067/mob.2002.121725. [DOI] [PubMed] [Google Scholar]
- 14.Bingol B, Gunenc Z, Gedikbasi A, Guner H, Tasdemir S, Tiras B. Comparison of diagnostic accuracy of saline infusion sonohysterography, transvaginal sonography and hysteroscopy. J Obstet Gynaecol. 2011;31:54–8. doi: 10.3109/01443615.2010.532246. [DOI] [PubMed] [Google Scholar]
- 15.Yaman C, Jesacher K, Polz W. Accuracy of three-dimensional transvaginal ultrasound in uterus volume measurements; comparison with two-dimensional ultrasound. Ultrasound Med Biol. 2003;29:1681–4. doi: 10.1016/s0301-5629(03)01070-6. [DOI] [PubMed] [Google Scholar]
- 16.Tong S, Cardinal HN, McLoughlin RF, Downey DB, Fenster A. Intra- and inter-observer variability and reliability of prostate volume measurement via two-dimensional and three-dimensional ultrasound imaging. Ultrasound Med Biol. 1998;24:673–81. doi: 10.1016/s0301-5629(98)00039-8. [DOI] [PubMed] [Google Scholar]
- 17.Riccabona M, Nelson TR, Pretorius DH. Three-dimensional ultrasound: accuracy of distance and volume measurements. Ultrasound Obstet Gynecol. 1996;7:429–34. doi: 10.1046/j.1469-0705.1996.07060429.x. [DOI] [PubMed] [Google Scholar]
- 18.Slack J, Durandot MM, Belcher CN, Collins N, Palmer L, Ousey J, et al. Intraoperator, intraobserver and interoperator variability of echocardiographic measurements in healthy foals. Equine Vet J Suppl. 2012;44(Suppl 41):69–75. doi: 10.1111/j.2042-3306.2011.00503.x. [DOI] [PubMed] [Google Scholar]
- 19.Sabry MA-HA. Innovative oral treatments of uterine leiomyoma. Obstet Gynecol Int. 2012;2012:943635. doi: 10.1155/2012/943635. [DOI] [PMC free article] [PubMed] [Google Scholar]
- 20.Laughlin SK, Schroeder JC, Baird DD. New directions in the epidemiology of uterine fibroids. Semin Reprod Med. 2010;28:204–17. doi: 10.1055/s-0030-1251477. [DOI] [PMC free article] [PubMed] [Google Scholar]
- 21.Wegienka G, Baird DDH-PI, et al. Self-reported heavy bleeding associated with uterine leimyomata. Obstet Gynecol. 2003 Mar;101:431–7. doi: 10.1016/s0029-7844(02)03121-6. [DOI] [PubMed] [Google Scholar]
- 22.Dragomir ADSJ, Connolly A, et al. Uterine leiomyomata associated with self-reported stress urinary incontinence. J Womens Health (Larchmt) 2010 Feb;19:245–50. doi: 10.1089/jwh.2009.1396. [DOI] [PMC free article] [PubMed] [Google Scholar]