Abstract
Breast cancer (BC) is the most common type of malignancy in females worldwide, however, its underlying mechanisms remain poorly understood. The present study aimed to investigate the mechanisms behind the development and progression of BC and identify potential biomarkers for it. The chromatin immunoprecipitation-DNA sequencing (ChIP-Seq) dataset GSM1642516 and gene expression dataset GSE34925 were downloaded from the Gene Expression Omnibus database. Affy and oligo packages were used for the background correction and normalization of the gene expression dataset. Based on Limma package and the criteria of a fold change >1.41 or <0.71, and a false discovery rate adjusted P-value <0.05, differentially-expressed genes (DEGs) in euchromatic histone lysine methyltransferase 2 (G9A) -knockout (KO) breast samples compared with control samples were identified. The Database for Annotation, Visualization and Integrated Analysis was used for the functional enrichment analysis of the DEGs. Bowtie 2 and model-based analysis of ChIP-Seq version 14 (macs14) were used for the mapping of raw reads and the identification of G9A binding sites (peaks), respectively. In addition, overlapping genes between the DEGs and genes in the peaks located in −3000 to 3000 bp centered in the transcription start sites (conpeaks) were screened out and microRNAs (miRNAs) believed to regulate those overlaps were identified through the TargetScan database. A total of 217 DEGs were identified in G9A-KO samples, which were mainly involved in the biological processes and pathways associated with the inflammatory response and cancer progression. A total of 10,422 peaks, containing 1,210 conpeaks involving 1,138 genes, were identified. Among the 1,138 genes, 15 were overlapped with the DEGs, and 35 miRNAs were identified to regulate those overlaps. Insulin-induced gene 1 was regulated by 9 genes in the miRNA-gene regulation network, which may indicate its importance in the progression of BC. The present study identified potential biomarkers of BC that may be useful in the diagnosis and treatment of patients with the disease.
Keywords: breast cancer, chromatin immunoprecipitation-DNA sequencing, gene expression omnibus, database for annotation, visualization and integrated analysis, biomarker
Introduction
Breast cancer (BC), is a type of malignancy that poses the greatest threat to female health worldwide, despite its relatively long 5-year survival rate (~58.75% between 1972 and 2011 in China) (1). BC is one of the most common types of cancer in Asia, where ~39% of all worldwide cases are diagnosed (2). The treatment and care for patients with BC is a large economic burden in developed and developing countries (3–5). Considering the health and economic effects of BC, numerous studies have been conducted to investigate the pathogenesis, and to identify therapeutic targets and potential factors that may contribute its progression. However, the mechanisms behind the development and progression of BC remain poorly understood, and additional studies are required.
G9A [also known as euchromatic histone lysine methyltransferase 2 (EHMT2)], encodes a methyltransferase that methylates lysine residues of histone H3. The dysregulation of G9A is associated with numerous abnormal biological processes and the emergence of diseases, including cancer. For example, the downregulation of G9A could trigger DNA damage responses and inhibit the progression of colorectal cancer (6). In head and neck squamous cell carcinoma, G9A dysregulation has been associated with epithelial-mesenchymal transition (EMT)-mediated metastasis and the maintenance of cancer stem cell-like characteristics (7). Furthermore, it has been identified that G9A performs important roles in the transition of acute-to-chronic pain (8). In BC, the aberrant expression of G9A could affect the stability of SRY-box 2 (SOX2), a tumor suppressor gene, by inducing its epigenetic silencing (9). Furthermore, a study by Si et al (10) revealed that G9A performed important roles in the dysfunction of the reciprocal feedback loop between GATA binding protein 3 and zinc finger E-box binding homeobox 2, and that it contributed to the progression of BC. The combined analysis of its genome-wide profiles and the gene expression data following G9A-knockdown (KO) or overexpression in BC could improve our understanding of its regulatory functions, and has not previously been investigated.
MicroRNAs (miRNAs/miRs) are small non-coding RNA molecules, 22–25 nucleotides in length. miRNAs are formed from the precursor miRNA, a double-stranded hairpin RNA or even the intergenic region, and perform important roles in the regulation of gene expression at the post translation level by silencing mRNA translation or inducing protein degradation (11). Numerous miRNAs have been shown to contribute to the progression of a number of cancer types. For example, the downregulation of miR-711 could inhibit the cellular proliferation of BC, and miR-711 has been shown to be an independent prognostic factor for BC (12). miR-27a/b and miR-494 may regulate the expression of tissue factor pathway inhibitor α (TFPIα) in its estrogen-mediated downregulation in BC (13).
In the present study, through the combined analysis of genome-wide profiles of G9A obtained through chromatin immunoprecipitation-DNA sequencing (ChIP-Seq) and the gene expression dataset [from the Gene Expression Omnibus (GEO)] following G9A-KO in BC, potential biomarkers were identified for the treatment of BC. miRNAs that may regulate those biomarkers were screened out and the core miRNAs and genes were obtained. The findings of the present study may be valuable for the diagnosis and treatment of BC.
Materials and methods
ChIP-Seq and gene expression dataset
In the present study, the ChIP-Seq and gene expression datasets were comprehensively obtained from the GEO database (http://www.ncbi.nlm.nih.gov/geo). The ChIP-Seq dataset (GSM1642516) was deposited from the study by Si et al (10), which used the G9A-specific antibody to capture the DNA fragments in MCF-7 cells and sequenced those fragments based on the GPL11154 Illumina HiSeq 2000 (Homo sapiens). Furthermore, an input control sample, which extracted all DNA in the human breast adenocarcinoma MCF-7 cell line, was adopted for the background correction in the identification of G9A binding sites (peaks). The gene expression dataset GSE34925 (14) contained 3 G9A-KO and 3 control BC samples, which were based on GPL6244 (HuGene-1_0-st) Affymetrix Human Gene 1.0 ST Array [transcript (gene) version] (Affymetrix, Inc., Santa Clara, CA, USA).
Differential expression analysis
The raw CEL data (data storage format) were imported to R based on the affy package (15). Background correction and expression normalization was conducted using the oligo package (16). Probe IDs were converted to gene symbols via the annotation package of the microarray platform and the expression values were summarized that corresponding to multiple probe sets. A paired Student's t-test was conducted between logarithmic transformed expression values of G9A-KO samples and control samples. Differentially-expressed genes (DEGs) with a fold-change expression value of >1.41 or <0.71, and a false discovery rate corrected P-value of <0.05 were screened out.
Functional enrichment analysis
The Database for Annotation, Visualization and Integrated Discovery (https://david.ncifcrf.gov/) (17) was used for the functional analysis of the DEGs. Gene Ontology (GO) terms and Kyoto Encyclopedia of Genes and Genomes (KEGG; http://www.kegg.jp/) pathways that satisfied the threshold of P<0.05 were screened out.
Genome-wide binding analysis of G9A
Bowtie 2 (18), an ultrafast genome aligning tool, was used for the mapping of the raw reads to UCSC hg19 genome with a maximum of 2 mismatches in every read. Model-based analysis of ChIP-Seq version 14 (macs14) (19) was used for the identification of the binding sites of G9A (also known as call peak) with a P-value of <1×10⁻⁵. Peaks located in −3000 to 3000 bp centered in the transcription start sites (TSS) were considered to be conpeaks. Based on the ChIPseeker package (20), the nearby genes, genome features (including promoter and 5′-untranslated region) and distances to the nearest TSS were assigned to the peaks.
Construction of miRNA-gene network
The overlapping genes between DEGs and genes located in the conpeaks were screened out. miRNAs that may regulate those overlaps were identified using the TargetScan database (http://www.targetscan.org/) (21). The miRNA-gene regulation network was visualized through Cytoscape (http://www.cytoscape.org/).
Results
DEGs
A total of 217 DEGs were identified in the G9A-KO BC samples, and the distribution of these DEGs is demonstrated in Fig. 1. The supervised clustering (Fig. 2) based on those DEGs was able to separate the G9A-KO and control samples well.
Figure 1.
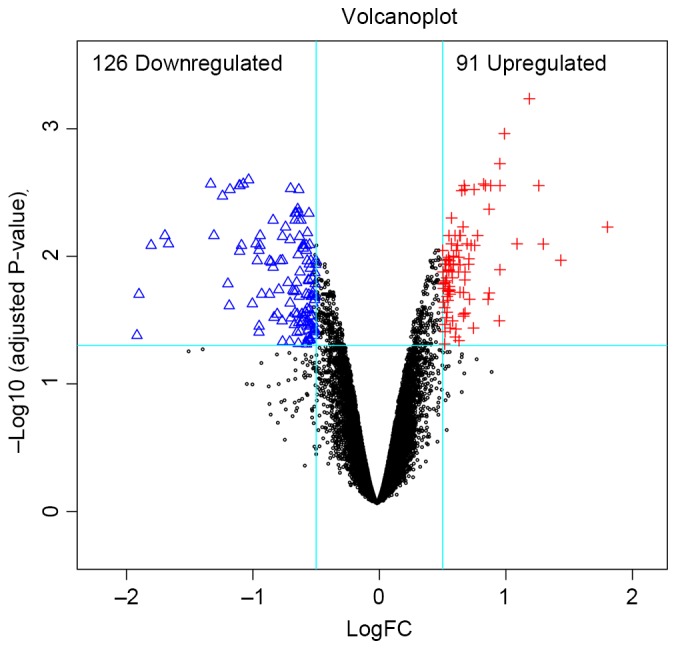
Distribution of DEGs in euchromatic histone lysine methyltransferase 2-knockout samples. The red plus signs and blue triangles represent upregulated and downregulated genes, respectively. The black circles represent non DEGs. FC, fold-change.
Figure 2.
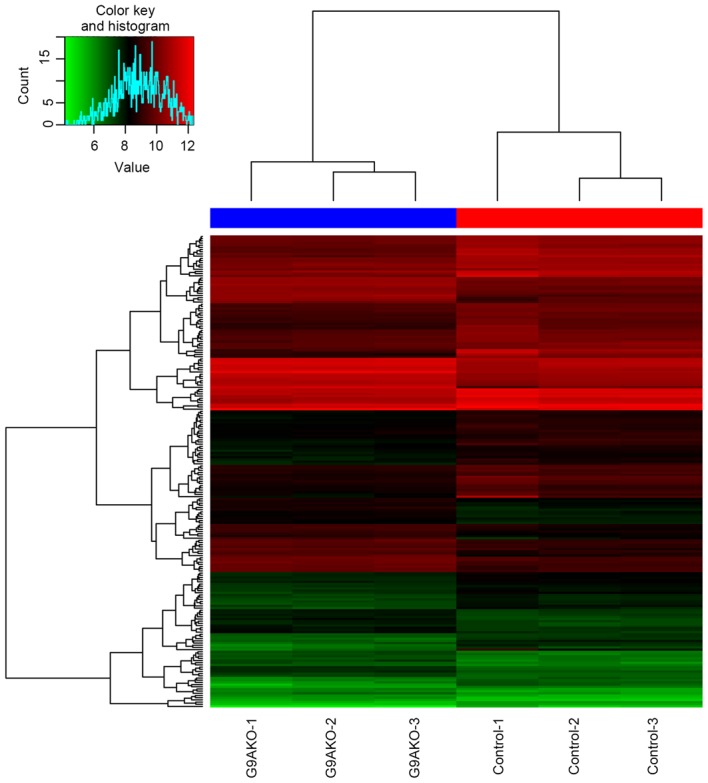
Two-way supervised clustering of differentially-expressed genes and samples using R software. G9A, euchromatic histone lysine methyltransferase 2; KO, knockout.
Enriched functions
A total of 172 GO terms and 3 KEGG pathways were identified to be enriched in DEGs, and were mainly involved in the cell process, the inflammatory response and cancer progression, for example, the extracellular region part. The top 10 GO terms according to P-value and KEGG pathways are presented in Tables I and II, respectively.
Table I.
Top 10 GO terms according to the P-value.
| Category | GO term | Count | P-value |
|---|---|---|---|
| CC | Extracellular space | 27 | 5.22×10⁻⁸ |
| CC | Extracellular region part | 32 | 9.50×10⁻⁸ |
| BP | Organ development | 44 | 1.04×10⁻⁶ |
| BP | Anatomical structure development | 53 | 1.44×10⁻⁵ |
| BP | System development | 50 | 1.59×10⁻⁵ |
| BP | Integrin-mediated signaling pathway | 8 | 1.70×10⁻⁵ |
| CC | Extracellular region | 44 | 1.95×10⁻⁵ |
| BP | Inflammatory response | 15 | 2.81×10⁻⁵ |
| BP | Blood vessel development | 13 | 3.09×10⁻⁵ |
| BP | Defense response | 21 | 3.32×10⁻⁵ |
GO, gene ontology; CC, cellular component; BP, biological process.
Table II.
Enriched Kyoto Encyclopedia of Genes and Genomes pathways.
| Pathway name | Count | P-value | Genes |
|---|---|---|---|
| Cytokine-cytokine receptor interaction | 13 | 2.99×10⁻⁴ | CSF2, TNFSF4, IL24, IL7R, CXCL11, TNFSF18, CXCL10, KDR, INHBB, VEGFC, CXCL16, IL1A, GHR |
| Focal adhesion | 11 | 5.24×10⁻⁴ | VEGFC, ITGB8, LAMA5, ITGB4, ITGA2, RELN, BIRC3, VAV1, MYLK, KDR, SPP1 |
| ECM-receptor interaction | 6 | 6.80×10⁻³ | ITGB8, LAMA5, ITGB4, ITGA2, RELN, SPP1 |
ECM, extracellular matrix.
Genome-wide binding profile of G9A
A total of 10,422 binding sites (peaks) of G9A were identified, including 1,210 conpeaks located in −3000 to 3000 bp centered in the TSS. The distribution of all peaks across the genome is shown in Fig. 3. In addition, 1,138 genes were identified to be located in the 1,210 conpeaks and 15 of these genes overlapped with DEGs (Table III).
Figure 3.
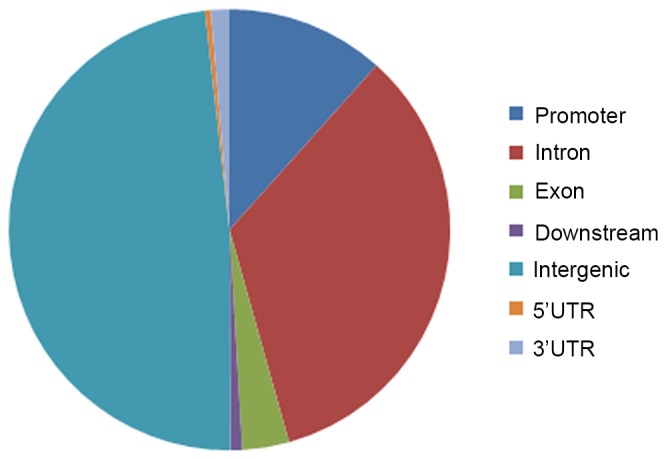
Distribution of peaks of euchromatic histone lysine methyltransferase 2 across the genome. UTR, untranslated region.
Table III.
Overlapping genes between differentially-expressed genes and genes located in conpeaks.
| Gene | logFC |
|---|---|
| SLCO4C1 | −0.65617 |
| ARHGAP24 | −0.66706 |
| ANK2 | −0.55143 |
| TMX4 | 0.54535 |
| LARP4 | −0.50197 |
| TC2N | −0.78340 |
| TMTC1 | 0.52521 |
| SLFN5 | −0.62773 |
| CYTIP | 0.67537 |
| PLCB4 | −0.55811 |
| ATF7IP2 | −1.19761 |
| CAMK2D | −0.50487 |
| TLR4 | 0.85905 |
| INSIG1 | −1.18712 |
| GHR | −0.60367 |
FC, fold-change.
miRNA-gene regulation network
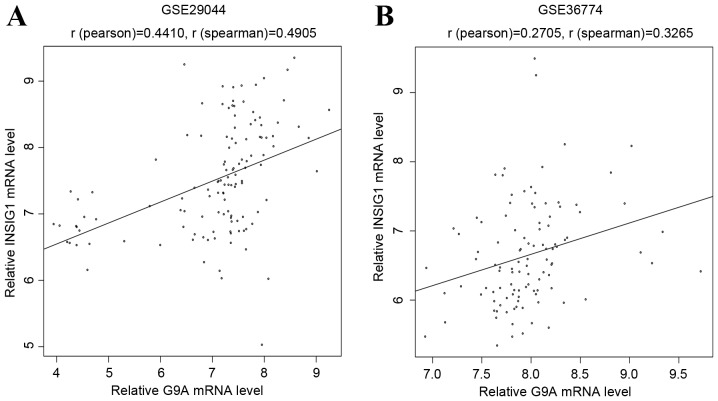
Based on TargetScan, a total of 35 miRNAs were identified to regulate the 15 overlapping genes, and 65 miRNA-gene pairs were obtained among them. The miRNA-gene regulation network is shown in Fig. 4. The top 10 genes according to their connectivity in the miRNA-gene network are listed in Table IV. In the network, insulin-induced gene 1 (INSIG1) was regulated by 9 miRNAs and had the highest connectivity, which indicated that it was a hub gene. Furthermore, two other public datasets (GSE29044 and GSE36774) were downloaded from the GEO database, which including data from breast cancer and normal tissue samples. These two datasets were background corrected and quantile normalized using the preprocessCore package of R (http://www.bioconductor.org/packages/release/bioc/html/preprocessCore.html). The Pearson and Spearman's correlation indices were respectively calculated using R between relative INSIG1 and G9A mRNA levels. The results indicated a significantly positive correlation (Fig. 5) between G9A and INSIG1, which may demonstrate their important roles in the progression of BC. The top 10 genes according to their connectivity in miRNA-gene network are presented in Fig. 4.
Figure 4.
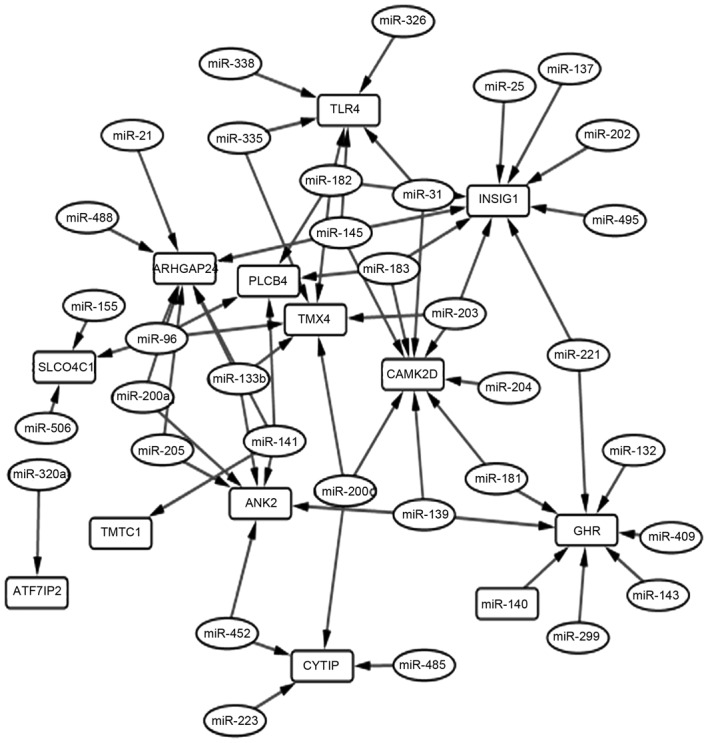
miRNA-gene regulation network. Rectangles show genes, whilst miRNAs are shown in ovals. Arrows represent the interactions between these genes and miRNAs.
Table IV.
Top 10 genes according to their connectivity in the microRNA-gene network.
| Gene | Connectivity |
|---|---|
| INSIG1 | 9 |
| ARHGAP24 | 8 |
| CAMK2D | 8 |
| GHR | 8 |
| ANK2 | 7 |
| TLR4 | 6 |
| TMX4 | 6 |
| CYTIP | 4 |
| miR-141 | 4 |
| miR-145 | 4 |
Figure 5.
Expression values of G9A were plotted against that of INSIG1 based on the other two public datasets (GSE29044 and GSE36774). G9A, euchromatic histone lysine methyltransferase 2; INSIG1, insulin-induced gene 1.
Discussion
BC is a complicated disease, and numerous factors may contribute to its initiation and progression, including occupational exposure (22), variations in expression level or mutations of specific genes (23,24). The traditional treatment options for BC mainly involve surgical resection, chemotherapy and radiotherapy, which have been shown to be effective but rarely eradicate the disease. With the development of next-generation sequencing technology, numerous biomarkers of BC have been identified and certain novel therapeutics have been proposed (25). Immunotherapy is one of the most popular therapeutic treatment options (26,27). The identification of novel biomarkers may therefore improve the prognosis for patients with BC.
In the present study, the genome-wide profiles of G9A in genome wide were identified using ChIP-Seq. DEGs in G9A-KO BC samples compared with the control samples were screened out. The combined analysis obtained potential direct targets of G9A, the majority of which were downregulated in the G9A-KO BC samples, which may indicate its upregulated functions in BC.
DEGs in G9A-KO samples are primarily involved in biological processes or pathways associated with cellular processes, inflammatory responses and cancer progression, including extracellular region part, cytokine-cytokine receptor interaction and extracellular membrane (ECM) receptor interaction, all of which are closely associated with the development of BC. In particular, inflammatory triple-negative BC, a type of rare and aggressive BC with a significantly poorer 5-year survival rate compared with other types of BC, is believed to mainly be attributed to an abnormal inflammatory response (28,29). Previous studies have considered that the ECM-receptor interaction pathway may be associated with the progression of BC, which could indicate the repeatability of the present study (30,31).
Among the 1,138 genes distributed in the 1,210 peaks located between −3000 to 3000 bp centered in the TSS, 15 were identified to overlapped with the DEGs in the G9A-KO BC samples. Furthermore, 11 of those overlaps were revealed to be downregulated in G9A-KO samples compared with the control samples, which may indicate that G9A is mainly involved in the upregulation of its target genes. The positive correlation between the expression values of G9A and INSIG1 was verified using two public datasets (Fig. 5). Furthermore, INSIG1 possessed an intimate connectivity pattern in the miRNA-gene regulation network (Fig. 4). Thus, this suggests that G9A and INSIG1 serve important roles in the progression of BC. INSIG1, which is downregulated in G9A-KO BC, was closely associated with the progression of several types of cancer via the regulation of glucose metabolism and hypoxia-induced EMT (32,33). BC had a strong association with insulin resistance, which was mediated by INSIG1 (34). In previous studies, INSIG1 was also demonstrated to be differentially expressed in BC (35,36). Combined with the results of the present study, this indicates the important roles of INSIG1 in BC.
miR-203 regulated 3 genes in the miRNA-gene regulation network, including INSIG1, which has been reported as a tumor suppressor in numerous types of cancer, including BC (37–39). The activity of miR-203 was also affected by a number of other factors, including kallistatin (40). Therefore, it would be useful to study the upstream and downstream regulation loops of miR-203 for the diagnosis and treatment of BC, as well as other types of cancer. Other nodes (miRNAs or genes) with high connectivity in the miRNA-gene regulation network may also be potential biomarkers for BC, which should be additionally verified through molecular biological experiments.
In conclusion, the present study conducted the combined analysis of ChIP-Seq and gene expression profiles in BC, and identified potential biomarkers via screening. The present results may aid the development of novel diagnostic or treatment methods, including immunotherapy, and therefore improve the prognosis of BC.
Acknowledgements
The present study was supported by the Municipal Science and Technology Commission of Tianjin (grant nos. 15ZLZLZF00440 and 16ZLZXZF00120) and the Health Bureau Science and Technology Foundation of Tianjin (grant no. 2014KZ102).
References
- 1.Zhu J, Chen JG, Chen YS, Zhang YH, Ding LL, Chen TY. Female breast cancer survival in Qidong, China, 1972–2011: A population-based study. BMC Cancer. 2014;14:318. doi: 10.1186/1471-2407-14-318. [DOI] [PMC free article] [PubMed] [Google Scholar]
- 2.Fan L, Goss PE, Strasser-Weippl K. Current status and future projections of breast cancer in Asia. Breast Care (Basel) 2015;10:372–378. doi: 10.1159/000441818. [DOI] [PMC free article] [PubMed] [Google Scholar]
- 3.Onega T, Tosteson AN, Weiss J, Alford-Teaster J, Hubbard RA, Henderson LM, Kerlikowske K, Goodrich ME, O'Donoghue C, Wernli KJ, et al. Costs of diagnostic and preoperative workup with and without breast MRI in older women with a breast cancer diagnosis. BMC Health Serv Res. 2016;16:76. doi: 10.1186/s12913-016-1317-6. [DOI] [PMC free article] [PubMed] [Google Scholar]
- 4.Dare AJ, Anderson BO, Sullivan R, Pramesh CS, Andre I, Adewole IF, Badwe RA, Gauvreau CL. Surgical services for cancer care. 2015 [PubMed] [Google Scholar]
- 5.Daroudi R, Sari A Akbari, Nahvijou A, Kalaghchi B, Najafi M, Zendehdel K. The economic burden of breast cancer in Iran. Iran J Public Health. 2015;44:1225–1233. [PMC free article] [PubMed] [Google Scholar]
- 6.Zhang J, He P, Xi Y, Geng M, Chen Y, Ding J. Down-regulation of G9a triggers DNA damage response and inhibits colorectal cancer cells proliferation. Oncotarget. 2015;6:2917–2927. doi: 10.18632/oncotarget.2784. [DOI] [PMC free article] [PubMed] [Google Scholar]
- 7.Liu S, Ye D, Guo W, Yu W, He Y, Hu J, Wang Y, Zhang L, Liao Y, Song H, et al. G9a is essential for EMT-mediated metastasis and maintenance of cancer stem cell-like characters in head and neck squamous cell carcinoma. Oncotarget. 2015;6:6887–6901. doi: 10.18632/oncotarget.3159. [DOI] [PMC free article] [PubMed] [Google Scholar]
- 8.Laumet G, Garriga J, Chen SR, Zhang Y, Li DP, Smith TM, Dong Y, Jelinek J, Cesaroni M, Issa JP, Pan HL. G9a is essential for epigenetic silencing of K(+) channel genes in acute-to-chronic pain transition. Nat Neurosci. 2015;18:1746–1755. doi: 10.1038/nn.4165. [DOI] [PMC free article] [PubMed] [Google Scholar]
- 9.Lee JY, Lee SH, Heo SH, Kim KS, Kim C, Kim DK, Ko JJ, Park KS. Novel function of lysine methyltransferase G9a in the regulation of Sox2 protein stability. PLoS One. 2015;10:e0141118. doi: 10.1371/journal.pone.0141118. [DOI] [PMC free article] [PubMed] [Google Scholar]
- 10.Si W, Huang W, Zheng Y, Yang Y, Liu X, Shan L, Zhou X, Wang Y, Su D, Gao J, et al. Dysfunction of the reciprocal feedback loop between GATA3- and ZEB2-nucleated repression programs contributes to breast cancer metastasis. Cancer Cell. 2015;27:822–836. doi: 10.1016/j.ccell.2015.04.011. [DOI] [PubMed] [Google Scholar]
- 11.Liu X, Liao S, Xu Z, Zhu L, Yang F, Guo W. Identification and analysis of the porcine MicroRNA in porcine cytomegalovirus-infected macrophages using deep sequencing. PLoS One. 2016;11:e0150971. doi: 10.1371/journal.pone.0150971. [DOI] [PMC free article] [PubMed] [Google Scholar]
- 12.Hu JY, Yi W, Zhang MY, Xu R, Zeng LS, Long XR, Zhou XM, Zheng XS, Kang Y, Wang HY. MicroRNA-711 is a prognostic factor for poor overall survival and has an oncogenic role in breast cancer. Oncol Lett. 2016;11:2155–2163. doi: 10.3892/ol.2016.4217. [DOI] [PMC free article] [PubMed] [Google Scholar]
- 13.Ali HO, Arroyo AB, González-Conejero R, Stavik B, Iversen N, Sandset PM, Martínez C, Skretting G. The role of microRNA −27a/b and microRNA-494 in oestrogen mediated downregulation of tissue factor pathway inhibitor α. J Thromb Haemost. 2016;14:1226–1237. doi: 10.1111/jth.13321. [DOI] [PubMed] [Google Scholar]
- 14.Dong C, Wu Y, Yao J, Wang Y, Yu Y, Rychahou PG, Evers BM, Zhou BP. G9a interacts with Snail and is critical for Snail-mediated E-cadherin repression in human breast cancer. J Clin Invest. 2012;122:1469–1486. doi: 10.1172/JCI57349. [DOI] [PMC free article] [PubMed] [Google Scholar]
- 15.Gautier L, Cope L, Bolstad BM, Irizarry RA. affy-analysis of Affymetrix GeneChip data at the probe level. Bioinformatics. 2004;20:307–315. doi: 10.1093/bioinformatics/btg405. [DOI] [PubMed] [Google Scholar]
- 16.Stuhlmüller B. A composition of nucleic acid sequences, specific for inflammatory disease, in particular rheumatoid arthritis. EP 1795610 A1. 2005 2007 Jun 13; December 6. [Google Scholar]
- 17.Dennis G, Jr, Sherman BT, Hosack DA, Yang J, Gao W, Lane HC, Lempicki RA. DAVID: Database for annotation, visualization, and integrated discovery. Genome Biol. 2003;4:P3. doi: 10.1186/gb-2003-4-5-p3. [DOI] [PubMed] [Google Scholar]
- 18.Langmead B, Salzberg SL. Fast gapped-read alignment with Bowtie 2. Nat Methods. 2012;9:357–359. doi: 10.1038/nmeth.1923. [DOI] [PMC free article] [PubMed] [Google Scholar]
- 19.Feng J, Liu T, Qin B, Zhang Y, Liu XS. Identifying ChIP-seq enrichment using MACS. Nat Protoc. 2012;7:1728–1740. doi: 10.1038/nprot.2012.101. [DOI] [PMC free article] [PubMed] [Google Scholar]
- 20.Yu G, Wang LG, He QY. ChIPseeker: An R/Bioconductor package for ChIP peak annotation, comparison and visualization. Bioinformatics. 2015;31:2382–2383. doi: 10.1093/bioinformatics/btv145. [DOI] [PubMed] [Google Scholar]
- 21.Song X, Cheng L, Zhou T, Guo X, Zhang X, Chen YP, Han P, Sha J. Predicting miRNA-mediated gene silencing mode based on miRNA-target duplex features. Comput Biol Med. 2012;42:1–7. doi: 10.1016/j.compbiomed.2011.10.001. [DOI] [PubMed] [Google Scholar]
- 22.Fenga C. Occupational exposure and risk of breast cancer. Biomed Rep. 2016;4:282–292. doi: 10.3892/br.2016.575. [DOI] [PMC free article] [PubMed] [Google Scholar]
- 23.Inoue K, Fry EA. Novel molecular markers for breast cancer. Biomark Cancer. 2016;8:25–42. doi: 10.4137/BIC.S38394. [DOI] [PMC free article] [PubMed] [Google Scholar]
- 24.Rizk SM, Shahin NN, Shaker OG. Association between SIRT1 gene polymorphisms and breast cancer in Egyptians. PLoS One. 2016;11:e0151901. doi: 10.1371/journal.pone.0151901. [DOI] [PMC free article] [PubMed] [Google Scholar]
- 25.Shen Y, Cai T. Identifying predictive markers for personalized treatment selection. Biometrics. 2016;72:1017–1025. doi: 10.1111/biom.12511. [DOI] [PMC free article] [PubMed] [Google Scholar]
- 26.Becht E, de Reyniès A, Giraldo NA, Pilati C, Buttard B, Lacroix L, Selves J, Sautès-Fridman C, Laurent-Puig Pa, Fridman WH. Immune and stromal classification of colorectal cancer is associated with molecular subtypes and relevant for precision immunotherapy. Clin Cancer Res. 2016;22:4057–4066. doi: 10.1158/1078-0432.CCR-15-2879. [DOI] [PubMed] [Google Scholar]
- 27.Abou-Shousha S, Moaz M, Sheta M, Motawea MA. An approach to breast cancer immunotherapy: The apoptotic activity of recombinant anti-interleukin-6 monoclonal antibodies in intact tumor microenvironment of breast carcinoma. Scand J Immunol. 2016;83:427–437. doi: 10.1111/sji.12426. [DOI] [PubMed] [Google Scholar]
- 28.Biswas T, Efird JT, Prasad S, James SE, Walker PR, Zagar TM. Inflammatory TNBC breast cancer: Demography and clinical outcome in a large cohort of patients with TNBC. Clin Breast Cancer. 2016;16:212–216. doi: 10.1016/j.clbc.2016.02.004. [DOI] [PubMed] [Google Scholar]
- 29.Suárez-Arroyo IJ, Rios-Fuller TJ, Feliz-Mosquea YR, Lacourt-Ventura M, Leal-Alviarez DJ, Maldonado-Martinez G, Cubano LA, Martínez-Montemayor MM. Ganoderma lucidum combined with the EGFR tyrosine kinase inhibitor, erlotinib synergize to reduce inflammatory breast cancer progression. J Cancer. 2016;7:500–511. doi: 10.7150/jca.13599. [DOI] [PMC free article] [PubMed] [Google Scholar]
- 30.Yang X, Jia M, Li Z, Lu S, Qi X, Zhao B, Wang X, Rong Y, Shi J, Zhang Z, et al. Bioinformatics analysis of aggressive behavior of breast cancer via an integrated gene regulatory network. J Cancer Res Ther. 2014;10:1013–1018. doi: 10.4103/0973-1482.137971. [DOI] [PubMed] [Google Scholar]
- 31.Sun Y, Yuan K, Zhang P, Ma R, Zhang QW, Tian XS. Crosstalk analysis of pathways in breast cancer using a network model based on overlapping differentially expressed genes. Exp Ther Med. 2015;10:743–748. doi: 10.3892/etm.2015.2527. [DOI] [PMC free article] [PubMed] [Google Scholar]
- 32.Chen HF, Wu KJ. Epigenetics, TET proteins, and hypoxia in epithelial-mesenchymal transition and tumorigenesis. Biomedicine (Taipei) 2016;6:1. doi: 10.7603/s40681-016-0001-9. [DOI] [PMC free article] [PubMed] [Google Scholar]
- 33.Tsai YP, Chen HF, Chen SY, Cheng WC, Wang HW, Shen ZJ, Song C, Teng SC, He C, Wu KJ. TET1 regulates hypoxia-induced epithelial-mesenchymal transition by acting as a co-activator. Genome Biol. 2014;15:513. doi: 10.1186/s13059-014-0513-0. [DOI] [PMC free article] [PubMed] [Google Scholar]
- 34.Ghose A, Kundu R, Toumeh A, Hornbeck C, Mohamed I. A review of obesity, insulin resistance, and the role of exercise in breast cancer patients. Nutr Cancer. 2015;67:197–202. doi: 10.1080/01635581.2015.990569. [DOI] [PubMed] [Google Scholar]
- 35.Hernández-Vargas H, Rodriguez-Pinilla SM, Julián-Tendero M, Sánchez-Rovira P, Cuevas C, Antón A, Ríos MJ, Palacios J, Moreno-Bueno G. Gene expression profiling of breast cancer cells in response to gemcitabine: NF-kappaB pathway activation as a potential mechanism of resistance. Breast Cancer Res Treat. 2007;102:157–172. doi: 10.1007/s10549-006-9322-9. [DOI] [PubMed] [Google Scholar]
- 36.Einbond LS, Su T, Wu HA, Friedman R, Wang X, Jiang B, Hagan T, Kennelly EJ, Kronenberg F, Weinstein IB. Gene expression analysis of the mechanisms whereby black cohosh inhibits human breast cancer cell growth. Anticancer Res. 2007;27:697–712. [PubMed] [Google Scholar]
- 37.Shi Y, Tan YJ, Zeng DZ, Qian F, Yu PW. miR-203 suppression in gastric carcinoma promotes Slug-mediated cancer metastasis. Tumour Biol. 2015 Jul 21; doi: 10.1007/s13277-015-3765-8. (Epub ahead of print) [DOI] [PubMed] [Google Scholar]
- 38.Taipaleenmäki H, Browne G, Akech J, Zustin J, Van Wijnen AJ, Stein JL, Hesse E, Stein GS, Lian JB. Targeting of Runx2 by miR-135 and miR-203 impairs progression of breast cancer and metastatic bone disease. Cancer Res. 2015;75:1433–1444. doi: 10.1158/0008-5472.CAN-14-1026. [DOI] [PMC free article] [PubMed] [Google Scholar]
- 39.Zhou Y, Hu HY, Meng W, Jiang L, Zhang X, Sha JJ, Lu Z, Yao Y. MEK inhibitor effective against proliferation in breast cancer cell. Tumour Biol. 2014;35:9269–9279. doi: 10.1007/s13277-014-1901-5. [DOI] [PubMed] [Google Scholar]
- 40.Li P, Guo Y, Bledsoe G, Yang Z, Chao L, Chao J. Kallistatin induces breast cancer cell apoptosis and autophagy by modulating Wnt signaling and microRNA synthesis. Exp Cell Res. 2016;340:305–314. doi: 10.1016/j.yexcr.2016.01.004. [DOI] [PMC free article] [PubMed] [Google Scholar]


