

Abstract
Objectives
This paper investigates the ability of grouped quantification (an expression of the same-patient processing approach, or SPP) to improve repeatability of measurements in patients with multiple SPECT studies, and evaluates its performance compared to standard quantification in a population of 100 patients undergoing rest, stress, gated rest and gated stress SPECT MPI. All acquisitions were performed twice, back-to-back, for a total of 800 image datasets (8 per patient).
Methods
Each dataset was automatically processed a) independently, using standard quantitative software, and b) as a group, together with the other 7 datasets belonging to the same patient, using an SPP-modified version of the software that registered the images to one another using a downhill simplex algorithm for the search of optimal translation, rotation and scaling parameters.
Results
Overall, grouped quantification resulted in significantly lower differences between repeated measurements of stress ungated volumes (1.40±2.76 ml vs. 3.33±5.06 ml, p<0.05), end-diastolic volumes (1.78±2.78 ml vs. 3.49±5.35 ml, p<0.05), end-systolic volumes (1.17±1.96 ml vs. 2.44±3.35 ml, p<0.05) and LVEFs (−0.45±2.29% vs. −1.16±3.30%, p<0.05). Additionally, grouped quantification produced better repeatability (lower repeatability coefficients) for stress and rest ungated volumes (5.4 vs 9.9 and 5.2 vs. 13.1, respectively), stress TPD (2.6 vs. 3.6), stress and rest end-diastolic volumes (5.5 vs. 10.5 and 7.2 vs. 14.7, respectively), stress and rest end-systolic volumes (3.8 vs. 6.6 and 5.3 vs. 10.3, respectively), stress and rest LVEFs (4.5 vs. 6.5 and 4.7 vs. 8.2, respectively), and rest total motion deficit (5.6 vs. 9.6)
Conclusion
It is possible to improve the repeatability of quantitative measurements of parameters of myocardial perfusion and function derived from SPECT MPI studies of a same patient by group processing of image datasets belonging to that patient. This application of the same-patient processing approach is an extension of the “paired processing” technique already described by our group, and can be performed in automated fashion through incorporation in the quantitative algorithm.
INTRODUCTION
Measurements of perfusion and function from SPECT myocardial perfusion imaging (MPI) have become a central part of the management of patients with known or suspected coronary artery disease (CAD). Repeat SPECT MPI studies are often used to assess the clinical implications of change in patient symptoms. In determining whether a true change in myocardial perfusion or function has occurred over time, it is of crucial importance to understand how much the change of the various measurements over time truly reflects a change in the patient’s cardiac condition. This understanding requires assessment of the intrinsic repeatability of the measurements.
We have previously reported that when multiple image datasets for the same patient are available, one can take advantage of the fact that the imaged heart is the same, and deal with all images as a group rather than individually for the purpose of left ventricular (LV) segmentation. We have termed that approach same-patient processing, and demonstrated its ability to improve the success rate of the segmentation algorithm in a large patient population, as described in a companion paper1.
While segmentation (LV masking) failures do occur, they are somewhat infrequent (if the acquisition has been properly performed), and generally result in major, easily detected discrepancies between the software-generated contours and the apparent location of the LV myocardium. More frequently, however, the contours automatically generated for different image datasets of the same patient look reasonable in isolation, but discrepancies can be spotted if datasets are displayed side by side – in our clinical experience, when presented with a stress/rest dataset pair, the technologist will manually adjust the software-generated contours’ location at the valve plane in one of the two datasets about 20–40% of the times.
As done for segmentation1, treating all images associated with a patient as a group can improve the consistency of quantification. Even though the specific algorithm described in this paper and employed to improve quantification is different from the one used to improve LV segmentation, they are both expressions of the “same-patient processing” or “grouped processing” approach – one could consider the enhanced segmentation algorithm a QC tool, and the enhanced quantification algorithm an automated contour refinement tool. This grouped quantification strategy was tested on a 100-patient population with repeated, single-injection back to back studies in which quantitative differences were expected to be very low, since very little time had elapsed, and no change had been introduced with regard to patient condition or imaging protocol between test and retest.
MATERIALS AND METHODS
Patient population
We investigated 99mTc-tetrofosmin SPECT MPI studies in 100 patients who had undergone repeated, back-to-back gated stress and back-to-back gated rest acquisitions from July 2007 to March 2008 at the Nuclear Cardiology Diagnostic Imaging laboratory, University of Ottawa Heart Institute, Ottawa, Canada in a study designed to evaluate and compare the repeatability of SPECT MPI assessments using visual and standard quantitative tools2. While the patient population and image datasets in the current study are the same as in the previous report2, we now seek to evaluate the effect of grouped quantification on the repeatability of gated MPS parameter measurements, as compared to standard quantification. The study was approved by the University of Ottawa’s Human Ethics Review Board, and the clinical characteristics for this patient population are summarized in Table 1.
Table 1.
Characteristics of patients
| Characteristic | Value |
|---|---|
| Total (n) | 100 |
| Males | 74 (74%) |
| Females | 26 (26%) |
| Diabetes | 14 (14%) |
| Hypertension | 58 (58%) |
| Hypercholesteremia | 56 (56%) |
| Smoking | 54 (54%) |
| Family history of CAD | 41 (41%) |
| Previous events (MI/PCI/CABG) | 20/25/8 |
| Average | |
| Age (yrs) | 56±11 |
| BMI | 28.3±4.0 |
Image acquisition
The details of image acquisition have been previously described2. In brief, each study was performed with a 99mTc-tetrofosmin rest/stress 1-day protocol3. For rest images, the injected dose of 99mTc-tetrofosmin was, on average, 340 MBq, with a range of 301–453 MBq. For the stress images, the average injected dose was 1053 MBq, with a range of 930–1281 MBq. All subjects were imaged twice (back-to-back) at rest, 45 minutes after tetrofosmin injection, followed by back-to-back imaging at stress 30–60 minutes after a second tetrofosmin injection, either during treadmill testing or dipyridamole infusion. To clarify, patients were moved in and out of the scanner at the end of the second rest acquisition (before the first stress acquisition), but were told not to move between rest studies or between stress studies, and were not repositioned. All patient studies were acquired with a 90-degree rotation of a dual-detector integrated SPECT/CT camera (Infinia Hawkeye 4, GE Healthcare) that used a 20% energy window centered on the 140-keV photopeak of 99mTc and low energy high-resolution collimators. Both rest and stress scans were obtained with 8 gated frames per cardiac cycle.
Image reconstruction
All reconstructions were performed from original raw projection data using 64 × 64 matrixes (pixel size = 6.8 × 6.8 mm) and the filtered back projection algorithm, with Butterworth filters parameters of order = 10, and cutoff = 0.33 cycles/pixel and 0.25 cycles/pixel for ungated and gated MPS images, respectively. All tomographic images were generated using Cedars-Sinai’s automated reconstruction and reorientation software4. No attenuation correction was applied. All datasets were randomized and de-identified. All stress and rest images were used for generating the perfusion and function measurements.
Quantification (conventional vs. same-patient processing)
All studies were analyzed with two quantification algorithms. Conventional analysis utilized a widely available, standard implementation of the Cedars-Sinai cardiac quantification software (Cedars Cardiac Suite 2008)5. The new analysis – “same-patient processing” – used software that was modified to incorporate the image registration algorithm previously described6. In brief, as a consequence of limited resolution and variations in radiopharmaceutical uptake, LV myocardium contour definition in molecular imaging is a non-deterministic problem. This imposes a degree of uncertainty in any computed LV contours, leading to inaccuracies which are compounded when making intra-patient comparisons between acquisitions. Same-patient processing, also referred to as grouped processing, reduces these inaccuracies by first registering these images to each other, as previously described6, using a downhill simplex algorithm for the search of optimal translation, rotation and scaling parameters - similar to our previous work in fitting cardiac images to templates7–8. Convergence is established if the cost function decreases below a predefined threshold (0.1%) for each simplex iteration. Contours are then computed for all registered images collectively, enforcing local, scale-invariant similarity constraints on shape between contours in the absence of evidence to the contrary. This results in solutions that are more consistent across images, especially in those instances, such as the presence of perfusion defects, where the solutions necessarily have a more significant arbitrary component. No manual corrections at all were performed in this study, for either conventional or same-patient quantification.
LV parameters investigated in this study were ungated volume, total perfusion deficit (TPD)9, end-diastolic volume (EDV), end-systolic volume (ESV), ejection fraction (LVEF), total motion deficit (Mo TPD) and total thickening deficit (Th TPD). As described for perfusion TPD9, Mo TPD was designed to combine motion abnormality extent and severity in one global parameter, which can range from 0 (normal motion) to theoretically 100%. The same is true for Th TPD, a global parameter that combines thickening extent and severity. All parameters were measured automatically using a) standard quantification and b) grouped quantification (same-patient processing, or SPP) in all 100 back-to-back sets of rest, stress, gated rest and gated stress images (800 datasets in total).
The initial analysis involved computing, for every patient and for every parameter P, the quantitative value of that parameter in every pair of back-to-back studies using both the conventional and the grouped quantification approach, and averaging the computed values according to the following equations:
| (1) |
| (2) |
, where Qconv and QSPP are the quantitative measurements obtained using the conventional and the SPP approach, respectively, and Pconv and PSPP represent their average over the back-to-back studies. The mean and standard deviation of Pconv and PSPP across the 100 patients were then calculated for every parameter and each of the four imaging categories (rest, stress, gated rest and gated stress), to investigate whether grouped quantification introduced systematic biases compared to the conventional approach. Additionally, the same analysis was performed on the subsamples of patients with perfusion defects (TPDconv > 5) at rest or stress.
Finally, the agreement between quantitative measurements from repeated studies was calculated and compared, for every parameter, as a function of whether conventional or grouped processing was used. To clarify, while the analyses in the previous paragraph averaged the results from the back-to-back studies and evaluated if grouped processing introduced systematic biases, the current analysis compared the results for study 1 to those for study 2, and evaluated if grouped quantification made those results more consistent compared to conventional quantification. This was done by computing, for every patient and for every parameter D, the difference between quantitative values of that parameter measured in every pair of back-to-back studies using both the conventional and the grouped quantification approach, according to the following equations:
| (3) |
| (4) |
As before, the mean (bias) and standard deviation of Dconv and DSPP across the 100 patients were then calculated for every parameter and each of the four imaging categories (rest, stress, gated rest and gated stress).
Statistical analysis
Linear regression, Pearson correlation analysis, and the Bland-Altman method were employed to determine the agreement between quantitative measurements of corresponding parameters from repeated studies. The repeatability coefficient (RC), defined as 1.96 × standard deviation (SD) of the differences between pairs of repeated measures, was also calculated10. After using the Shapiro-Wilk test to verify that the differences between repeated measurements were not normally distributed, the Levene test was used to assess whether the grouped processing approach resulted in significantly lower variances for the repeated quantitative measurements, compared to conventional quantification. The non-parametric Wilcoxon signed-ranks test was used to compare the biases (average difference between repeated measurements) using conventional and SPP quantification. All statistical tests were performed in Microsoft Excel 2010 using the Real Statistics Resource Pack add-in11, with a probability value <0.05 considered statistically significant.
RESULTS
As Table 2 shows, the use of grouped quantification did not cause a statistically significant difference in the means and standard deviations of the quantitative measurements of any of the LV perfusion or function parameters, as far as the overall 100-patient population is concerned. This finding holds true even when one limits the analysis to patients with perfusion defects at stress (n=27) or rest (n=12), defined as TPD(str)>5 and TPD(rst)>5, respectively (Table 3).
Table 2.
Mean and standard deviation of the quantitative values (averaged over two back-to-back studies, see equations (1) and (2)) of all parameters studied, analyzed with the standard approach (Pconv) and the grouped (PSPP, same-patient processing) approach in all 100 patients.
| Standard quantification (Pconv) | Grouped quantification (PSPP) | |
|---|---|---|
| mean ± SD | mean ± SD | |
| Vol (str) | 74.6±33.0 ml | 73.3±32.6 ml |
| Vol (rst) | 78.7±34.0 ml | 74.9±33.3 ml |
| TPD (str) | 5.44±8.55 % | 5.52±8.75 % |
| TPD (rst) | 3.03±6.9 % | 3.05±6.9 % |
| EDV (str) | 96.8±38.0 ml | 97.3±38.0 ml |
| EDV (rst) | 101.2±39.0 ml | 98.8±38.3 ml |
| ESV (str) | 40.3±26.7 ml | 42.1±27.1 ml |
| ESV (rst) | 44.6±27.5 ml | 43.5±27.3 ml |
| EF (str) | 60.8±10.9 % | 59.2±10.5 % |
| EF (rst) | 58.5±9.2 % | 58.5±9.2 % |
| Mo TPD (str) | 5.9±13.4 % | 5.9±13.4 % |
| Mo TPD (rst) | 6.9±9.7 % | 5.6±9.8 % |
| Th TPD (str) | 2.6±5.6 % | 2.7±5.8 % |
| Th TPD (rst) | 2.9±4.3 % | 2.9±4.5 % |
Str=stress, Rst=rest, Vol=ungated LV cavity volume, TPD=total perfusion deficit, EDV=end-diastolic volume, ESV=end-systolic volume, EF=ejection fraction, Mo TPD=total motion deficit, Th TPD=total thickening deficit. P=NS for all parameters.
Table 3.
Mean and standard deviation of the quantitative values (averaged over two back-to-back studies, see equations (1) and (2)) of all parameters studied, analyzed with the standard approach (Pconv) and the grouped (PSPP, same-patient processing) approach in patients with perfusion defects (defined as TPD>5% at rest or stress).
| Standard quantification (Pconv) | Grouped quantification (PSPP) | |
|---|---|---|
| mean ± SD | mean ± SD | |
| TPD(str)>5 [n=27] | ||
| Vol | 90.5±47.0 ml | 88.3±46.6 ml |
| TPD | 14.9±11.9 % | 15.2±12.2 % |
| EDV | 114.9±53.1 ml | 114.6±53.0 ml |
| ESV | 55.1±41.7 ml | 56.3±42.3 ml |
| EF | 55.6±13.8 % | 54.4±13.7 % |
| Mo TPD | 15.0±21.0 % | 15.0±21.2 % |
| Th TPD | 6.6±9.2 % | 6.9±9.5 % |
| TPD(rst)>5 [n=12] | ||
| Vol | 118.8±53.1 ml | 116.5±54.1 ml |
| TPD | 16.4±13.9 % | 16.5±13.5 % |
| EDV | 147.9±61.8 ml | 146.0±61.1 ml |
| ESV | 82.0±52.5 ml | 80.9±53.1 ml |
| EF | 48.2±11.6 % | 48.5±12.1 % |
| Mo TPD | 22.1±17.4 % | 21.2±18.0 % |
| Th TPD | 9.8±8.6 % | 10.3±9.2 % |
Str=stress, Rst=rest, Vol=ungated LV cavity volume, TPD=total perfusion deficit, EDV=end-diastolic volume, ESV=end-systolic volume, EF=ejection fraction, Mo TPD=total motion deficit, Th TPD=total thickening deficit. P=NS for all parameters.
Overall, the agreement (repeatability) of quantitative measurements obtained applying the conventional algorithm to back-to-back studies was generally very good for all global parameters of perfusion and function, both at rest and at stress (Table 4, left). However, use of the grouped quantification approach resulted in significantly lower differences between repeated measurements of stress ungated volumes (1.40±2.76 ml vs. 3.33±5.06 ml, p<0.05), end-diastolic volumes (1.78±2.78 ml vs. 3.49±5.35 ml, p<0.05), end-systolic volumes (1.17±1.96 ml vs. 2.44±3.35 ml, p<0.05) and LVEFs (−0.45±2.29% vs. −1.16±3.30%, p<0.05). Additionally, grouped quantification resulted in better repeatability (lower repeatability coefficient) for stress and rest ungated volumes (5.4 vs 9.9 and 5.2 vs. 13.1, respectively), stress TPD (2.6 vs. 3.6), stress and rest end-diastolic volumes (5.5 vs. 10.5 and 7.2 vs. 14.7, respectively), stress and rest end-systolic volumes (3.8 vs. 6.6 and 5.3 vs. 10.3, respectively), stress and rest LVEFs (4.5 vs. 6.5 and 4.7 vs. 8.2, respectively), and rest total motion deficit (5.6 vs. 9.6) (Table 4, right).
Table 4.
Repeatability of quantitative measurements of perfusion and function parameters for repeated, back to back studies analyzed with the standard approach (Dconv) and the grouped (DSPP, same-patient processing) approach (see equations (3) and (4)). Bias=average difference between repeated measurements, Pearson’s R = correlation of Qconv(study 1) and Qconv(study 2), or QSPP(study 1) and QSPP(study 2).
| Standard quantification (Dconv) | Grouped quantification (DSPP) | |||||
|---|---|---|---|---|---|---|
| Bias ± SD | Pearson’s R | RC | Bias ± SD | Pearson’s R | RC | |
| Vol (str) | 3.33±5.06 | 0.988 | 9.9 | 1.40±2.76# | 0.996 | 5.4* |
| Vol (rst) | 1.39±6.68 | 0.981 | 13.1 | 0.75±2.66 | 0.997 | 5.2* |
| TPD (str) | −0.07±1.85 | 0.977 | 3.6 | 0.06±1.34 | 0.988 | 2.6* |
| TPD (rst) | −1.65±1.53 | 0.976 | 3.0 | −1.55±1.45 | 0.978 | 2.8 |
| EDV (str) | 3.49±5.35 | 0.990 | 10.5 | 1.78±2.78# | 0.997 | 5.5* |
| EDV (rst) | 2.02±7.51 | 0.984 | 14.7 | 0.98±3.67 | 0.996 | 7.2* |
| ESV (str) | 2.44±3.35 | 0.992 | 6.6 | 1.17±1.96# | 0.997 | 3.8* |
| ESV (rst) | 1.35±5.24 | 0.983 | 10.3 | 0.67±2.69 | 0.995 | 5.3* |
| EF (str) | −1.16±3.30 | 0.955 | 6.5 | −0.45±2.29# | 0.977 | 4.5* |
| EF (rst) | −0.43±4.19 | 0.903 | 8.2 | −0.36±2.38 | 0.968 | 4.7* |
| Mo TPD (str) | 0.30±4.57 | 0.944 | 9.0 | 0.01±3.36 | 0.970 | 6.6 |
| Mo TPD (rst) | 0.01±4.92 | 0.881 | 9.6 | 0.02±2.88 | 0.958 | 5.6* |
| Th TPD (str) | 0.15±2.02 | 0.936 | 4.0 | −0.01±1.70 | 0.959 | 3.3 |
| Th TPD (rst) | −0.12±2.09 | 0.888 | 4.1 | 0.11±1.66 | 0.934 | 3.3 |
Str=stress, Rst=rest, Vol=ungated LV cavity volume, TPD=total perfusion deficit, EDV=end-diastolic volume, ESV=end-systolic volume, EF=ejection fraction, Mo TPD=total motion deficit, Th TPD=total thickening deficit. * (RC) and # (bias) p<0.05 vs standard quantification.
Figure 1 shows Bland-Altman plots of the differences between repeated measurements for three representative parameters (stress ungated volumes, TPD and LVEFs), and demonstrates that grouped quantification effectively reduces differences by compressing them in a tighter range and closer to the y=0 line, as verified by the Levene test. Figure 2 shows automatically generated contours for back-to-back stress and back-to-back rest images of a normal patient from this study’s population, and demonstrates that same-patient processing reduces the LV cavity volumes range from 51–87 ml to 57–73 ml – of note, differences amongst volumetric values are reduced but not eliminated, since the goal of grouped quantification is to make contours more consistent, not identical. Figure 3 shows a patient for whom TPDs measured by standard quantification in the back-to-back stress studies (8% vs. 3%) would be judged to be abnormal and normal, respectively, according to standard classification12, whereas grouped quantification (6% vs. 7%) would place both in the same abnormal category.
Figure 1.
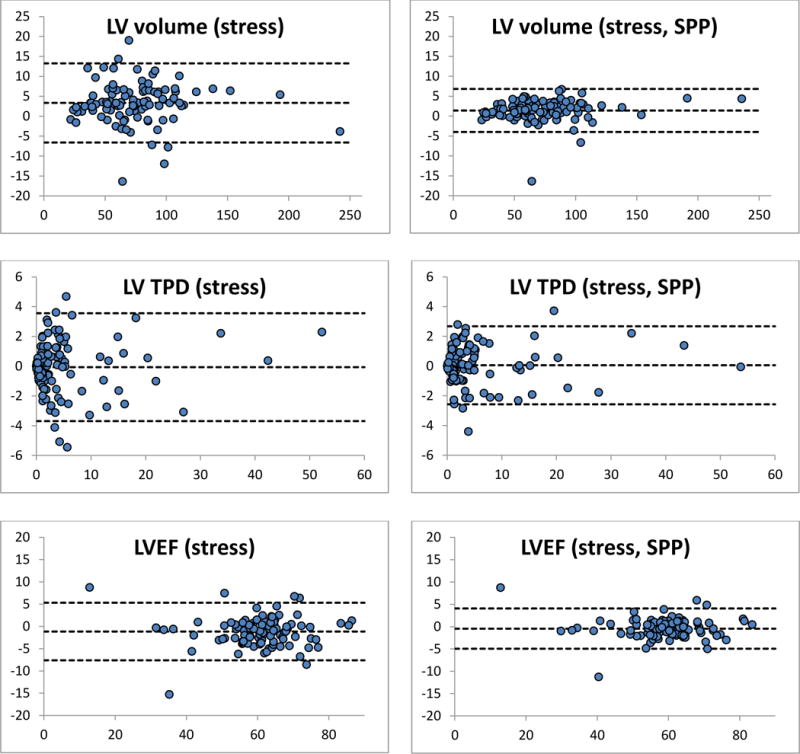
Bland-Altman plots of the differences between quantitative measurements of LV cavity volume, total perfusion deficit and LVEFs for repeated, back to back studies. Quantitative differences shown on the left were obtained using the conventional QGS/QPS algorithm, while those on the right were obtained using the new, same-patient processing (SPP) approach also referred to as grouped quantification. Units are ml for volumes, % myocardium for TPD and % for LVEF. All differences between repeated measurements (y-axes) are plotted against the mean of the repeated measurements (x-axes). Note that the top and bottom dashed lines in every graph define the area within which 95% of the differences fall, and are therefore a visual expression of the repeatability coefficient, demonstrating better repeatability for SPP.
Figure 2.
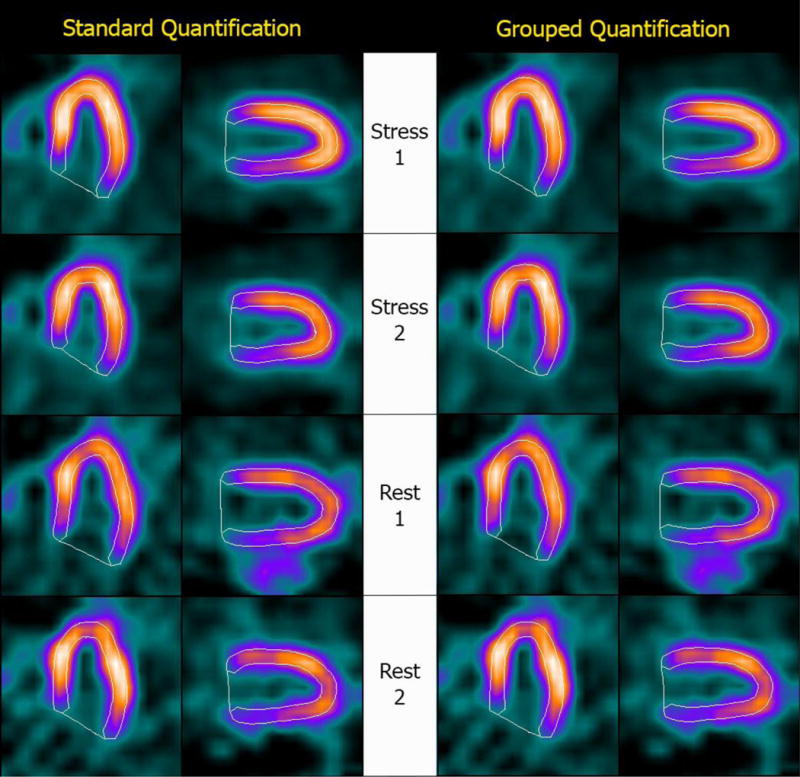
Automatically generated contours for (top to bottom) back-to-back stress and back-to-back rest images of a normal patient. The image datasets were processed (Left) separately, using a standard version of Cedars-Sinai’s quantitative cardiac software, and (Right) as a group, using a modified version of the software that allows implementation of the “same-patient processing” approach. Measured LV cavity volumes were (top to bottom) 63 ml, 51 ml, 87 ml and 67 ml for standard quantification and 63 ml, 57 ml, 73 ml and 66 ml for grouped quantification, demonstrating a tighter range of values with SPP.
Figure 3.
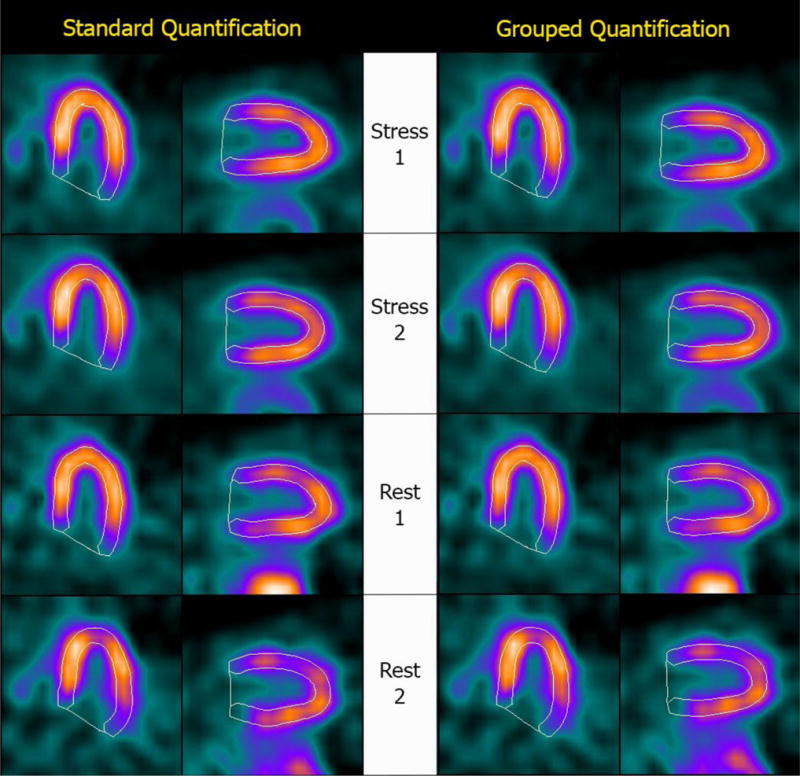
Automatically generated contours for (top to bottom) back-to-back stress and back-to-back rest images of a patient with mild perfusion abnormality at stress. The image datasets were processed (Left) separately, using a standard version of Cedars-Sinai’s quantitative cardiac software, and (Right) as a group, using a modified version of the software that allows implementation of the “same-patient processing” approach. Measured TPDs were (top to bottom) 8%, 3%, 1% and 1% for standard quantification and 6%, 7%, 1% and 1% for grouped quantification – consequently, grouped quantification would correctly classify both stress studies as abnormal, while standard quantification would classify Stress 2 as normal.
DISCUSSION
Repeatability of SPECT MPI measurements is the critical factor in determining whether a measured change observed on serial studies represents a true change in the patient. It is a necessary factor in terms of clinical assessment of interval change and central to potential alteration of management that might occur based on the repeated examination. Indeed, serial SPECT MPI has been used in a large number of clinical trials investigating changes in myocardial ischemia following medical therapy, coronary revascularization or investigational therapies promoting neovascularization13. The present study demonstrates that repeatability of measurements of myocardial perfusion and function assessed by SPECT MPI is significantly improved with the same-patient processing approach.
The conventional automated processing and quantification of nuclear cardiac images through standard software5,14–15 is generally considered to have very good repeatability, as demonstrated in the left portion of Table 4 for the Cedars-Sinai standard algorithm. Other investigators employing the same algorithm have reported findings similar to those in the current study in a separate 50-patient population undergoing back-to-back post-stress SPECT MPI – specifically, they found that LVEF measurements obtained using the standard version of Cedars-Sinai’s quantitative cardiac software had a mean difference between EF1 and EF2 of 1.6±3.85 EF units with a repeatability coefficient of 7.5 EF units16, a result quite comparable with what we found for EF (str) in the current study when using conventional processing (Table 4).
An assessment of repeatability of TPD and EF in the same population studied in this manuscript has been previously described by our group (and referred to as “reproducibility” in the prior manuscript)17. Several methodological differences should be noted with regards to data processing as compared to that prior study. In the previous study, short axis gated and ungated data used for the analysis of repeatability were reconstructed on the GE workstation using GE’s reconstruction and reorientation software, as typically used for clinical assessment. There was some manual operator input associated with the reorientation and zoom, and reconstructed field of view could potentially differ between the scans, resulting in some variability in measurements due to minor “truncation” of the left ventricle. Further, in the prior study manual correction of contours and valve plane was used before quantification in 19% of the ungated and 21% of the gated datasets17. In the current study, all data were re-reconstructed and reoriented from original raw projection data using Cedars-Sinai’s automated reconstruction and reorientation software4, in order to eliminate any potential truncation effects; also, no manual contour corrections were allowed for the reconstructed images. Therefore, unlike in the previous study, human intervention during contour adjustment could not have played a role in any of the reported repeatability results.
With respect to software and algorithms developed by other groups15, the repeatability of quantitative measurements of perfusion and function has been investigated and reported by Mahmarian et al as part of the ADVANCE MPI 2 trial18. In one arm of that study, repeated adenosine SPECT MPI acquisitions were performed within 4 weeks of each other in 260 patients who had no change in their clinical status or cardiac medications between the two acquisitions. The investigators found that the difference in serial measurements of perfusion defect size was −0.13±4.16% of the LV, with a repeatability coefficient of 8.15%. With respect to global LV function, the differences between serial measurements of EF, EDV and ESV were 0.15±3.5 EF units, −1.82±12.17 ml and −1.6±7.14 ml, respectively, with corresponding repeatability coefficients of 6.86 EF units, 23.85 ml and 14 ml. Considering the up to 4 week interval between serial acquisitions in the ADVANCE 2 trial, as opposed to the back-to-back acquisitions without patient repositioning in the current study, we consider these slightly worse findings to be comparable to those we experienced using our own standard quantitative software (Table 4, left).
Even though the repeatability of quantitative measurements using standard software and conventional processing is generally good, improving repeatability is desirable because it will increase the ability to clinically detect significant changes in myocardial perfusion and function – for example, a decline in LVEF at stress compared to the rest LVEF that could suggest stunning, or an increase in TPD measured in serial studies that could imply disease progression. The repeatability coefficient can be viewed as a measure of the smallest amount by which two measurements must differ in order for that difference to be judged significant, and improving repeatability was the objective of the same-patient or grouped processing approach described in this manuscript. An initial implementation of grouped processing, previously reported as “paired processing”, had been applied to serial imaging and had been reported to result in improved repeatability of cardiac function measurements19. That original application was aimed at improving the consistency between pairs of repeated scans, but now the concept has been extended to a potentially unlimited number of scans belonging to the same patient.
A potential concern is that same-patient processing, while improving the consistency of measurements from studies that are not supposed to be different, may reduce our ability to detect real changes that may have occurred, for example, in patients who have suffered an infarct or undergone revascularization between serial studies. This concern is lessened by considering that the goal of grouped processing and grouped quantification is not that of minimizing differences per se6. Indeed, as demonstrated in Figures 2–3, three-dimensional contours from different studies of a same patient are not made to fit a common template, so that shape and size differences are substantially preserved. Future investigation will address validating the same-patient processing approach in a clinical population in which serial changes are known to have occurred and can be independently measured.
Although investigation of this topic was not a focus of the current study, the same-patient processing approach and grouped quantification are expected to significantly reduce the number of instances in which manual correction of software-generated contours is needed, particularly at the valve plane, where different injected doses and patient acquisition stances may produce count profiles that mislead most quantitative algorithms. Figure 4 shows one such example from our clinic (the patient was not part of the study’s population), with valve plane location inconsistencies between supine and prone images substantially reduced by employing grouped processing.
Figure 4.
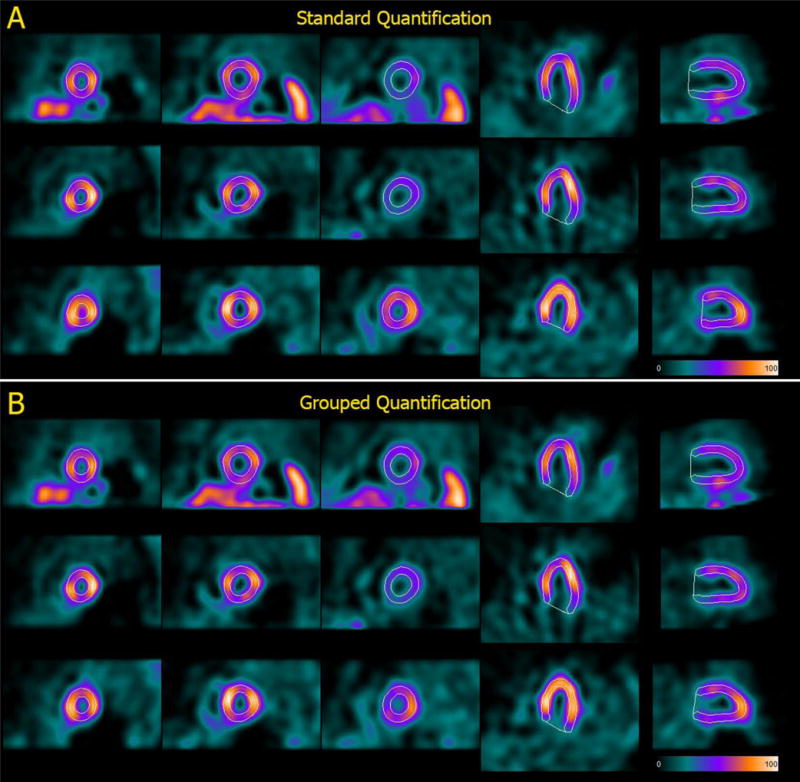
Automatically generated contours for (top to bottom) rest, supine stress and prone stress images belonging to back-to-back studies of the same patient processed A) individually, using the standard Cedars-Sinai quantitative cardiac software, and B) as a group, using a modified version of the software that allows to implement the “same-patient processing” approach. Of note, LV cavity volumes are (top to bottom) 73 ml, 66 ml and 47 ml for standard quantification and 68 ml, 65 ml and 58 ml for grouped quantification, demonstrating that the same-patient processing approach is not meant to equalize volumes regardless of image characteristics.
Reproducibility and repeatability
This paper’s nomenclature for reproducibility and repeatability, with respect to nuclear cardiology studies’ assessment and quantification, is different from that endorsed by the American Society for Testing and Materials (ASTM International) with respect to standard test methods20. While the ASTM terminology is commonly used in medical literature21, including our own group17, the increasingly fully automated, “push-button” nature of quantitative software used in nuclear cardiology makes it virtually meaningless to evaluate the agreement between results produced by separate “button pushes” on the same dataset, or repeatability as defined by the ASTM. Consequently, in this and other papers19,22–24 the main author has chosen to repurpose the term “repeatability” to emphasize that the process producing the nuclear cardiology study to be analyzed has been repeated, or in other words that there exist two (or more) such studies. The use of repeatability in this manner allows “reproducibility” to denote reproducing the results of the analysis (quantitative or not) of a given nuclear cardiology study by the same operator (intra-observer) or different operators (inter-observer). In this context, reproducibility is by definition perfect if the analysis is completely automated. Since repeatability and reproducibility combine to determine the precision of a measurement, one needs not worry about their relative contribution, as long as they are explicitly defined.
CONCLUSION
Group processing of image datasets belonging to a patient improves the repeatability of quantitative measurements of parameters of myocardial perfusion and function derived from the patient’s SPECT MPI studies. This application of the same-patient processing approach is an extension of the “paired processing” technique already described by our group, and can be performed in automated fashion through incorporation in the quantitative algorithm.
NEW KNOWLEDGE GAINED.
The concept that quantifying different image datasets of a same patient as a group can result in better repeatability of quantification was described and tested in a large patient population with back-to-back studies (100 patients, 800 datasets). We learned that this “same-patient processing” approach did result in significantly lower differences between, and better repeatability of, several quantitative measurements of global LV perfusion and function, particularly in stress images. This new knowledge can easily be incorporated in existing automated image quantification algorithms.
Acknowledgments
This research was supported in part by Grant R01HL089765 from the National Heart, Lung, and Blood Institute/National Institutes of Health (NHLBI/NIH). Its contents are solely the responsibility of the authors and do not necessarily represent the official views of the NHLBI/NIH.
ABBREVIATIONS
- SPP
Same-patient processing
- SPECT
Single photon emission computed tomography
- MPI
Myocardial perfusion imaging
- LV
Left ventricle
- TPD
Total perfusion deficit
- LVEF
Left ventricular ejection fraction
- EDV
End-diastolic volume
- ESV
End-systolic volume
- Mo TPD
Total motion deficit
- Th TPD
Total thickening deficit
References
- 1.Germano G, Kavanagh P, Fish M, Lemley M, Xu Y, Berman D, et al. “Same-Patient Processing” for multiple cardiac SPECT studies. 1. Improving LV segmentation accuracy. Journal of Nuclear Cardiology. 2016 doi: 10.1007/s12350-016-0673-2. submitted. [DOI] [PMC free article] [PubMed] [Google Scholar]
- 2.Ali I, Ruddy TD, Almgrahi A, Anstett FG, Wells RG. Half-Time SPECT Myocardial Perfusion Imaging with Attenuation Correction. Journal of Nuclear Medicine. 2009;50:554–562. doi: 10.2967/jnumed.108.058362. [DOI] [PubMed] [Google Scholar]
- 3.Hansen C, Goldstein R, Akinboboye O, Berman D, Botvinick E, Churchwell K, et al. Myocardial perfusion and function: single photon emission computed tomography. Journal of Nuclear Cardiology. 2007;14:e39–e60. doi: 10.1016/j.nuclcard.2007.09.023. [DOI] [PubMed] [Google Scholar]
- 4.Germano G, Kavanagh PB, Chen J, Waechter P, Su HT, Kiat H, et al. Operator-less processing of myocardial perfusion SPECT studies. J Nucl Med. 1995;36:2127–2132. [PubMed] [Google Scholar]
- 5.Germano G, Kavanagh PB, Slomka PJ, Van Kriekinge SD, Pollard G, Berman DS. Quantitation in gated perfusion SPECT imaging: The Cedars-Sinai approach. J Nucl Cardiol. 2007;14:433–454. doi: 10.1016/j.nuclcard.2007.06.008. [DOI] [PubMed] [Google Scholar]
- 6.Slomka PJ, Nishina H, Berman DS, Kang XP, Friedman JD, Hayes SW, et al. Automatic quantification of myocardial perfusion stress-rest change: A new measure of ischemia. Journal of Nuclear Medicine. 2004;45:183–191. [PubMed] [Google Scholar]
- 7.Slomka PJ, Hurwitz GA, St Clement G, Stephenson J. Three-dimensional demarcation of perfusion zones corresponding to specific coronary arteries: application for automated interpretation of myocardial SPECT. J Nucl Med. 1995;36:2120–2126. [PubMed] [Google Scholar]
- 8.Slomka PJ, Hurwitz GA, Stephenson J, Cradduck T. Automated alignment and sizing of myocardial stress and rest scans to three-dimensional normal templates using an image registration algorithm [see comments] J Nucl Med. 1995;36:1115–1122. [PubMed] [Google Scholar]
- 9.Slomka PJ, Nishina H, Berman DS, Akincioglu C, Abidov A, Friedman J, et al. Automated quantification of myocardial perfusion SPECT using simplified normal limits. J Nucl Cardiol. 2005;12:66–77. doi: 10.1016/j.nuclcard.2004.10.006. [DOI] [PubMed] [Google Scholar]
- 10.Bland JM, Altman DG. Applying the right statistics: analyses of measurement studies. Ultrasound in Obstetrics & Gynecology. 2003;22:85–93. doi: 10.1002/uog.122. [DOI] [PubMed] [Google Scholar]
- 11.Zaiontz C. Real Statistics Using Excel. http://www.real-statistics.com (accessed Jul 2016)
- 12.Berman DS, Kang XP, Gransar H, Gerlach J, Friedman JD, Hayes SW, et al. Quantitative assessment of myocardial perfusion abnormality on SPECT myocardial perfusion imaging is more reproducible than expert visual analysis. J Nucl Cardiol. 2009;16:45–53. doi: 10.1007/s12350-008-9018-0. [DOI] [PMC free article] [PubMed] [Google Scholar]
- 13.Iskandrian AE, Hage FG, Shaw LJ, Mahmarian JJ, Berman DS. Serial Myocardial Perfusion Imaging. Defining a Significant Change and Targeting Management Decisions. JACC-Cardiovasc Imag. 2014;7:79–96. doi: 10.1016/j.jcmg.2013.05.022. [DOI] [PubMed] [Google Scholar]
- 14.Garcia EV, Faber TL, Cooke CD, Folks RD, Chen J, Santana C. The increasing role of quantification in clinical nuclear cardiology: The Emory approach. J Nucl Cardiol. 2007;14:420–432. doi: 10.1016/j.nuclcard.2007.06.009. [DOI] [PubMed] [Google Scholar]
- 15.Ficaro EP, Lee BC, Kritzman JN, Corbett JR. Corridor4DM: The Michigan method for quantitative nuclear cardiology. J Nucl Cardiol. 2007;14:455–465. doi: 10.1016/j.nuclcard.2007.06.006. [DOI] [PubMed] [Google Scholar]
- 16.Kliner D, Wang L, Winger D, Follansbee WP, Soman P. A prospective evaluation of the repeatability of left ventricular ejection fraction measurement by gated SPECT. J Nucl Cardiol. 2015;22:1237–1243. doi: 10.1007/s12350-015-0071-1. [DOI] [PubMed] [Google Scholar]
- 17.Xu YA, Hayes S, Ali I, Ruddy TD, Wells RG, Berman DS, et al. Automatic and visual reproducibility of perfusion and function measures for myocardial perfusion SPECT. J Nucl Cardiol. 2010;17:1050–1057. doi: 10.1007/s12350-010-9297-0. [DOI] [PMC free article] [PubMed] [Google Scholar]
- 18.Mahmarian JJ, Cerqueira MD, Iskandrian AE, Bateman TM, Thomas GS, Hendel RC, et al. Regadenoson Induces Comparable Left Ventricular Perfusion Defects as Adenosine. A Quantitative Analysis From the ADVANCE MPI 2 Trial. JACC-Cardiovasc Imag. 2009;2:959–968. doi: 10.1016/j.jcmg.2009.04.011. [DOI] [PubMed] [Google Scholar]
- 19.Germano G, Kavanagh PB, Slomka PJ, Berman DS. Tracking a therapeutic response: How reliable are serial measurements of LV perfusion and function? J Nucl Cardiol. 2012;19:360–363. doi: 10.1007/s12350-012-9518-9. [DOI] [PMC free article] [PubMed] [Google Scholar]
- 20.American Society for Testing and Materials (ASTM International) What Are Repeatability and Reproducibility? http://www.astm.org/SNEWS/MA_2009/datapoints_ma09.html (accessed Jul 2016)
- 21.Bartlett JW, Frost C. Reliability, repeatability and reproducibility: analysis of measurement errors in continuous variables. Ultrasound in Obstetrics & Gynecology. 2008;31:466–475. doi: 10.1002/uog.5256. [DOI] [PubMed] [Google Scholar]
- 22.Germano G, Kavanagh PB, Kavanagh JT, Wishner SH, Berman DS, Kavanagh GJ. Repeatability of automatic left ventricular cavity volume measurements from myocardial perfusion SPECT. J Nucl Cardiol. 1998;5:477–483. doi: 10.1016/s1071-3581(98)90178-7. [DOI] [PubMed] [Google Scholar]
- 23.Germano G, Berman D. Quantification of ventricular function. In: Germano G, Berman D, editors. Clinical gated cardiac SPECT Ed 2. Oxford, UK: Blackwell Publishing; 2006. pp. 93–137. [Google Scholar]
- 24.Germano G, Berman D. Gated single-photon emission computed tomography. In: Iskandrian AE, Garcia EV, editors. Nuclear cardiac imaging: principles and applications Ed 4. New York: Oxford University Press; 2008. pp. 161–183. [Google Scholar]