Abstract
A critical aspect for use of nanoprobes in biomedical research and clinical applications involves fundamental spatial and temporal characterization of their uptake and distribution in cells. Raman spectroscopy and two-dimensional Raman imaging were used to identify and locate nanoprobes in single cells using surface-enhanced Raman scattering detection. To study the efficiency of cellular uptake, silver nanoparticles functionalized with three different positive-, negative-, and neutrally charged Raman labels were co-incubated with cell cultures and internalized via normal cellular processes. The surface charge on the nanoparticles was observed to modulate uptake efficiency, demonstrating a dual function of the surface modifications as tracking labels and as modulators of cell uptake. These results indicate that the functionalized nanoparticle construct has potential for sensing and delivery in single living cells and that use of surface-enhanced Raman scattering for tracking and detection is a practical and advantageous alternative to traditional fluorescence methods.
Keywords: Nanoprobes, Cellular uptake, Surface-enhanced Raman scattering, Raman spectroscopy, Nanoparticles
Development of delivery and tracking methods for intracellular nanoprobes is important for the application of nanosensors in biomedical research and for evaluation of the environmental effects of nanomaterials. Use of nanobiosensors in early detection of disease and subsequent targeting of treatments may result in more successful patient outcomes and reduce treatment side effects.1,2 Additionally, nanoprobes can be used to study the effects of potentially harmful substances (e.g., chemical pollutants, nanoparticulate matter, environmental toxins) that can directly or indirectly affect cellular processes such as DNA damage/mutation and repair, cell division and differentiation, necrosis and apoptosis, and other molecular changes that occur on the single-cell level.3 In general, the introduction of nanomaterials to the biomedical sciences has made it possible to design, produce, and utilize nanoprobes and biodelivery vehicles that are small enough to probe the inner workings of and deliver cargo to single living cells as well as their intracellular compartments.4 Miniaturization via nanomaterials has also improved the speed and efficiency of bioassay and measurement techniques, requiring smaller samples, smaller amounts of reagents, and less processing, enabling rapid interrogation and lowering the limits of detection.5 These methods take advantage of the specific characteristics of nanostructures, which exhibit unique properties not present in the bulk matter. Many nanoparticles used in biological applications contain a central core that gives a particular fluorescence, electronic, optical, or magnetic signal that can be detected via spectroscopic methods, which are generally noninvasive and nonionizing.
In recent years, fluorescence techniques have allowed researchers to track and study the paths taken by individual targets within tissues and even inside single living cells. However, fluorescence techniques have intrinsic limitations, such as emission with broad spectral bandwidths (which limit the potential for multiplexed detection and tracking), photo-bleaching with repeated interrogation, and the inability to differentiate fluorophores from intrinsic cellular fluorescence. One means of partially circumventing these limitations is to use highly efficient solid-state fluorophores such as quantum dots; however, this method suffers from toxicity concerns,6 limiting its applicability in clinical methods. An alternative approach that possesses the added strength of allowing increased multiplexing is surface-enhanced Raman spectroscopy (SERS). The width of well-defined peaks in SERS is typically very narrow (<1 nm), and chemical modifications can be leveraged to give different types of nanoparticles unique spectroscopic fingerprints. In addition, SERS is well suited to intracellular delivery using nanoparticles functionalized with a biosensor modality designed to interact with specific antibodies, proteins, DNA/RNA sequences, and intracellular proteins, the spectral signatures of which are well known.4 SERS-active nanomaterials with biosensitive functionality have potential as intracellular probes used to examine the inner workings of single living cells in the interest of basic science research, and to detect markers of disease to aid early diagnosis and to selectively deliver treatments in nanomedicine applications.
Raman spectroscopy is an optical technique that measures the intensity of inelastically scattered light after interaction with molecular structures. This scattered light occurs at frequencies that are shifted from that of the incident light by the energies of molecular vibrations. The vibrational information provided by Raman spectroscopy is very specific for chemical bonds and thus for characteristic structures in molecules; it provides an “optical fingerprint” that can be used to identify a molecule or verify its presence in a sample, cell, or cellular compartment. In conventional Raman spectroscopy, a single point is interrogated and the signal collected at a range of wavelengths, giving a one-dimensional spectrum for a particular location in the sample. The individual peaks within a Raman spectrum are sharp and distinct, as opposed to the broad emission peaks generally observed in a fluorescence spectrum. These narrow Raman peaks allow for simultaneous detection of several different analytes in the same sample, thus providing an important multiplex advantage in sensing, especially in the complex cellular environment. In addition, because the Raman effect is based on scattering rather than absorption and emission, a single excitation source can be used for a wide variety of analytes.
Despite the advantages of Raman spectroscopy, this technique is limited by the inherently low efficiency of Raman scattering. However, Raman scattering efficiency can be enhanced by up to 15 orders of magnitude if the analyte is located near the surface of a noble metal nanostructure, thus amplifying the received signal via surface-enhanced Raman scattering (SERS).7,8 The scattering enhancement arises from intense, localized surface plasmon fields in silver, gold, copper, and other submicron metallic nanostructures. According to classical electromagnetic theory, molecules on or near metal nanostructures experience enhanced fields relative to that of the incident radiation. When a metallic nanostructured surface is irradiated by an incident electromagnetic field (e.g., a laser beam), conduction electrons are displaced into oscillation with a frequency equal to that of the incident light. These oscillating electrons, called “surface plasmons,” produce a secondary electric field, which is added to the incident field. When these oscillating electrons become spatially confined, as is the case for isolated metallic nanostructures or otherwise roughened metallic surfaces (nanostructures), there is a characteristic frequency (the plasmon frequency) at which there is a resonance response of the collective oscillations to the incident field. This condition yields intense localized fields that can interact with molecules in contact with or near the metal surface. In an effect analogous to the “lightning rod” effect, the secondary fields can become concentrated at high curvature points on the nanostructured surface. Surface plasmons have been associated with important practical applications in SERS, and reports have cited SERS enhancements on the order of 1013 for specific structures and analytes, thus demonstrating the potential for single-molecule SERS detection.9,10
Since our first report on the use of SERS for trace analysis,11 our laboratory has devoted extensive efforts to developing SERS techniques and probes for chemical and biological sensing as well as medical diagnostics.12–16 Additionally, other investigators have used gold and other noble metal nanoparticles to enhance the SERS signatures of intracellular components and to monitor cellular changes.17–19 Raman techniques can be used without sample labeling, and Raman imaging has been demonstrated for examination of DNA and protein distributions in apoptotic20 and mitotic cells.21 The majority of these studies have focused on Stokes-shifted Raman scattering; however, coherent anti-Stokes Raman scattering has also been applied to cellular imaging.22 Our own group has used SERS spectroscopy for many applications, including hyperspectral SERS imaging and multispectral imaging.23 We are currently developing several types of plasmonics-active nanoprobes that capitalize on the specificity and selectivity of SERS for biochemical analysis in single living cells, with the eventual goal of single-molecule detection.
The Raman mapping approach utilized in this article applies the spectroscopic technique to two dimensions by recording a full SERS spectrum at discrete grid points over a two- or three-dimensional (2D or 3D) region of a cellular sample. The intensity of a particular Raman band in the spectrum (e.g., a selected peak in the plasmonics-active label spectrum) can be plotted using a color gradient or a series of contours, resulting in an “image map” that shows the location of the nanobiosensors over a selected physical area as a function of their SERS signal intensity at that particular band. Sequential collection of these maps as a function of time can provide important spatial and temporal information that can be used monitor the uptake and internalization of nanoprobes in single cells.
Because optimization of nanoprobe design requires a thorough understanding of the efficiency with which the nanoparticles enter cells, the research described herein is designed to characterize and optimize this process as part of the development of a broad platform of plasmonics-active nanoprobes. Nanoparticles enter the cells through a variety of normal cellular processes during co-incubation in cell culture. The uptake efficiency and localization of these nanoparticles depends on several factors, including size and shape of the nanoparticle, the surface charge, and the particular uptake mechanism (e.g., phagocytosis, receptor-mediated endocytosis) as well as the particular cell line.4,24–29 To specifically target nanoprobes to a particular biochemical target, it is critical to ensure that the nanoprobes are effectively delivered into the interior of the cell. Furthermore, an understanding of the spatiotemporal scales for uptake can yield additional insight regarding fundamental cellular processes and the time window available for targeted treatment or delivery of cargo. In this article we describe the use of SERS spectroscopy to sense and track functionalized nanoparticles in single mammalian cells, with a focus on cellular uptake and spatial mapping of nanoprobes as a function of time. We also investigate the effect of surface charge for modulation of uptake efficiency.
Methods
Nanoparticle synthesis and functionalization
All chemicals were purchased from Sigma-Aldrich (St Louis, Missouri) unless otherwise noted and used as received. Cell culture media and supplements [Dulbecco’s minimal essential medium (DMEM), fetal bovine serum] were purchased from Gibco/Invitrogen (Carlsbad, California). Silver colloidal nanoparticles were prepared by reduction of silver nitrate with hydroxylamine hydrochloride, as previously described.30 Briefly, 10 mL silver nitrate solution at 10−2 M were rapidly added to 90 mL hydroxylamine hydrochloride solution (1.67 × 10⁻³ M) containing 2.22 × 10⁻³ M sodium hydroxide. The average diameter of the silver nanoparticles was measured at approximately 50 nm by transmission electron microscopy. For preparation of the SERS-label molecules, 10 mM stock solutions of 4-mercaptobenzoic acid (4-MBA), 4-aminothiophenol (4-ATP, VWR), and 4-thiocresol (4-TC), were prepared in ethanol. The conjugation of these three label molecules (all thiol derivatives) to silver colloids was carried out following a standard chemical process whereby self-assembled monolayers form via spontaneous adsorption of thiols onto a silver metal surface.31 In brief, the thiols form a dense monolayer on the silver surface with the thiols packing in a trans-zigzag extended structure. The strong silver-sulfur interactions are very stable in liquid environments, and the ability to add surface attachment of specific functional groups with distinct Raman spectra make this process well suited for nanoparticle labeling.
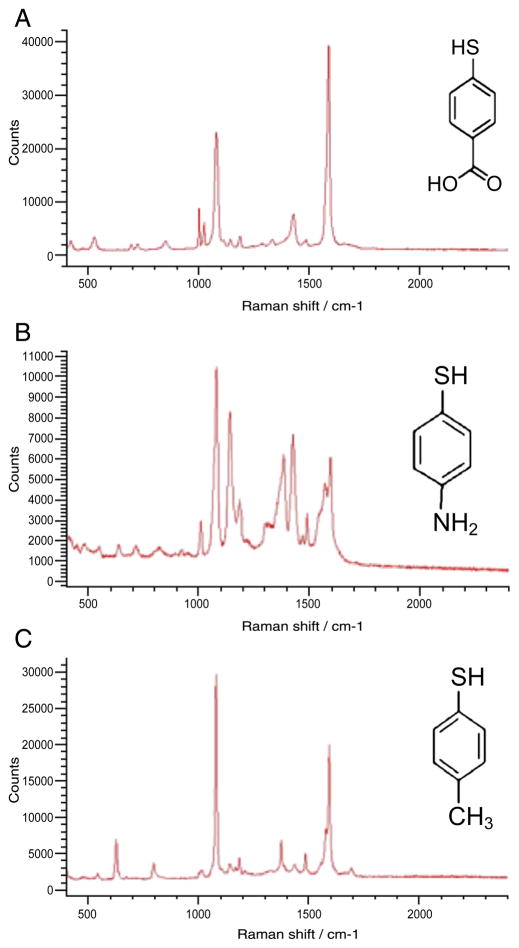
Figure 1 shows the chemical structure of each label molecule and its SERS spectrum in liquid. The three chemical labels chosen, 4-MBA (Figure 1, A), 4-ATP (Figure 1, B), and 4-TC (Figure 1, C), all have Raman signatures showing sharp, distinct spectral peaks, which allow detection and identification in an inhomogeneous environment.
Figure 1.
Chemical structure and SERS spectra of molecular labels conjugated to silver nanoparticles. (A) 4-MBA; (B) 4-ATP; (C) 4-TC.
Cell culture and nanoparticle co-incubation
J774 mouse macrophage cells were obtained from the American Type Culture Collection (Manassas, Virginia) and grown in T-75 flasks using DMEM containing 4 mM L-glutamine, 1.5 g/L sodium bicarbonate, 4.5 g/L glucose, 1.0 mM sodium pyruvate, and additionally supplemented with 10% fetal bovine serum. The stock cultures were kept in a 5% CO2 incubator at 37°C. Cells were grown to 80% confluence and subcultured at a 1:6 split ratio. For experiments, cells were harvested via cell scraping and seeded into 60-mm culture dishes containing 6 mL fresh DMEM and a mica substrate. The mica substrate was previously soaked in 0.01% poly-L-lysine overnight to promote cell adhesion and washed three times with phosphate-buffered saline (PBS) buffer before cell seeding.
Cells were incubated with 100 μL of labeled silver nanoparticle solution seeded into the cell medium, orthogonally mixed, and incubated at 37°C for 2- and 4-hour periods. Cultures of cells alone and cells incubated with unlabeled silver nanoparticles were also prepared as controls. After incubation, cell culture medium was removed via aspiration. Adhered cells were washed three times in cold PBS buffer, then fixed in cold methanol for 10 minutes at 4°C and washed three more times in cold PBS after fixation. The mica substrate containing the fixed cells was removed from the cell culture dish after fixation/washing and mounted to a standard glass microscope slide for data collection.
Raman spectroscopy
Raman spectra and Raman maps were acquired using a Renishaw InVia confocal Raman system coupled to a Leica DM-IRB microscope (Renishaw, Glouchestershire, United Kingdom). A 632.8-nm HeNe laser with a maximum power of 50 mW was used for excitation. WiRE 2.0 software (Renishaw, Glouchestershire, United Kingdom) was used to control the system and to acquire all data. Spectra were collected from 1000 to 1800 cm−1 during a 10-second acquisition. Image maps were constructed by collecting Raman spectra over the previously defined range at each point on a grid with 3-μm spacing defined over a 2D area of an entire cell (or cells) using an automated microscope stage. The detected intensity of a characteristic peak shift in the label spectrum was then displayed at each of the points in the grid according to a color code to show signal intensity variation over the spatial area of the cell, creating an image map. The display scheme chosen for the image maps shows a range of SERS signal intensities on a rainbow-colored continuum: from black (little or no signal intensity) through violet, indigo, blue, green, yellow, orange, and red (highest signal intensity).
Results
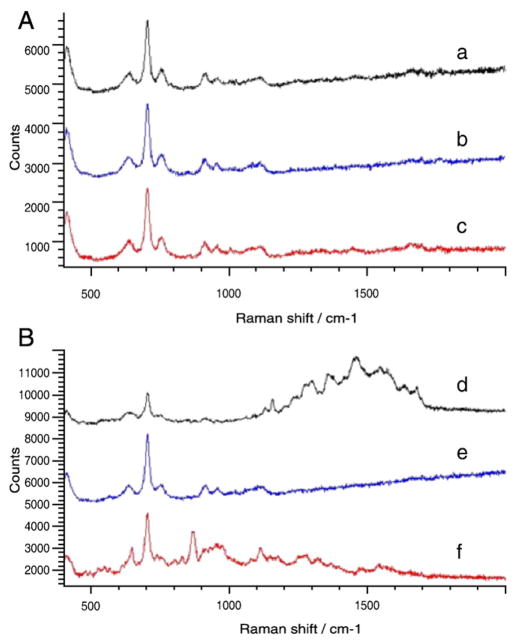
As a baseline, Figure 2, A shows SERS spectra collected from J774 cells on a mica substrate in the absence of nanoparticles. The spectra were taken from three sampled point locations (a, b, c) in a single cell and are shown stacked on a single set of axes for comparison purposes. The mica substrate was chosen because it exhibits little or no background fluorescence (as opposed to glass or plastic) and because its Raman spectrum does not closely overlap that of the cells or SERS labels. The Raman peaks from the mica substrate (seen between 600 and 800 cm−1 in Figure 2, A) are the most pronounced feature in the spectrum of the nanoparticle-free cells, with several smaller peaks associated with cellular components (DNA, RNA, proteins, etc.) occurring between ~1000 and 1700 cm−1.4
Figure 2.
Raman spectra taken from three locations in a sampled J774 cell incubated for 2 hours in the absence (A) and presence (B) of unlabeled silver nanoparticles.
In contrast, Figure 2, B shows the Raman spectra collected from three different locations (d, e, f) in a single J774 cell after incubation with unlabeled silver nanoparticles for 2 hours. The Raman peaks from the mica between 600 and 800 cm−1 remain visible, but the presence of the silver nanoparticles within the cells is observed to enhance the Raman signals from the intracellular DNA, RNA, and proteins in close proximity to the particle surfaces, as seen by the more pronounced peaks in the 1000–1700 cm−1 range of the spectrum taken from location d. Although these molecules are present in cells under all conditions, their Raman scattering intensity can be greatly enhanced by randomly occurring proximity to the plasmonically active nanoparticles due to the SERS effect.
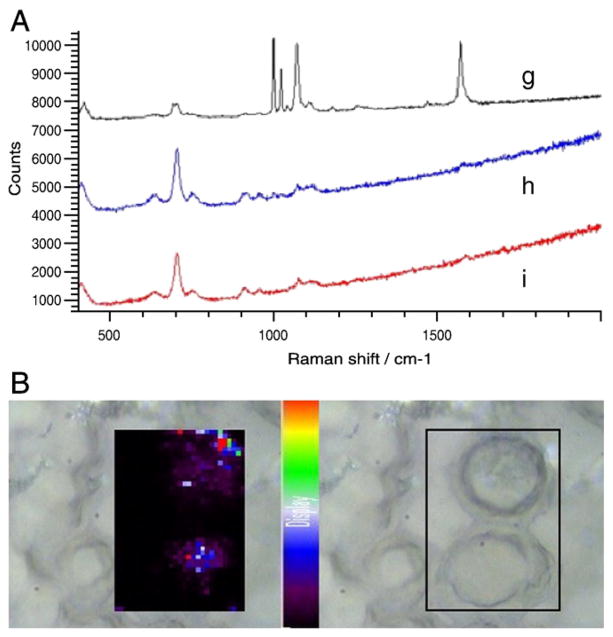
SERS spectra and maps from J774 cells incubated for 2 hours with 4-MBA–labeled silver nanoparticles are shown in Figure 3, A. Spectra from three different locations (g, h, i) in a sampled cell show that only one location exhibits a 4-MBA signal from the labeled nanoparticles (location g). This indicates that the extent of nanoparticle uptake probably remains limited 2 hours after introduction, in that SERS-labeled nano-particles were not detected in other sampled intracellular locations (locations g and h). This observation is further supported by the 2D Raman map in Figure 3, B, which shows the intensity of the characteristic 4-MBA peak at 1586 cm−1. At this time point, Raman signals are present at some locations due to labeled particles that have entered the cells, though only to a limited degree.
Figure 3.
Incubation for 2 hours with 4-MBA–labeled silver nanoparticles. (A) SERS spectra taken from three different locations in a sampled J774 cell. (B) SERS map showing cellular distribution of 4-MBA–labeled silver nanoparticles in J774 cells.
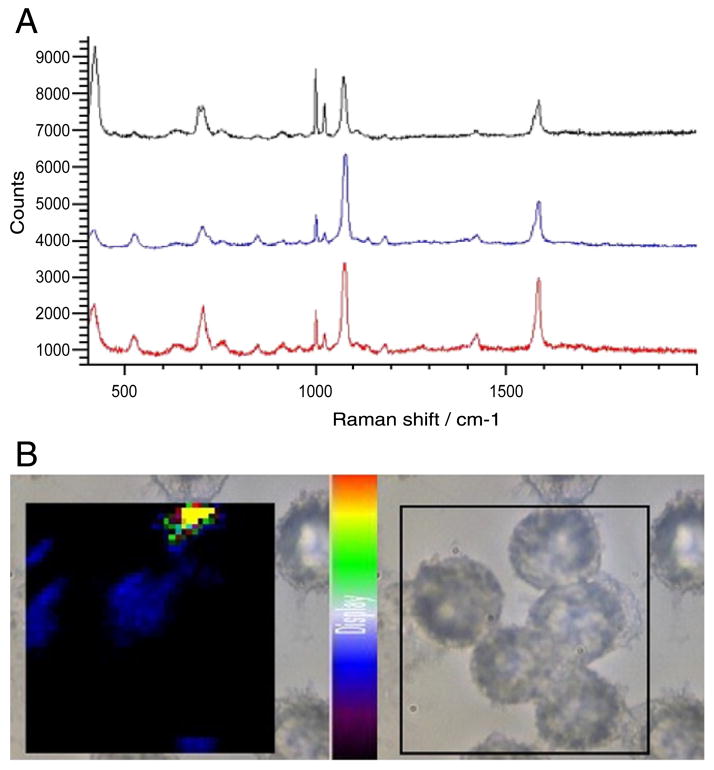
After 4 hours of incubation, both the SERS spectra (Figure 4, A) and SERS map (Figure 4, B) collected from cells incubated with 4-MBA–labeled silver nanoparticles suggest that cellular uptake has progressed, resulting in greater accumulation of nanoparticles throughout the cell interior during the additional 2-hour time period. SERS signals from particle-bound 4-MBA are visible in all three locations sampled (as shown in the spectra) in a single cell, and the Raman map also illustrates the presence of more intense signals coming from locations that correspond to the bulk of the intracellular volume.
Figure 4.
Incubation for 4 hours with 4-MBA–labeled silver nanoparticles. (A) SERS spectra taken from three different locations in a sampled J774 cell. (B) SERS map showing cellular distribution of 4-MBA–labeled silver nanoparticles in J774 cells.
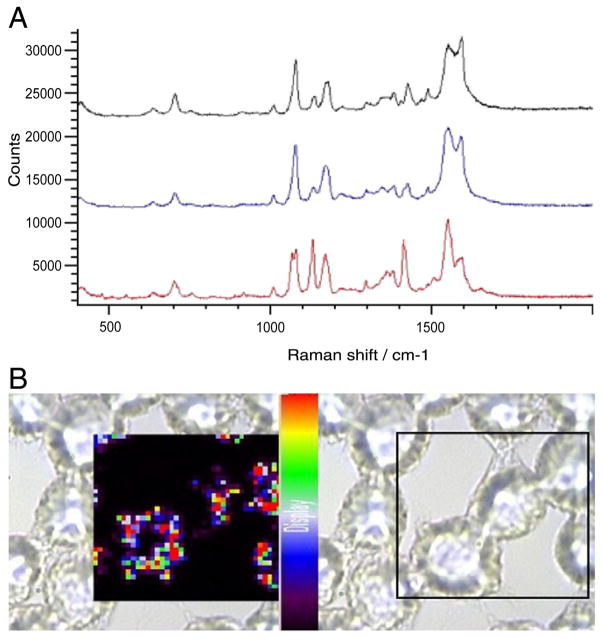
When the same experiment was repeated with 4-ATP–labeled nanoparticles, both the SERS spectra (Figure 5, A) and the SERS map (Figure 5, B) from cells incubated for 2 hours with 4-ATP–labeled silver nanoparticles indicate that the 4-ATP particles are taken up into the cells more efficiently than particles functionalized with 4-MBA. The spectra collected from three locations in a single cell all show intense SERS signals from the 4-ATP label as soon as after 2 hours of co-incubation. In addition, extensive 4-ATP signals can be seen throughout the cells in the Raman map, where the intensity of the 1075 cm−1 characteristic peak of 4-ATP is plotted.
Figure 5.
Incubation for 2 hours with 4-ATP–labeled silver nanoparticles. (A) SERS spectra taken from three sampled locations in a J774 cell. (B) SERS map showing cellular distribution of 4-ATP–labeled silver nanopar-ticles in J774 cells.
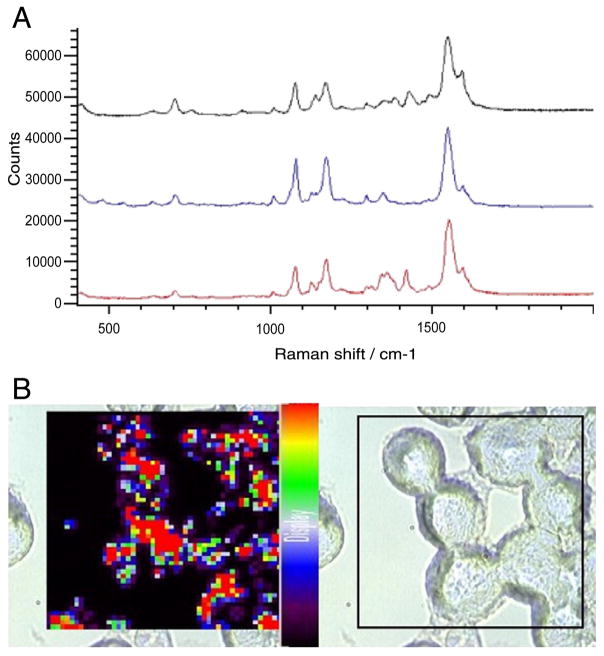
Similar to the observation for 4-MBA–functionalized nanoparticles, the signal intensity from particles functionalized with 4-ATP appears to be stronger and more widely distributed throughout the cellular interior after 4 hours (Figure 6) than at the 2-hour time point. Furthermore, the 2D SERS maps indicate that the label-associated SERS signals are more widely distributed within the cells in the 4-hour map than in the 2-hour map, suggesting that more labeled nanoparticles have entered the cells over the additional 2 hours.
Figure 6.
Incubation for 4 hours with 4-ATP–labeled silver nanoparticles. (A) SERS spectra taken from three sampled locations in a J774 cell. (B) SERS map showing cellular distribution of 4-ATP–labeled silver nanopar-ticles in J774 cells.
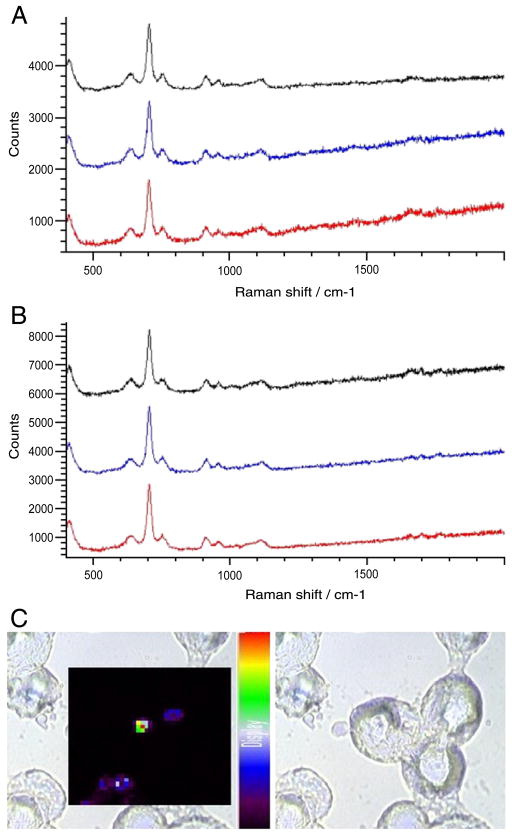
In contrast, Figure 7 shows the results of 2- and 4-hour incubations for silver nanoparticles labeled with neutrally charged 4-TC. After 2 hours, the spectra in Figure 7, A show that labeled nanoparticles are not detected in the three sampled locations, because the spectra are similar to the cell-only control spectra shown in Figure 2, A. Similarly, the SERS map (not shown) also showed an absence of SERS signal from the labeled particles. After 4 hours the spectra in Figure 7, B still do not indicate an appreciable amount of 4-TC–associated signals visible in data collection taken at three locations, comparable to the “absence of nanoparticles” results seen in Figure 2, A. The SERS map plotting the intensity of the 1075 cm−1 4-TC peak in Figure 7, C shows only minor traces of signal from the labeled particles after 4 hours.
Figure 7.
Incubation with 4-TC–labeled silver nanoparticles for 2 and 4 hours. (A) SERS spectra taken from three sampled locations in a J774 cell after 2 hours. (B) SERS spectra taken from three sampled locations in a J774 cell after 4 hours. (C) SERS map showing cellular distribution of 4-TC–labeled silver nanoparticles in J774 cells after incubation for 4 hours.
It is worth noting that the 2- and 4-hour incubations with 4-TC–labeled nanoparticles appear to have resulted not only in limited particle uptake as compared to the case of the 4-MBA–and 4-ATP–labeled particles, but possibly also in reduced cellular uptake over that of the unlabeled particles, which exhibit a slight residual negative charge due to the silver metal surface itself. This reduced uptake efficiency of the 4-TC–labeled nanoparticles probably results from lack of electrostatic interaction with the cell membrane due to the absence of a positive or negative surface charge.
Discussion
For sensing and tracking of biomedically important cellular markers, effective design and use of nanobiosensors require confirmation of their uptake into cells, as well as an awareness of the temporal and spatial scales on which these processes occur.
In this study we have demonstrated the use of surface-enhanced Raman scattering spectroscopy with three different SERS-active labels used to track nanoprobe uptake in mammalian cells. Previous research has indicated that free nanoparticles are removed from the cell surface after incubation by repeated washing,32 and that any remaining particles are either adhered to the cell membrane or reside within the cell itself. Additionally, all spectroscopic data were collected from a z-slice located in the center of the cell, as selected by our confocal Raman spectrometer system, thus ensuring that the signals collected on this plane represent nanoparticles distributed in the interior of the cell. If the nanoparticles were simply adhered to the cell surface (and not internalized), a 2D SERS map of a slice through the center of the cell would show a ring of signal around the edge of the cell indicating the cell membrane and an absence of SERS signal in the interior of the cell. Additionally, the amplified Raman signals from intracellular components (nucleic acids, proteins, etc.) seen between ~1000 and 1700 cm−1 in spectrum D of Figure 2, B display the SERS effect stemming from proximity of these components to the unlabeled silver nanoparticles that have entered the interior of the cell.
Spatial and temporal variation in uptake efficiency was observed in this study as a function of particle charge. Specifically, negatively charged 4-MBA–labeled particles and positively charged 4-ATP–labeled particles were taken up more readily by the cells than were neutrally charged 4-TC–labeled particles. Additionally, the silver nanoparticles functionalized with 4-TC were taken up even more slowly than the “unlabeled” silver nanoparticles, which exhibit a slight residual negative charge due to the silver metal surface.
These observations, taken together, suggest the ability to modulate cellular uptake of nanoparticles by functionalization with selected “label modulators” having a combination of appropriate charge, chemical structure, and nanoparticle size. Therefore, uptake of plasmonically active nanodelivery vehicles may be designed to occur over a particular time window after treatment with a cell-modifying agent or drug treatment. The results of these experiments are summarized in Table 1.
Table 1.
Summary of results for SERS monitoring of labeled and unlabeled nanoparticle uptake in J774 cells after a 4-hour incubation
| Charge | Uptake (4 hours) | Remarks | |
|---|---|---|---|
| No particles | – | – | Control |
| Unlabeled nanoparticles | – | ** | Smaller diameter than labeled particles due to lack of hydrocarbon monolayer |
| 4-MBA-labeled nanoparticles | Negative | *** | Carboxyl group; electrostatics may aid interaction with cell membrane |
| 4-ATP-labeled nanoparticles | Positive | ***** | Amine group; electrostatics may aid interaction with plasma membrane |
| 4-TC-labeled nanoparticles | Neutral | * | Methyl group; lack of electrostatics may hinder interaction with plasma membrane |
Number of asterisks indicates increasing degree of efficient uptake.
Our results confirm previous studies regarding the effect of charged functional groups in which cellular uptake of unlabeled nanoparticles has been reported to vary with particle size, shape, and surface coatings.4,24–29 More generally, our results show that it is possible to monitor the uptake efficiency of nanoprobes in single cells via SERS imaging and to simultaneously modulate uptake efficiency via surface modification with charged or uncharged molecular labels. These applications demonstrate a proof-of-concept step in potential use of plasmonics-active nanobiosensors as an important tool in the detection of cellular disease or cellular changes due to exposure to chemical and biological agents and/or delivery of treatments to individual cells. Subsequent experiments will focus on further characterization of nanoprobe uptake and tracking in clinically relevant human cell lines as well as further functionalization of SERS-labeled nanoparticles for multiplexed sensing, co-functionalization with multiple labels, and targeted delivery and localization inside the cell. More generally, future research will extend this work to addition of biochemical functionalities for cellular targets such as DNA/RNA sequences, antibodies, or proteins, and the use of targeting peptides for selective delivery of sensors and cargo to selected intracellular compartments.
Acknowledgments
This work was sponsored by the National Institutes of Health (R01 EB006201 and R01 ES014774).
Footnotes
No conflict of interest was reported by the authors of this article.
References
- 1.Yezhelyev MV, Gao X, Xing Y, Al-Hajj A, Nie S, O’Regan RM. Emerging use of nanoparticles in diagnosis and treatment of breast cancer. Lancet Oncol. 2006;7:657–67. doi: 10.1016/S1470-2045(06)70793-8. [DOI] [PubMed] [Google Scholar]
- 2.Gu FX, Karnik R, Wang AZ, Alexis F, Levy-Nissenbaum E, Hong S, et al. Targeted nanoparticles for cancer therapy. Nano Today. 2007;2:14–21. [Google Scholar]
- 3.Kasili PM, Cullum BM, Griffin GD, Vo-Dinh T. Nanosensor for in vivo measurement of the carcinogen benzo[a]pyrene in a single cell. J Nanosci Nanotechnol. 2002;2:653–8. doi: 10.1166/153348802321105941. [DOI] [PubMed] [Google Scholar]
- 4.Willets K. Surface-enhanced Raman scattering (SERS) for probing internal cellular structure and dynamics. Anal Bioanal Chem. 2009;394:85–94. doi: 10.1007/s00216-009-2682-3. [DOI] [PubMed] [Google Scholar]
- 5.Gomez-Hens A, Fernandez-Romero JM, Aguilar-Caballos MP. Nanos-tructures as analytical tools in bioassays. Trends Anal Chem. 2008;27:394–406. doi: 10.1016/j.trac.2008.03.006. [DOI] [PMC free article] [PubMed] [Google Scholar]
- 6.Rzigalinski BA, Strobl JS. Cadmium-containing nanoparticles: perspectives on pharmacology and toxicology of quantum dots. Toxicol Appl Pharmacol. 2009;238:280–8. doi: 10.1016/j.taap.2009.04.010. [DOI] [PMC free article] [PubMed] [Google Scholar]
- 7.Jeanmaire DL, Van Duyne RP. Surface Raman spectroelectrochemistry Part I. Heterocyclic, aromatic, and aliphatic amines adsorbed on the anodized silver electrode. J Electroanal Chem. 1977;84:1–29. [Google Scholar]
- 8.Kerker M. Electromagnetic model for surface-enhanced Raman scattering (SERS) on metal colloids. Acc Chem Res. 1984;17:271–7. [Google Scholar]
- 9.Kneipp K, Kneipp H, Manoharan R, Hanlon EB, Itzkan I, Dasari RR, et al. Extremely large enhancement factors in surface-enhanced Raman scattering for molecules on colloidal gold clusters. Appl Spec. 1998;52:1493–7. [Google Scholar]
- 10.Kneipp K, Wang Y, Kneipp H, Perelman LT, Itzkan I, Dasari RR, et al. Single molecule detection using surface-enhanced Raman scattering (SERS) Phys Rev Lett. 1997;78:1667–70. [Google Scholar]
- 11.Vo-Dinh T, Hiromoto MYK, Begun GM, Moody RL. Surface-enhanced Raman spectrometry for trace organic analysis. Anal Chem. 1984;56:1667–70. [Google Scholar]
- 12.Vo-Dinh T. Surface-enhanced Raman spectroscopy using metallic nanostructures. Trends Anal Chem. 1998;17:557–82. [Google Scholar]
- 13.Stokes DL, Vo-Dinh T. Development of an integrated single-fiber SERS sensor. Sens Actuators. 2000;69:28–36. [Google Scholar]
- 14.Allain LR, Vo-Dinh T. Surface-enhanced Raman scattering detection of the breast cancer susceptibility gene BRCA1 using a silver-coated microarray platform. Anal Chim Acta. 2002;469:149–54. [Google Scholar]
- 15.Culha M, Stokes D, Allain LR, Vo-Dinh T. Surface-enhanced Raman scattering substrate based on a self-assembled monolayer for use in gene diagnostics. Anal Chem. 2003;75:6196–201. doi: 10.1021/ac0346003. [DOI] [PubMed] [Google Scholar]
- 16.Vo-Dinh T, Allain LR, Stokes DL. Cancer gene detection using surface-enhanced Raman scattering (SERS) J Raman Spectros. 2002;33:511–6. [Google Scholar]
- 17.Kneipp K, Wang Y, Kneipp H, Itzkan I, Dasari RR, Feld MS. Population pumping of excited vibrational states by spontaneous surface-enhanced Raman scattering. Phys Rev Lett. 1996;76:2444–7. doi: 10.1103/PhysRevLett.76.2444. [DOI] [PubMed] [Google Scholar]
- 18.Kneipp K, Haka AS, Kneipp H, Badizadegan K, Yoshizawa N, Boone C, et al. Surface-enhanced Raman spectroscopy in single living cells using gold nanoparticles. Appl Spectrosc. 2002;56:150–4. [Google Scholar]
- 19.Kneipp J, Kneipp H, McLaughlin M, Brown D, Kneipp K. In vivo molecular probing of cellular compartments with gold nanoparticles and nanoaggregates. Nano Lett. 2006;6:2225–31. doi: 10.1021/nl061517x. [DOI] [PubMed] [Google Scholar]
- 20.Uzunbajakava N, Lenferink A, Kraan Y, Volokhina E, Vrensen G, Greve J, et al. Nonresonant confocal Raman imaging of DNA and protein distribution in apoptotic cells. Biophys J. 2003;84:3968–81. doi: 10.1016/S0006-3495(03)75124-8. [DOI] [PMC free article] [PubMed] [Google Scholar]
- 21.Matthaus C, Boydston-White S, Miljkovi M, Romeo M, Diem M. Raman and infrared microspectral imaging of mitotic cells. Appl Spectrosc. 2006;60:1–8. doi: 10.1366/000370206775382758. [DOI] [PMC free article] [PubMed] [Google Scholar]
- 22.Zumbusch A, Holtom GR, Xie XS. Three-dimensional vibrational imaging by coherent anti-Stokes Raman scattering. Phys Rev Lett. 1999;82:4142–5. [Google Scholar]
- 23.Wabuyele MB, Yan F, Griffin GD, Vo-Dinh T. Hyperspectral surface-enhanced Raman imaging of labeled silver nanoparticles in single cells. Rev Sci Instrum. 2005;76:06371–6. [Google Scholar]
- 24.Chithrani BD, Ghazani AA, Chan WCW. Determining the size and shape dependence of gold nanoparticle uptake into mammalian cells. Nano Lett. 2006;6:662–8. doi: 10.1021/nl052396o. [DOI] [PubMed] [Google Scholar]
- 25.Zahr AS, Davis CA, Pishko MV. Macrophage uptake of core-shell nanoparticles surface modified with poly(ethylene glycol) Langmuir. 2006;22:8178–85. doi: 10.1021/la060951b. [DOI] [PubMed] [Google Scholar]
- 26.Yamamoto N, Fukai F, Ohshima H, Terada H, Makino K. Dependence of the phagocytic uptake of polystyrene microspheres by differentiated HL60 upon the size and surface properties of the microspheres. Colloids Surf B Biointerfaces. 2002;25:157–62. [Google Scholar]
- 27.Kim JS, Yoon TJ, Yu KN, Noh MS, Woo M, Kim BG, et al. Cellular uptake of magnetic nanoparticle is mediated through energy-dependent endocytosis in A549 cells. J Vet Sci. 2006;7:321–6. doi: 10.4142/jvs.2006.7.4.321. [DOI] [PMC free article] [PubMed] [Google Scholar]
- 28.Tyteca D, Van der Smissen P, Mettlen M, Van Bambeke F, Tulkens PM, Mingeot-Leclercq MP, et al. Azithromycin, a lysosomotropic antibiotic, has distinct effects on fluid-phase and receptor-mediated endocytosis, but does not impair phagocytosis in J774 macrophages. Exp Cell Res. 2002;281:86–100. doi: 10.1006/excr.2002.5613. [DOI] [PubMed] [Google Scholar]
- 29.Tkachenko AG, Xie H, Liu YL, Coleman D, Ryan J, Glomm WR, et al. Cellular trajectories of peptide-modified gold particle complexes: comparison of nuclear localization signals and peptide transduction domains. Bioconj Chem. 2004;15:482–90. doi: 10.1021/bc034189q. [DOI] [PubMed] [Google Scholar]
- 30.Leopold N, Lendl B. A new method for fast preparation of highly surface-enhanced Raman scattering (SERS) active silver colloids at room temperature by reduction of silver nitrate with hydroxylamine hydrochloride. J Phys Chem. 2003;107:5723–7. [Google Scholar]
- 31.Jennings GK, Laibinis PE. Self-assembled n-alkanethiolate monolayers on underpotentially deposited adlayers of silver and copper on gold. J Am Chem. 1997;119:5208–14. [Google Scholar]
- 32.Javier AM, Kreft O, Alberola AP, Kirchner C, Zebli B, Susha AS, et al. Combined atomic force microscopy and optical microscopy measurements as a method to investigate particle uptake by cells. Small. 2006;2:394–400. doi: 10.1002/smll.200500282. [DOI] [PubMed] [Google Scholar]


