

Abstract
P-glycoprotein is a protective efflux transporter at the blood–brain barrier showing altered function in many neurological disorders. The purpose of this study was to validate [18F]MC225 as a radiotracer for measuring P-glycoprotein function with positron emission tomography. Three groups of Sprague-Dawley rats were used to assess tracer uptake at baseline (group 1), after inhibition of P-glycoprotein (group 2), and after inhibition of both P-glycoprotein and breast cancer resistance protein (Bcrp, group 3). A two-tissue compartment model with a metabolite-corrected plasma input function provided the best fit to the positron emission tomography data, but parameter estimates were more reliable in a one-tissue compartment model, which was selected as the preferred model. Regional distribution volumes (VT) in the control group ranged from 6 to 11, which is higher than for other radiotracers. [18F]MC225 showed transporter selectivity, since inhibition of P-glycoprotein caused a two to fourfold increase in the cerebral VT values, but additional inhibition of Bcrp did not cause any further increase. Metabolic stability of [18F]MC225 was moderate (at 1 h post-injection 15% of plasma radioactivity and 76% of brain radioactivity represented intact parent). Thus, [18F]MC225 may be a useful radiotracer to measure especially increases of P-glycoprotein function at the blood–brain barrier.
Keywords: Blood–brain barrier, brain imaging, breast cancer resistance protein, kinetic modeling, positron emission tomography
Introduction
P-glycoprotein (P-gp, Mdr1) and breast cancer resistance protein (Bcrp) are efflux transporters expressed at the blood–brain barrier (BBB) and in many other tissues.1,2 They maintain homeostasis and protect the brain from neurotoxic substances by facilitating their efflux back into the blood.3 P-gp and Bcrp belong to the ATP-binding cassette (ABC) family of transporters. Compounds that are effluxed by these transporters are called “substrates.” Particularly, many anti-epileptic drugs4 and antidepressants5 are substrates of P-gp. Typical substrates show almost no brain uptake in the normal condition, but a strongly increased uptake when transporter function is impaired. Labeling such a substrate with a positron emitter, can result a tool which allows quantification of transporter function by positron emission tomography (PET) imaging. PET imaging of ABC-transporters may be important in choosing the correct medication for patients with neurological diseases or in identifying subjects at risk of developing a disease.
ABC-transporters are suspected to be involved in the pathogenesis of Alzheimer’s disease (AD).6 Especially the role of P-gp has been studied,7,8 although it is not yet known whether observed decreases of P-gp function in Alzheimer patients are a cause or a consequence of the disease. Accumulation of neurotoxic amyloid-ß (Aß) in the brain is supposed to be an important factor in the development of AD. Aβ is a substrate of P-gp and decreases of P-gp function are associated with increases of Aβ accumulation in the brain.9,10 Thus P-gp may be a potential target in the treatment of AD.
The ABC-transporters P-gp and Bcrp have comparable function and recognize molecules with similar structures. For this reason, it is difficult to design compounds with affinity for a single transporter. Tracer selectivity is an important issue, especially in human PET studies. In the rodent brain, Bcrp is expressed 3.2-fold less than P-gp, but in the human brain, Bcrp expression is 1.3-fold higher than the expression of P-gp.11,12 For reliable quantification of transporter function, the employed radiotracer should be selective and should not have affinity to other targets. Signal changes can then be directly related to changes of the function of a particular transporter. P-gp and Bcrp are known to play synergistic roles.13,14 Dual substrates (i.e., compounds with affinity for both transporters) show a significantly higher brain uptake in Mdr1a/b(−/−)Bcrp1(−/−) knockout mice than in Mdr1a/b(−/−) or Bcrp1(−/−) mice.15
In a previous publication, we reported the synthesis of three radiolabeled P-gp substrates and their preclinical evaluation in mice.16 5-(1-(2-[18F]fluoroethoxy))-[3-(6,7-dimethoxy-3,4-dihydro-1H-isoquinolin-2-yl)-propyl]-5,6,7,8-tetrahydronaphthalen ([18F]MC225, Figure 1) was found to be selective to P-gp over Bcrp and displayed a good metabolic stability. Based on the data reported in this article, we selected [18F]MC225 for further studies in rats and validated it as a PET radiotracer to quantitatively measure P-gp function at the BBB. Arterial blood sampling during the scan is possible in rats, which allows the acquisition of a metabolite-corrected input function for kinetic modeling. Different modeling approaches were applied and the optimal method for PET data analysis was selected.
Figure 1.
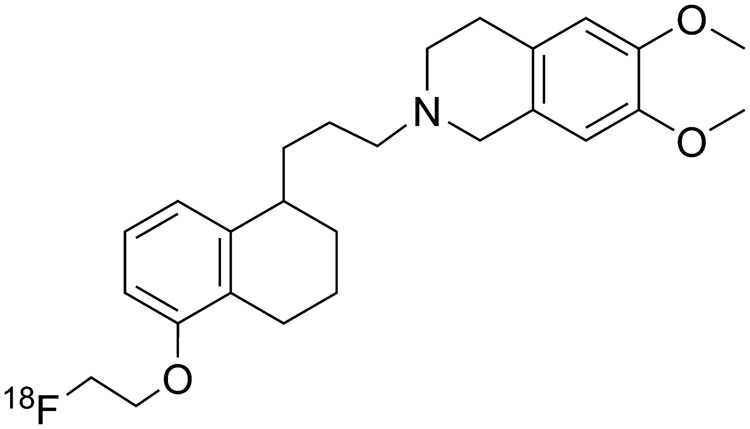
Molecular structure of [18F]MC225.
In order to evaluate the in vivo selectivity of [18F]MC225 to P-gp, three different groups of Sprague-Dawley rats were involved in the present study. Group 1 (control) was used to assess the brain uptake of [18F]MC225 at baseline. In group 2, tariquidar was used to inhibit P-gp. At a dose of 8 mg/kg i.v., tariquidar blocks predominantly P-gp. Only at higher dosing it also blocks Bcrp17 and doses smaller than 8 mg/kg would cause incomplete inhibition of P-gp. In group 3, both P-gp and Bcrp were inhibited by combined administration of tariquidar (8 mg/kg i.v.) and specific Bcrp inhibitor Ko143 (15 mg/kg i.v.).18 A dose of 15 mg/kg of Ko143 results in complete inhibition of Bcrp.17 Ko143 increases the brain uptake of a dual P-gp/Bcrp substrate only when P-gp is chemically inhibited or genetically knocked out. For this reason we have administered Ko143 in combination with tariquidar.
Materials and methods
Chemicals
Tariquidar (N-[2-[[4-[2-(6,7-dimethoxy-3,4-dihydro-1H-isoquinolin-2-yl)ethyl]phenyl]carbamoyl]-4,5-dimethoxyphenyl]quinoline-3-carboxamide) was purchased from API Services Inc. (Westford, MA, USA) and Ko143 ((3 S,6 S,12aS)-1,2,3,4,6,7,12,12 a-octahydro-9-methoxy-6-(2-methylpropyl)-1,4-dioxopyrazino[1′,2′:1,6]pyrido[3,4-b]indole-3-propanoic acid 1,1-dimethylethyl ester) from Axon Medchem BV (Groningen, Netherlands). For i.v. injections, tariquidar was first dissolved in DMSO (5%) and then to the vehicle solution (95%) (10% TWEEN 20, 25% Poly(ethylene glycol) 300 (PEG 300), 65 % water) in a concentration of 2.6 mg/mL and injected in a volume of 3 mL/kg. Ko143 was first dissolved in DMSO (5%) and TWEEN 20 (9%), PEG 300 (24%), and water (62%) were added separately in a concentration of 3.8 mg/mL. Ko143 was injected i.v. in a volume of 4 mL/kg. Other reagents and solvents were obtained from Merck (Kenilworth, NJ, USA), Sigma–Aldrich (St. Louis, MO, USA) and Rathburn (Walkerburn, UK) and were used without further purification.
Radiosynthesis
[18F]MC225 was synthesized with a 9 ± 2% radiochemical yield (calculated from end of bombardment of [18F]F−) in high radiochemical purity (98 ± 0.5%) and specific activity (>200 GBq/µmol) as previously reported by a two-step reaction using [18F]fluoroethyl bromide as an intermediate.16 Quality control was performed with UPLC, using a Waters Acquity H-class UPLC system (Milford, CT, USA) with a Berthold FlowStar LB 513 radioactivity detector (Bad Wildbad, Germany) and a Waters Acquity UPLC HSS T3 1.8 µm 3.0 × 50 mm column. The product was eluted with 53% acetonitrile/47% 10 mM ammonium bicarbonate pH 9.5 (v/v) at a flow rate of 1.2 mL/min. The UV signal was measured at a wavelength of 220 nm. A calibration curve of non labeled reference MC225 was used to determine the amount of carrier and to calculate the specific activity.
Animal experiments
Male outbred Sprague Dawley rats (306 ± 24 g, 9–10 weeks) were obtained from Harlan (Horst, Netherlands). Rats were acclimatized for at least 7 days in the Central Animal Facility of the University Medical Center Groningen before starting the experiments. Rats were housed in groups of 2 at a 12 h light-dark regime. Food and water were available ad libitum. Animal experiments were approved by the Institutional Animal Care and Use Committee of the University of Groningen (DEC 6456B) and were in accordance with the Animal Welfare Act of the European Communities Council Directive. Experiments are reported according to the ARRIVE criteria.
Rats were randomly divided in three groups. Group 1 (n = 6) was the control group treated with 1 mL of vehicle solution (i.v.) 30 min before the scan. Group 2 (n = 6) was pretreated with 8 mg/kg tariquidar i.v. which was injected 30 min before the scan, because at that time point the inhibition of P-gp has been found to be maximal.19 In group 3 (n = 6), Ko143 was administered i.v. about 1 h before the scan at a concentration of 15 mg/kg and P-gp was inhibited with 8 mg/kg of tariquidar 30 min before the scan.
PET imaging and ex vivo biodistribution
Rats were anesthetized with 5% isoflurane in medical air and anesthesia was maintained with 1.5–2% of isoflurane. Body temperature was maintained with a heating pad and an electronic temperature controller. A cannula was inserted into a femoral artery in order to collect blood samples during the scan. A femoral vein was also cannulated for radiotracer injection. After treatment with drugs or vehicle solution, rats were positioned in the microPET camera (microPET Focus 220, Siemens Medical Solutions, Malvern, PA, USA) and a transmission scan was acquired using a 57Co point source. The radiotracer [18F]MC225 (0.5 mL saline solution, 13 ± 4 MBq) was injected using an infusion pump set to a speed of 1 mL/min. A 60 min PET scan was started simultaneously with the radiotracer injection and 0.1 mL arterial blood samples were collected every 10 s during the first minute and at 1.5, 2, 3, 5, 7.5, 10, 15, 30, 45, and 60 min post-injection (p.i.) for determination of radioactivity in whole blood and plasma. Larger blood samples (0.3–0.4 mL) were collected at 5, 15, 30, 45, and 60 min for metabolite analysis. Drawn blood was replaced by heparinized saline. A 25 µL aliquot of whole blood was extracted from each sample for radioactivity measurement. The remainder of each sample was centrifuged at 6000 rpm for 5 min (Hettich EBA 20 centrifuge, Tuttlingen, Germany) and 25 μl of plasma was collected. Radioactivity in whole blood and plasma was measured with a γ-counter (LKB Wallac, Turku, Finland). Animals were terminated by extirpation of the heart. Peripheral organs and half of the brain were collected for ex vivo biodistribution analysis. These tissue samples were weighed and radioactivity was measured with a γ-counter. Radioactivity accumulation was expressed as standardized uptake value (SUV), using the following formula: [tissue activity concentration (MBq/g)]/[injected dose (MBq)/body weight (g)].
Metabolite analysis
Radioactivity in all the plasma samples was analyzed by thin layer chromatography (TLC, F-254 silica gel plates, Sigma–Aldrich). Plasma was precipitated by addition of two volumes of acetonitrile and centrifuged for 5 min at 6000 rpm. Samples of the supernatant were spotted on a TLC-plate which was then eluted with 10% MeOH in EtOAc. Radioactivity on plates was detected by phosphor storage imaging using a Cyclone® system (PerkinElmer Life and Analytical Science, Waltham, MA, USA). The fractions of intact radiotracer and radioactive metabolites were calculated by region of interest (ROI) analysis using OptiQuant 03.00 software (PerkinElmer). Metabolites in brain were analyzed by homogenizing half of the brain in 1 mL cold acetonitrile using a Heidolph Diax 600 homogenizer (Schwabach, Germany). The mixture was centrifuged and samples of the supernatant were analyzed by TLC, as described above.
Selected plasma samples (at 5, 15, 30, 45, and 60 min) from half of the animals in each group were also analyzed by ultra performance liquid chromatography (UPLC). Plasma proteins were precipitated by addition of 1.5 volume of acetonitrile and by 3 min of centrifugation in a Hettich Mikro 20 centrifuge at maximum speed (13,000 rpm). Supernatant was passed through a Millex-HV filter (0.45 µm, Millipore, Billerica, MA, USA), and sample was injected into a Waters Acquity UPLC H-Class system, using an Acquity UPLC HSS T3 1.8 µm 3.0 × 50 mm column and acetonitrile + 0.1% TFA/10 mM ammonium bicarbonate pH 9.5 (53:47, v/v) as mobile phase at a flow rate of 1.2 mL/min. Fractions were collected every 30 s during 7 min and were counted in a γ-counter. Measured radioactivity (cpm) was plotted as a function of time. The fraction of intact radiotracer (parent molecule) was calculated by dividing the area under the parent peak (AUC3.5–5.5 min) by the total AUC0–7 min. The fraction of plasma radioactivity representing parent compound was expressed as a function of time and one phase decay curves were fitted to this data, using GraphPad Prism 5 software (La Jolla, CA, USA). The calculated parameters of the exponential equation were used to correct the plasma input function (which was acquired by arterial blood sampling) for the presence of radioactive metabolites. A group average was used for this purpose.
PET image reconstruction and analysis
The list-mode data from the emission scan were reconstructed into 21 frames (6 × 10 s, 4 × 30 s, 2 × 60 s, 1 × 120 s, 1 × 180 s, 4 × 300 s, and 3 × 600 s). Emission sinograms were iteratively reconstructed (OSEM 2D, four iterations and 16 subsets) after being normalized and corrected for attenuation and decay of radioactivity. PET images were analyzed using PMOD v3.5 software (PMOD Technologies, Zürich, Switzerland). PET images were automatically coregistered with an MRI template20 using rigid matching. Predefined brain regions were selected as volumes of interest (VOI). Brain radioactivity concentrations were calculated from these VOIs to generate time–activity curves (TACs). Tissue radioactivity (Bq/mL) was corrected for injected dose and animal body weight and expressed as SUV. Measured radioactivity in whole blood and plasma (Bq/mL) was used as input function for kinetic modeling. In addition, plasma radioactivity was corrected for the presence of metabolites. Different approaches were used to calculate total distribution volume (VT), which represents the ratio of radiotracer concentration in target tissue and plasma at equilibrium: a one-tissue-compartment model (1TCM) fit, a two-tissue-compartment model (2TCM) fit and Logan graphical analysis. Reference tissue models could not be used, since P-gp is expressed throughout the brain21 and a suitable reference region is lacking. In a compartment model fit, the observed changes in radiotracer concentration are described by rate constants of transport between the compartments. The Logan plot is a graphical analysis technique developed for reversible ligand binding which allows estimation of VT.22 The slope of the linear part of the plot represents VT. A stable fit was acquired after 10 min, which was thus chosen as the proper fit onset. Data were weighted for frame duration and the cerebral blood volume was fixed to 5%.
Statistical analysis
Unless otherwise mentioned, data are presented as mean ± standard deviation (SD). One-way analysis of variance (ANOVA) with Bonferroni correction was used to assess the differences between the groups. A p value < 0.05 was considered statistically significant. IBM SPSS Statistics version 22 (Armonk, NY, USA) was used for the analysis.
Results
Ex vivo biodistribution
Biodistribution results acquired 60 min after injection of [18F]MC225 are presented in Figure 2. Results are expressed both as SUV (Figure 2(a)) and as tissue-to-plasma ratios of radioactivity (Figure 2(b), nonmetabolite-corrected total plasma collected at 60 min p.i. used) because tariquidar and Ko143 affected the plasma concentration of the radiotracer. Statistically significant differences in tissue-to-plasma ratios between group 1 and groups 2–3 were found in liver, spleen, pancreas, kidney, small- and large intestine, bone, and brain. Drug treatment (groups 2–3) decreased ratio in many peripheral organs and increased it in the brain. Compared to group 1, the ratio in the brain was 2-fold higher in group 2 and 3-fold higher in group 3. However, when data is expressed as SUV, brain uptake between group 2 and 3 is not significantly different, as it is in the tissue-to-plasma ratios.
Figure 2.

Biodistribution results at 60 min expressed as (a) SUV and (b) tissue-to-total plasma values (n = 6). Data are presented as mean ± SEM. Statistical differences are marked with a horizontal capped line (*p < 0.05, **p < 0.01, ***p < 0.001).
Metabolism
TLC and UPLC analysis gave comparable results for metabolite assays in plasma (Figure 3(a)). The fraction of parent molecule measured in each group using these two different techniques was not significantly different in group wise comparisons of area under the curve (AUC5–60 min). Drug treatment (groups 2 and 3) increased the rate of metabolism of [18F]MC225, especially at early time points. Metabolite curves of group 1 and groups 2–3 were significantly different in UPLC analysis (AUC5–60 min, p = 0.009 group 2, p = 0.04 group 3), but not in TLC (AUC0–60 min). In the control group, UPLC analysis indicated 57% parent tracer at 10 min, 24% at 30 min, and 15% at 60 min. All observed metabolites were more hydrophilic than parent, but TLC detected a minor amount (<5% of total radioactivity) of metabolites which were more hydrophobic than parent at late time points in some animals. Averaged UPLC chromatograms and an example of a radio-TLC chromatogram for group 1 are shown in Figure 3(c) and (d). Metabolite identification in UPLC was not possible because metabolites eluted all at the same time. However, in previous experiments using microsomes, both demethylation and defluoroethylation were observed for MC225.16
Figure 3.

Metabolism of [18F]MC225. Fraction of total radioactivity representing parent radiotracer (mean ± SEM) in (a) plasma (TLC (n = 6) and UPLC (n = 3)) and (b) brain (TLC, n = 6). (c) Averaged UPLC fractions of group 1 and (d) example of a radio-TLC at time points 1–10 min in group 1.
Metabolites in cerebral tissue were analyzed by TLC after the PET scan, that is, at 60 min p.i. (Figure 3(b)). In control animals, 24% of total brain radioactivity consisted of metabolites. Drug treatment decreased the fraction of metabolites (to 11%). After inhibition of P-gp, the amount of radiotracer in the brain is higher and therefore also the amount of parent molecule in the brain is higher than in the controls. Probably majority of the [18F]MC225 metabolites are not P-gp substrates, or otherwise we would have expected to see an increased accumulation of metabolites in the brain due to the inhibition.
SUV analysis
Metabolite-corrected plasma radioactivity (AUC0–60 min) was not significantly different between groups (p > 0.05, Supplementary Figure 1(a)). Although in the enlarged view for 0–2 min in the SUV TACs the plasma radioactivity is highest in the group 1, in the end of the scan the plasma radioactivity is higher in groups 2–3. Therefore, the area under the curve for 0–60 min is similar in each group. Example TACs for the whole brain are shown in Supplementary Figure 1(b). When an area under the curve (AUC0–60 min) was calculated, group 1 had 3.7-fold lower uptake than both treated groups (groups 2 and 3). No significant difference in brain SUV uptake between groups 2 and 3 was found (AUC0–60 min). Brain SUV images are presented in Figure 4.
Figure 4.

SUV-PET images averaged over the duration of the whole scan and over the whole group in group 1 (top), group 2 (middle), and group 3 (bottom). Left axial, middle coronal, and right sagittal view. Images were generated using Vinci 4.24 software (Max Planck Institute, Cologne, Germany).
Kinetic modeling
Three different approaches (one- and two-tissue compartment model fits and Logan graphical analysis) were used to calculate kinetic parameters (K1, k2, k3, k4) and tracer distribution volumes (VT). Whole blood and metabolite-corrected plasma radioactivity were used as input functions, and the most optimal approach for [18F]MC225 was selected. Table 1 and Supplementary Tables 1 and 2 present results for whole brain, frontal cortex, rest of cortex, striatum, hippocampus, and cerebellum.
Table 1.
One-tissue compartment model fit results with metabolite-corrected plasma radioactivity as input (n = 6).
| Brain region | K1 (mL/mL/min) | k2 (1/min) | VT (mL/mL) | AIC |
|---|---|---|---|---|
| Group 1 | ||||
| Whole brain | 0.12 ± 0.04 (0.13 ± 0.06) | 0.015 ± 0.001 (0.037 ± 0.01) | 7.7 ± 2.6 (3.7 ± 1.1) | 240 ± 16 (230 ± 17) |
| Frontal cortex | 0.14 ± 0.06 (0.16 ± 0.08) | 0.013 ± 0.002 (0.034 ± 0.01) | 11 ± 5.0 (4.6 ± 1.1) | 260 ± 21 (260 ± 16) |
| Rest of cortex | 0.10 ± 0.04 (0.11 ± 0.05) | 0.010 ± 0.002 (0.028 ± 0.01) | 10 ± 3.1 (4.1 ± 1.3) | 220 ± 14 (220 ± 8.4) |
| Striatum | 0.11 ± 0.04 (0.13 ± 0.05) | 0.017 ± 0.004 (0.038 ± 0.01) | 7.1 ± 2.7 (3.3 ± 0.57) | 250 ± 11 (250 ± 13) |
| Hippocampus | 0.11 ± 0.03 (0.12 ± 0.04) | 0.016 ± 0.001 (0.038 ± 0.01) | 6.6 ± 2.1 (3.3 ± 1.2) | 250 ± 13 (250 ± 11) |
| Cerebellum | 0.15 ± 0.06 (0.17 ± 0.08) | 0.018 ± 0.003 (0.043 ± 0.02) | 8.1 ± 2.8 (4.4 ± 2.1) | 260 ± 19 (250 ± 14) |
| Group 2 | ||||
| Whole brain | 0.81 ± 0.11 (0.84 ± 0.12) | 0.041 ± 0.01 (0.13 ± 0.02) | 20 ± 1.8*** (6.3 ± 0.76)** | 300 ± 14 (360 ± 20) |
| Frontal cortex | 0.82 ± 0.11 (0.85 ± 0.12) | 0.036 ± 0.01 (0.12 ± 0.02) | 23 ± 2.0** (7.0 ± 0.79)* | 300 ± 13 (360 ± 21) |
| Rest of cortex | 0.72 ± 0.13 (0.73 ± 0.13) | 0.037 ± 0.01 (0.12 ± 0.03) | 20 ± 1.8** (6.0 ± 0.70)* | 280 ± 16 (350 ± 22) |
| Striatum | 0.95 ± 0.13 (0.97 ± 0.14) | 0.038 ± 0.01 (0.13 ± 0.02) | 25 ± 2.3*** (7.8 ± 0.98)*** | 300 ± 13 (370 ± 20) |
| Hippocampus | 0.91 ± 0.13 (0.95 ± 0.14) | 0.036 ± 0.01 (0.12 ± 0.02) | 25 ± 2.1*** (7.7 ± 0.91)*** | 310 ± 14 (360 ± 20) |
| Cerebellum | 1.0 ± 0.12 (1.0 ± 0.12) | 0.057 ± 0.01 (0.17 ± 0.03) | 18 ± 1.8*** (6.2 ± 0.85) | 310 ± 14 (370 ± 18) |
| Group 3 | ||||
| Whole brain | 1.1 ± 0.50 (1.3 ± 0.74) | 0.047 ± 0.02 (0.17 ± 0.11) | 23 ± 5.1*** (7.5 ± 1.5)*** | 400 ± 170 (450 ± 160) |
| Frontal cortex | 1.1 ± 0.48 (1.3 ± 0.76) | 0.039 ± 0.01 (0.15 ± 0.10) | 27 ± 5.9*** (8.7 ± 1.7)*** | 400 ± 170 (450 ± 160) |
| Rest of cortex | 0.93 ± 0.45 (1.1 ± 0.67) | 0.040 ± 0.02 (0.15 ± 0.10) | 23 ± 5.2*** (7.3 ± 1.5)** | 380 ± 170 (440 ± 160) |
| Striatum | 1.2 ± 0.55 (1.4 ± 0.84) | 0.042 ± 0.02 (0.16 ± 0.10) | 29 ± 7.3*** (9.4 ± 2.2)*** | 400 ± 170 (460 ± 160) |
| Hippocampus | 1.2 ± 0.57 (1.4 ± 0.90) | 0.041 ± 0.02 (0.16 ± 0.11) | 29 ± 6.6*** (9.3 ± 2.0)*** | 410 ± 170 (450 ± 160) |
| Cerebellum | 1.4 ± 0.67 (1.5 ± 0.84) | 0.068 ± 0.02 (0.22 ± 0.13) | 20 ± 3.9*** (7.1 ± 1.2)* | 400 ± 170 (460 ± 160) |
Note: Values in brackets are calculated with total plasma radioactivity as input. Statistics compared to group 1: *p < 0.05, **p < 0.01, ***p < 0.001.
Fit examples for each approach and each group are presented in Figure 5. A 2TCM fitted the whole brain TAC most accurately. A 1TCM slightly underestimated the K1. The Akaike information criterion (AIC) is a measure of a fit quality; lower values represent a better fit. The AIC values for a 1TCM and a 2TCM fit were similar in group 1, but were higher for a 1TCM fit than for a 2TCM fit in groups 2–3 (Table 1 and Supplementary Table 1). In both compartment model fits, the AIC values were the lowest in group 1. However, in Logan analysis, the AIC values were lower in groups 2–3 than in group 1 (Supplementary Table 2). This is due to a fixed start time for the kinetic analysis (10 min). When the delay time is fitted, the AIC values are almost the same in each group (data not shown).
Figure 5.

Example fits of (a) 1TCM, (b) 2TCM, and (c) Logan analysis to whole brain time-activity data, using metabolite-corrected plasma radioactivity as input.
VT values obtained by the different approaches were compared by linear regression and Bland–Altman plots (Figure 6). The correlation coefficient of linear regressions (Figure 6(a) and (c)) was really good (r2 > 0.9), but Bland–Altman plots revealed more variation for 1TCM versus 2TCM (Figure 6(b)) than for 1TCM versus Logan (Figure 6(d)). The average difference between 1TCM and 2TCM was negative (−1.09), meaning that VT values obtained with 2TCM were higher than with 1TCM fit. In addition, group 3 showed more variability than the other two groups (Figure 6(b)). Standard deviations of the influx and efflux parameters (K1–k4) were much larger in the 2TCM than in the 1TCM fit (Table 1 and Supplementary Table 1). Values in the 2TCM fit were sometimes irrationally small resulting extremely high distribution volumes, thus these values were excluded as outliers. Because a 2TCM fit was not sufficiently stable and a 1TCM fit was still reasonably accurate, the 1TCM fit was selected as the preferred kinetic modeling method for [18F]MC225. Logan graphical analysis, which provides comparable results, can be used as a robust alternative to a 1TCM fit.
Figure 6.

Comparison of VT data calculated in different ways: Correlation of (a) 1TCM fit versus 2TCM fit and (c) 1TCM fit versus Logan graphical analysis. All fits used metabolite-corrected plasma radioactivity as input. Bland–Altman plots with 95% confidence intervals represent the difference of VT versus mean VT for (b) 1TCM fit versus 2TCM fit and (d) 1TCM fit versus Logan graphical analysis.
The effect of cerebral blood volume fraction on AIC values in the whole brain using 1TCM fit is presented in Supplementary Figure 2. Different fixed blood volumes (3%, 4%, and 5%) affected the fit accuracy very little. The lowest AIC values were obtained with 5% cerebral blood volume, which was used in all the compartmental (1TCM and 2TCM) modeling.
Distribution volumes in group 1, based on the 1TCM fit, were significantly different from group 2 and 3 in all brain regions, but volumes between group 2 and 3 were not significantly different (p > 0.29, Table 1). After inhibition of P-gp by tariquidar (group 2), the VT values increased 1.9- to 3.7-fold, depending on the brain region. When both P-gp and Bcrp were inhibited (group 3), these values increased 2.2- to 4.3-fold. Distribution volumes were highest in the frontal cortex.
In all groups of animals, the influx constant K1 calculated by a 1TCM fit was higher than the efflux constant k2. When P-gp was inhibited (groups 2 and 3), K1 increased 6- to 11-fold compared to baseline. The efflux constant k2 increased then also 2- to 4-fold. Since the observed changes in K1 after drug treatment were larger than changes in VT, K1 could pose as a more robust measure of P-gp function at the BBB, as suggested by Muzi et al.23 for [11C]verapamil.
We investigated also the effect of scan duration (15, 30, 40, 50, and 60 min) on VT and k values in the whole brain (Supplementary Table 3) using the 1TCM fit. K1 remained stable and was not affected much by the scan duration. k2 values on the other hand, were considerably higher at 15 min scan duration compared to a 60 min scan, but stabilized at scan durations greater than 30 min. Time-dependent VT values are also presented in Supplementary Figure 3. In groups 2 and 3, VT was already stable at 30 min, and remained within 10% of the VT of 60 min for scans of 30 to 60 min duration. In group 1, however, VT was stable at scan durations ranging from 30 to 50 min (5.3–5.9), but increased when scanning was prolonged to 60 min (7.7). Still, considering the stability of other parameters, scan time could be reduced to 30 min. AIC values would also support the shortening of the scan, as the AIC values at 60 min were higher than during other time points in each group.
Tracer kinetic modeling is rather time-consuming since arterial cannulation and blood sampling are required. Simplified methods of data analysis are preferred especially in the clinic. We investigated if SUV values would correlate with VT values, so that SUV could be used instead of VT. SUV values calculated for the last frame (50–60 min) of the PET data correlated slightly better with VT values from a 1TCM fit (Supplementary Figure 4(a)) than SUV TACs AUC0–60 min values (r2 = 0.829 versus r2 = 0.803, data not shown). Correlation in groups 2–3 was better than in group 1, but the overall correlation was only fair. Therefore, SUV may not be an adequate replacement for kinetic modeling. In addition, the use of SUV is only justified when there is no change in radiotracer clearance and metabolism between baseline and inhibited groups. Statistical significance was not reached in plasma TACs for AUC0–60 min (Supplementary Figure 1(a)) or in metabolite analysis in TLC between group 1 and groups 2–3 (Figure 3(a)). However, UPLC analysis of metabolites resulted significant differences due to inhibition and the amount of metabolites found in the brain was also influenced. Therefore, we can say that inhibition affected the metabolism of [18F]MC225 which invalidates the use of SUV in this particular study.
Metabolite analysis is another time-consuming effort. We compared kinetic modeling with metabolite-corrected and nonmetabolite-corrected total plasma input. Using the total plasma input, VT values produced by a 1TCM fit and Logan analysis were reduced (Table 1 and Supplementary Table 2), but displayed the same pattern as with metabolite-corrected plasma input, although the observed differences between the groups were smaller. A 2TCM fit with a noncorrected plasma input did not converge for all animals and resulted in many outliers. The standard deviation of the fit parameters was in many cases higher than the mean, thus we decided to not report these values. VT values in groups 2–3 were 1.4- to 2.8-fold higher than in group 1 in 1TCM analysis, and 1.2- to 2.3-fold higher in Logan analysis when a total plasma input was used. Yet, statistically significant differences were still observed in most regions (with the exception of cerebellum and rest of the cortex in Logan analysis, and in 1TCM fit significant differences in the cerebellum were only detected between groups 1 and 3). As with the metabolite-corrected plasma input, groups 2 and 3 did not show significant differences in any brain region with total plasma input. VT values calculated by a 1TCM fit using either metabolite-corrected or total plasma were moderately correlated (r2 = 0.839, Supplementary Figure 4(b)). Therefore, use of total plasma serves like a scaling factor, but the differences between the groups still remain. K1 values in the 1TCM fit were slightly higher in all groups but k2 values doubled in group 1 and tripled in groups 2–3 when a total plasma input was used and the standard deviation of all parameters increased. The fit quality in group 1 was not impaired by the use of a non corrected plasma input, but in groups 2–3 the AIC values for a 1TCM fit were up to 25% higher and up to 50% higher for a Logan analysis.
Discussion
Thus far, (R)-[11C]Verapamil is the best known and most used radiolabeled P-gp substrate. A great advantage of [11C]verapamil is its specificity to P-gp,24 but the radiotracer has also several limitations; a very low brain uptake at baseline and considerable uptake of radioactive metabolites in the brain. The biggest advantage of [18F]MC225 over [11C]verapamil is the limited amount of metabolites present in the brain. Radioactive metabolites of [18F]MC225 constituted 11–24% of the total radioactivity in brain tissue at 60 min p.i., but in case of [11C]verapamil this was over 50%.25 Radioactive metabolites in the brain can be a complicating factor in PET measurements, since a PET camera detects only radioactivity and cannot distinguish between the parent molecule and its radioactive metabolites. However, the rate of metabolism of [11C]verapamil in rat periphery was slower than that of [18F]MC225, measured in plasma.25 At 30 min and 1 h after injection, 47% and 28% of total plasma radioactivity in untreated animals represented intact [11C]verapamil, whereas the corresponding values for [18F]MC225 were 24% and 15%. A small fraction of the [11C]verapamil metabolites found in the brain were identified as N-dealkylated [11C]compounds (0.4%) and O-demethylated [11C]compounds (0.8%). Majority of the metabolites constituted of [11C]polar fraction, which according to authors was a mixture of [11C]formaldehyde, [11C]formaldehyde metabolites, [11C]formyl proteins and/or a nonvolatile form of [11C]CO2. The metabolic products of [18F]MC225 are not as well known as for [11C]verapamil, but in the microsome experiments defluoroethylation and demethylation has been found.16 Formed [18F]fluoroethane/ethanol can probably enter the brain. Yet, most likely [11C]verapamil metabolism produces more small radioactive polar compounds which can easily diffuse into the brain (or are formed in the brain) than [18F]MC225 metabolism, which is why despite the slower peripheral metabolism of [11C]verapamil more metabolites were found in the brain.
We found that both TLC and UPLC can be used for metabolite analysis of [18F]MC225. TLC has the advantage that only small volumes of plasma are needed at each time point and many samples can be analyzed on a single TLC-plate. UPLC analysis can only be performed for selected samples as the method is more laborious and time consuming. However, 4–5 samples taken during the scan are generally sufficient to fit a metabolite curve. Even though more blood (300 µL) is needed for UPLC analysis as compared to TLC (minimum 10 µL), the required amount of blood is still less than usually collected for HPLC analysis. A big advantage of UPLC over TLC is the better separation and the possibility of identification of metabolites. However, this was not possible in our case since all the metabolites of [18F]MC225 eluted during the first 1.5 min.
An additional advantage of [18F]MC225 over [11C]verapamil is the longer half-life of 18F (110 min) compared to 11C (20 min), although either isotope can be preferred depending on the particular application. Fluorine-18 radiotracers can be transported to remote imaging centers without an onsite cyclotron and more subjects may be dosed from a single production batch.
Based on our results, a one-tissue compartment model fit was selected as the preferred kinetic modeling approach for [18F]MC225. The baseline uptake of [18F]MC225 was higher than that of other P-gp substrates. [11C]Verapamil has baseline VT values ranging from 1.1 to 2.3,19 whereas these were 6.6 to 11 for [18F]MC225 (Table 1). The highest uptake of [18F]MC225 was observed in cortical areas (particularly in frontal cortex) and cerebellum. A similar regional distribution pattern has been observed for [11C]verapamil, with highest uptake in frontal motor cortex and cerebellum.19 Inhibition of P-gp results in a maximally 12-fold increase of whole brain VT for [11C]verapamil. For [18F]MC225, the maximum increase was 4.3-fold in the hippocampus and 2.9-fold in the whole brain, when both P-gp and Bcrp were inhibited. Thus, [18F]MC225 seems to be a weaker P-gp substrate than [11C]verapamil. A direct comparative study using both tracers in a disease model might answer the question whether they are capable of detecting small changes in P-gp function and might assess their limits of quantification.
We performed kinetic modeling with both metabolite-corrected and nonmetabolite-corrected total plasma radioactivity as input, as suggested by Lubberink et al.26 The reason for testing the two plasma input functions was to account for the presence of brain crossing radiolabeled metabolites, which contribute to brain uptake. The simplification of using non corrected plasma input would be otherwise only justified when the radiotracer is minimally metabolized, which isn’t the case for [18F]MC225. When total plasma radioactivity served as input, the calculated VT data were scaled down by a certain factor, but group differences were still observed and the conclusions about drug effects were not altered. Even though avoiding metabolite analysis would be convenient and the quality of a 1TCM fit with total plasma radioactivity input was good, the standard deviation of all parameters was larger, thus for our data set a 1TCM fit with metabolite-corrected plasma input worked best.
The high baseline uptake of [18F]MC225 could be advantageous in cases where P-gp is overexpressed, such as in drug-resistant epilepsy.27,28 Increased P-gp function would then result in a decreased brain uptake of the radiotracer. Detection of P-gp overexpression may not be possible with a radiotracer, which has a very low baseline uptake in the brain. There is always a trade-off between the affinity of a substrate for P-gp and the brain uptake of such a substrate at baseline. [11C]N-desmethyl-Loperamide ([11C]dLop) is a potent P-gp substrate with an extremely low brain uptake at baseline.29,30 Radiochemical efforts are therefore directed at the synthesis of [11C]dLop analogues with lower affinity for P-gp than the original molecule, which will hopefully result in a higher baseline uptake and the capability to measure increases of P-gp function.31
However, the high baseline uptake of [18F]MC225 may indicate that this tracer binds to an unidentified target in the brain. Based on the molecular structure of the tracer, sigma-1 or sigma-2 receptors would be a possible target. However, when the affinity of the nonradioactive compound to these receptors was tested in vitro, MC225 was found to be inactive.16 Thus, [18F]MC225 cannot be expected to bind to sigma receptors.
The experiments reported in this article were a continuation of previous work with [18F]MC225 in mice.16 The data in our group 2 may be compared to those acquired in Mdr1a/b(−/−) mice and the data from our group 3 to those of Mdr1a/b(−/−)Bcrp1(−/−) mice. There was no statistical difference in whole brain SUV uptake between Mdr1a/b(−/−)Bcrp1(−/−) and Mdr1a/b(−/−) mice. Similarly, additional inhibition of Bcrp with Ko143 in rats did not significantly increase the radiotracer SUV or VT uptake as compared to inhibition of P-gp only. Thus, in rodents [18F]MC225 seems to display selectivity to P-gp as the influence of Bcrp inhibition was negligible. However, the peak of tracer uptake in the brain (SUV) was twice as high in drug-treated rats than in knockout mice, whereas the baseline uptake in control rats and mice was the same. The rate of tracer metabolism was much slower in mice than in rats (69% of plasma radioactivity representing parent at 45 min) and even lower amounts of metabolites were detected in the mouse brain (4% of total brain radioactivity at 45 min). These findings are the opposite to what would be expected, as peripheral metabolism in bigger animals is usually slower than in small animals. Biodistribution results in rats and mice were similar, with the exception of the liver SUV, which was higher in mice. Based on the promising results of [18F]MC225 in mice, we expected good results also in rats, but this expectation did not fully come true.
In conclusion, 1TCM fit with metabolite-corrected plasma input was selected as the optimal kinetic modeling method for [18F]MC225. The tracer showed a moderate rate of peripheral metabolism measured in rat plasma and the fraction of metabolites observed in the brain after the PET scan was small. [18F]MC225 appeared to be selective to P-gp, as the influence of additional inhibition of Bcrp on brain uptake of the tracer was negligible. The baseline brain uptake of [18F]MC225 was higher than that of other P-gp radiotracers such as [11C]verapamil. [18F]MC225 may thus be useful for imaging regional increases of P-gp function at the BBB.
Funding
The author(s) disclosed receipt of the following financial support for the research, authorship, and/or publication of this article: This work was supported by Dutch Technology Foundation STW (project number 11741).
Supplementary Material
Acknowledgements
We thank Jürgen Sijbesma for contributing in the animal work, Marianne Schepers and Rolf Zijlma for metabolite analysis in UPLC and David Vállez Garcia for the help with especially Pmod and Vinci softwares. We are also very grateful for Aren van Waarde for language editing.
Declaration of conflicting interests
The author(s) declared no potential conflicts of interest with respect to the research, authorship, and/or publication of this article.
Authors’ contributions
HS designed the study, performed all the experiments, analyzed the data and wrote the manuscript. ADW, PHE, and GL contributed in the study design, interpretation of the data and revised the manuscript. MC and NAC contributed in the study design and MC also synthesized the precursor molecule and standard used in the radiosynthesis. ATMW helped in the analysis and interpretation of the data and revised the manuscript.
Supplementary material
Supplementary material for this paper can be found at http://jcbfm.sagepub.com/content/by/supplemental-data
References
- 1.Schinkel AH. P-Glycoprotein, a gatekeeper in the blood–brain barrier. Adv Drug Deliv Rev 1999; 36: 179–194. [DOI] [PubMed] [Google Scholar]
- 2.Ni Z, Bikadi Z, Rosenberg MF, et al. Structure and function of the human breast cancer resistance protein (BCRP/ABCG2). Curr Drug Metab 2010; 11: 603–617. [DOI] [PMC free article] [PubMed] [Google Scholar]
- 3.Raaphorst R, Windhorst A, Elsinga P, et al. Radiopharmaceuticals for assessing ABC transporters at the blood–brain barrier. Clin Pharmacol Ther 2015; 97: 362–371. [DOI] [PubMed] [Google Scholar]
- 4.Luna-Tortós C, Fedrowitz M, Löscher W. Several major antiepileptic drugs are substrates for human P-glycoprotein. Neuropharmacology 2008; 55: 1364–1375. [DOI] [PubMed] [Google Scholar]
- 5.O’Brien FE, Dinan TG, Griffin BT, et al. Interactions between antidepressants and P-glycoprotein at the blood–brain barrier: clinical significance of in vitro and in vivo findings. Br J Pharmacol 2012; 165: 289–312. [DOI] [PMC free article] [PubMed] [Google Scholar]
- 6.Abuznait AH, Kaddoumi A. Role of ABC transporters in the pathogenesis of Alzheimers disease. ACS Chem Neurosci 2012; 3: 820–831. [DOI] [PMC free article] [PubMed] [Google Scholar]
- 7.van Assema DME, Lubberink M, Bauer M, et al. Blood–brain barrier function in Alzheimer’ s disease. Brain 2012; 135: 181–189. [DOI] [PubMed] [Google Scholar]
- 8.Nicolazzo JA, Banks WA. Decreased blood–brain barrier expression of P-glycoprotein in Alzheimer’s disease: impact on pathogenesis and brain access of therapeutic agents. Ther Deliv 2011; 2: 841–844. [DOI] [PubMed] [Google Scholar]
- 9.Ohtsuki S, Ito S, Terasaki T. Is P-glycoprotein involved in amyloid-β elimination across the blood–brain barrier in Alzheimer’s disease? Clin Pharmacol Ther 2010; 88: 443–445. [DOI] [PubMed] [Google Scholar]
- 10.Cirrito JR, Deane R, Fagan AM, et al. P-glycoprotein deficiency at the blood–brain barrier increases amyloid-β deposition in an Alzheimer disease mouse model. J Clin Invest 2005; 115: 3285–3290. [DOI] [PMC free article] [PubMed] [Google Scholar]
- 11.Chu X, Bleasby K, Evers R. Species differences in drug transporters and implications for translating preclinical findings to humans. Expert Opin Drug Metab Toxicol 2013; 9: 237–252. [DOI] [PubMed] [Google Scholar]
- 12.Uchida Y, Ohtsuki S, Katsukura Y, et al. Quantitative targeted absolute proteomics of human blood–brain barrier transporters and receptors. J Neurochem 2011; 117: 333–345. [DOI] [PubMed] [Google Scholar]
- 13.Agarwal S, Elmquist WF. Insight into the cooperation of P-glycoprotein (ABCB1) and breast cancer resistance protein (ABCG2) at the blood–brain barrier: a case study examining sorafenib efflux clearance. Mol Pharm 2012; 9: 678–684. [DOI] [PMC free article] [PubMed] [Google Scholar]
- 14.Kodaira H, Kusuhara H, Ushiki J, et al. Kinetic analysis of the cooperation of P-glycoprotein (P-gp/Abcb1) and breast cancer resistance protein (Bcrp/Abcg2) in limiting the brain and testis penetration of erlotinib, flavopiridol, and mitoxantrone. J Pharmacol Exp Ther 2010; 333: 788–796. [DOI] [PubMed] [Google Scholar]
- 15.de Vries NA, Zhao J, Kroon E, et al. P-glycoprotein and breast cancer resistance protein: two dominant transporters working together in limiting the brain penetration of topotecan. Clin Cancer Res 2007; 13: 6440–6449. [DOI] [PubMed] [Google Scholar]
- 16.Savolainen H, Cantore M, Colabufo NA, et al. Synthesis and preclinical evaluation of three novel fluorine-18 labeled radiopharmaceuticals for P-glycoprotein PET imaging at the blood–brain barrier. Mol Pharm 2015; 12: 2265–2275. [DOI] [PubMed] [Google Scholar]
- 17.Wanek T, Kuntner C, Bankstahl JP, et al. A novel PET protocol for visualization of breast cancer resistance protein function at the blood–brain barrier. J Cereb blood flow Metab 2012; 32: 2002–2011. [DOI] [PMC free article] [PubMed] [Google Scholar]
- 18.Allen JD, van Loevezijn A, Lakhai JM, et al. Potent and specific inhibition of the breast cancer resistance protein multidrug transporter in vitro and in mouse intestine by a novel analogue of fumitremorgin C. Mol Cancer Ther 2002; 1: 417–425. [PubMed] [Google Scholar]
- 19.Kuntner C, Bankstahl JP, Bankstahl M, et al. Dose-response assessment of tariquidar and elacridar and regional quantification of P-glycoprotein inhibition at the rat blood–brain barrier using (R)-[11C]verapamil PET. Eur J Nucl Med Mol Imaging 2010; 37: 942–953. [DOI] [PMC free article] [PubMed] [Google Scholar]
- 20.Schwarz AJ, Danckaert A, Reese T, et al. A stereotaxic MRI template set for the rat brain with tissue class distribution maps and co-registered anatomical atlas: application to pharmacological MRI. Neuroimage 2006; 32: 538–550. [DOI] [PubMed] [Google Scholar]
- 21.Seegers U, Potschka H, Löscher W. Lack of effects of prolonged treatment with phenobarbital or phenytoin on the expression of P-glycoprotein in various rat brain regions. Eur J Pharmacol 2002; 451: 149–155. [DOI] [PubMed] [Google Scholar]
- 22.Logan J. Graphical analysis of PET data applied to reversible and irreversible tracers. Nucl Med Biol 2000; 27: 661–670. [DOI] [PubMed] [Google Scholar]
- 23.Muzi M, Mankoff DA, Link JM, et al. Imaging of cyclosporine inhibition of P-glycoprotein activity using 11C-verapamil in the brain: studies of healthy humans. J Nucl Med 2009; 50: 1267–1275. [DOI] [PMC free article] [PubMed] [Google Scholar]
- 24.Römermann K, Wanek T, Bankstahl M, et al. (R)-[11C]verapamil is selectively transported by murine and human P-glycoprotein at the blood–brain barrier, and not by MRP1 and BCRP. Nucl Med Biol 2013; 40: 873–878. [DOI] [PMC free article] [PubMed] [Google Scholar]
- 25.Luurtsema G, Molthoff CFM, Schuit RC, et al. Evaluation of (R)-[11C]verapamil as PET tracer of P-glycoprotein function in the blood–brain barrier: kinetics and metabolism in the rat. Nucl Med Biol 2005; 32: 87–93. [DOI] [PubMed] [Google Scholar]
- 26.Lubberink M, Luurtsema G, van Berckel BNM, et al. Evaluation of tracer kinetic models for quantification of P-glycoprotein function using (R)-[11C]verapamil and PET. J Cereb blood flow Metab 2007; 27: 424–433. [DOI] [PubMed] [Google Scholar]
- 27.Langer O, Bauer M, Hammers A, et al. Pharmacoresistance in epilepsy: a pilot PET study with the P-glycoprotein substrate R-[11C]verapamil. Epilepsia 2007; 48: 1774–1784. [DOI] [PubMed] [Google Scholar]
- 28.Feldmann M, Asselin M-C, Liu J, et al. P-glycoprotein expression and function in patients with temporal lobe epilepsy: a case-control study. Lancet Neurol 2013; 12: 777–785. [DOI] [PubMed] [Google Scholar]
- 29.Kreisl WC, Liow J-S, Kimura N, et al. P-glycoprotein function at the blood–brain barrier in humans can be quantified with the substrate radiotracer 11C-N-desmethyl-loperamide. J Nucl Med 2010; 51: 559–566. [DOI] [PMC free article] [PubMed] [Google Scholar]
- 30.Lazarova N, Zoghbi SS, Hong J, et al. Synthesis and evaluation of [N-methyl-11C]N-desmethyl-loperamide as a new and improved PET radiotracer for imaging P-gp function. J Med Chem 2008; 51: 6034–6043. [DOI] [PMC free article] [PubMed] [Google Scholar]
- 31.Cai L, Peng Y, Xie Y, et al. Exploration of analogs of [11C]dLop as potential probes for measuring increased P-gp function. J Label Compd Radiopharm 2015; 58: 308. [Google Scholar]
Associated Data
This section collects any data citations, data availability statements, or supplementary materials included in this article.