

Abstract
Increasing the concentration of oxygen dissolved in water is known to increase the recovery rate (R1 = 1/T1) of longitudinal magnetization (T1 relaxation). Direct T1 changes in response to precise hyperoxic gas challenges have not yet been quantified and the actual effect of increasing arterial oxygen concentration on the T1 of brain parenchyma remains unclear. The aim of this work was to use quantitative T1 mapping to measure tissue T1 changes in response to precisely targeted hyperoxic respiratory challenges ranging from baseline end-tidal oxygen (PetO2) to approximately 500 mmHg. We did not observe measureable T1 changes in either gray matter or white matter parenchymal tissue. The T1 of peripheral cerebrospinal fluid located within the sulci, however, was reduced as a function of PetO2. No significant T1 changes were observed in the ventricular cerebrospinal fluid under hyperoxia. Our results indicate that care should be taken to distinguish actual T1 changes from those which may be related to partial volume effects with cerebrospinal fluid, or regions with increased fluid content such as edema when examining hyperoxia-induced changes in T1 using methods based on T1-weighted imaging.
Keywords: Brain imaging, cerebral hemodynamics, cerebrospinal fluid, magnetic resonance imaging, neurophysiology
Introduction
Interest in the effect of inhaled oxygen (O2) on MR image contrast in T1-weighted images began with the observation of cerebrospinal fluid (CSF) hyper-intensity in fluid-attenuated inversion recovery (FLAIR) images taken of patients under general anesthesia. Initially thought to be the result of hemorrhage or abnormal protein content, CSF hyper-intensity was later shown to be due to the administration of supplemental O2.1,2 CSF mainly consists of unbound water molecules, and increasing the concentration of O2 dissolved in water causes a decrease longitudinal magnetization: defined by the T1 relaxation time constant.3 In the context of FLAIR images, T1 shortening results in a shift of the inversion time required to null the CSF, thereby resulting in unexpected MR signal. Subsequent in vivo studies examining the effect of increased O2 inhalation (defined herein as hyperoxia) have reported further O2-dependent T1 changes in various peripheral organs and tissues,4–6 blood,7–9 cerebral tissue10 and in CSF.11,12
The notion that dissolved O2 can modulate MR relaxivity in vivo has spurred the development of MR methods with the aim of quantifying changing tissue oxygenation properties under varying gas inhalation challenges. Recent studies have used steady-state MR imaging13 as well as saturation-recovery-based methods10 to investigate changes in the T1-recovery-induced via high-flow hyperoxic gas mixtures, as potential surrogate markers of tissue oxygenation status. It has been suggested that monitoring changes in relaxivity parameters can help identify brain regions in which metabolic homeostasis is perturbed, or where O2 supply has been compromised.13,14 This is of particular interest for oncological studies since tissue hypoxia has been associated with negative treatment outcome.15,16
While studies in the parametric assessment of tissue oxygenation have shown initial promise, potential confounds relating to image acquisition and respiratory challenge delivery, mean that uncertainties remain regarding the actual extent by which parenchymal tissue (consisting of a majority extravascular tissue fraction and minority blood fraction) T1 is changed under hyperoxia. The use of T1-weighted imaging provides only an indirect measure of T1 changes which may be influenced by global susceptibility effects related to large volumes of inspired O217 or partial volume effects with CSF, and perhaps to a lesser extent, residual blood oxygenation level-dependent (BOLD) T2* weighting or inflow effects. In terms of gas delivery, the use of high-flow gas mixtures such as carbogen or pure O2 provides a stimulus whose amplitude and temporal characteristics may vary between subjects. This makes investigation of T1 changes as function of inspired gas concentration challenging.
To date, direct T1 changes in response to precise hyperoxic gas challenges have not been quantified in healthy human parenchyma. This is likely due to the extended scan duration required, combined with the need to perform repeated measurements under various hyperoxic states. Thus, the actual effect of increasing arterial O2 concentration on cerebral tissue T1 remains uncertain. The aim of this work was to use fast, high-resolution direct T1 mapping at 7T to measure brain tissue and CSF T1 changes in response to precisely controlled hyperoxic respiratory challenges.
Materials and methods
Breathing protocol
This study was approved by the Medical Research Ethics Committee (MREC) of our institution and written informed consent was obtained from all subjects. The experiments were performed according to the guidelines and regulations of the WMO (Wet Medisch Wetenschappelijk Onderzoek). Ten Healthy subjects (3 female, 30 ± 7 years) were scanned on a Philips 7T magnetic resonance imaging (MRI) scanner using a dual-transit head coil in combination with a 32 channel receive coil (Nova Medical, Wilmington Ma, USA). Precise targeting of end-tidal O2 partial pressure (PetO2) was accomplished using a RespirAct™ system (Thornhill Research, Toronto, CAN). The RespirAct device consists of a computer controlled gas blender which connected to four input gases: medical air, 100% oxygen, 10%/20%/70% CO2/O2/N2 mixture and 10%/90% O2/N2 mixture. An output line connects the blender to a rebreathing circuit which is taped to the subject to ensure an airtight seal using Tegaderm film (3 M, Maplewood, MN, USA). Two sensor lines are connected which monitor end-tidal gas values and breathing pressure. The rebreathing circuit described in ensures that all gas delivered to the subject is inhaled, facilitating precise targeting of end-tidal gas values. An in-depth description of the breathing circuit and the theory behind the sequential gas delivery system can be found in Slessarev et al.18
Separate whole brain T1 maps were acquired during four targeted PetO2 levels. PetO2 targets were randomized and included baseline (approximately 110 mmHg), 250 mmHg, 350 mmHg, and 500 mmHg (see Figure 1). To examine potential time-dependent T1 changes in response to a large hyperoxic stimulus, two additional T1 maps were acquired during hyperoxic stimulus targeted with PetO2 targeted at 500 mmHg. Including the initial time allowed for the PetO2 values to stabilized, acquisition of the three consecutive T1 maps was completed after approximately 6, 10, and 14 minutes. Throughout the course of the imaging protocol, end-tidal CO2 (PetCO2) was maintained at individual subject baseline levels in order to minimize vasodilation-related flow effects.
Figure 1.

PetO2 breathing trace for a representative subject. Four separate T1 maps are acquired at different PetO2 levels. Targeted values include baseline PetO2, 250 mmHg, 350 mmHg and 500 mmHg. Image acquisition is performed when PetO2 values reach a stable plateau – this is highlighted by the red traces.
Image acquisition & T1 fitting
Prior to T1 mapping, a B0 map was acquired (3D gradient-echo, TR/TE: 4/1.54 ms, scan duration: 11.4 s, reconstructed resolution: 3.75 mm3, slices: 29, FOV: 240 × 112.5 × 180 mm3, flip angle: 10°). This map was used to perform third-order image-based B0 shimming. T1 maps were acquired using a non-slice selective adiabatic inversion pulse, which served to minimize inflow effects relating to limited transmit coil volume, followed by sequential acquisition of slices at increasing inversion times along the T1 recovery curve. This process was repeated over 23 scans. For each repetition, the acquired slice order was shifted such that each slices were acquired at 23 distinct inversion times – for details see Polders et al.19 Scan parameters were as follows: multi-slice single-shot echo planar imaging (EPI), inversion time range: 132.2–5074.4 ms, inversion time spacing: 224.6 ms, TR/TE: 10,000/9.42 ms, scan duration: 4 min, reconstructed resolution: 1 × 1 × 1.5 mm3, slices: 46, FOV: 224 × 224 × 91.5 mm3, flip angle: 150°, SENSE factor: 3.6 (AP), Halfscan factor: 0.61. Post processing was done using an IDL tool whereby slices were re-ordered and temporally consistent image volumes were reconstructed. From here, a voxel-wise T1 fit was performed assuming complete inversion (i.e. a two parameter fit) to generate whole brain, high-resolution T1 maps. Further details pertaining to this T1 mapping method are described in literature.19–21
Data processing
Brain tissue was extracted from each T1 map by manual delineation (10 subjects × 4 O2 levels = 40 T1 maps in total). A whole brain probability density histogram was generated from each brain extracted T1 map. Normalized histograms representing T1 values at each O2 level were then averaged together such that global T1 changes in response to hyperoxia could be investigated. The approximate histogram bin-width was 7 ms. To examine regional changes, binary ROI masks were created by thresholding of individual T1 maps using the following T1 values derived from the mean whole brain histogram: white matter (WM): 800–1300 ms, gray matter (GM): 1300–1900 ms, and total cerebrospinal fluid (CSFTotal): 3000 ms+). The CSFTotal masks (see Figure 2(a)) were manually segmented to isolate CSF located in the ventricles (CSFv) and sulci (CSFs). ROI masks were eroded using a 2D diamond-shaped kernel with a center-to-edge width of one voxel to reduce partial volume effects at tissue interfaces. T1 changes were investigated in regions showing an observable T1 response to hyperoxia and resulted in an estimate of relaxivity (r1) for O2 dissolved in CSF via linear regression of R1 (R1 = 1/T1) as a function of PetO2. An additional R1 value was fitted based on the single subject T1 data in which three T1 maps were acquired at a targeted PetO2 of 500 mmHg. This fit was performed using the T1 data acquired during the baseline period and the average T1 data from the T1 maps acquired during the two final hyperoxic periods (approximately 6–15 min after onset of hyperoxic stimulus).
Figure 2.
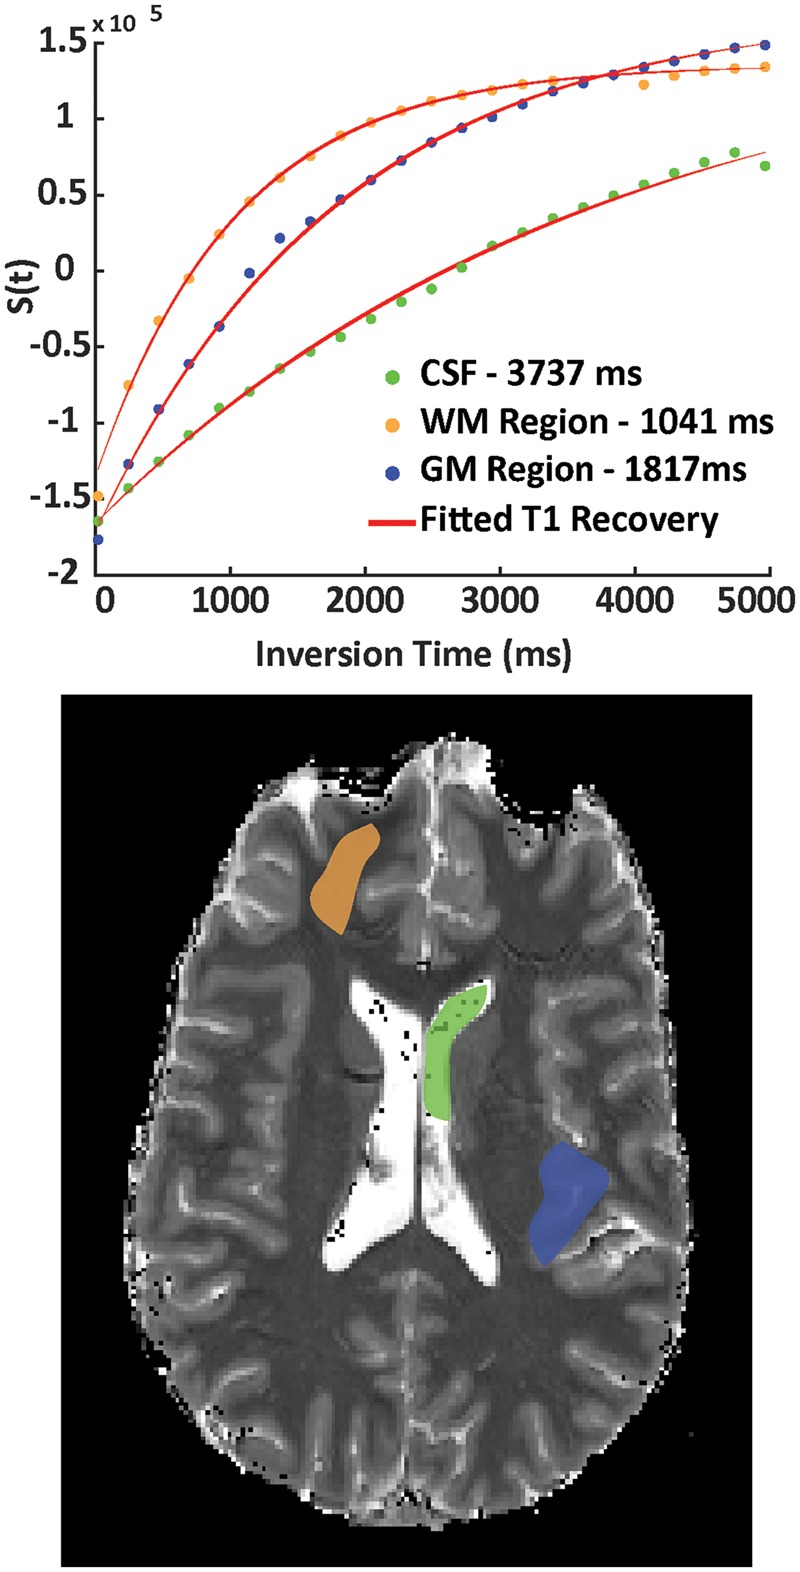
Examples of fitted T1 recovery curves (top panel) are shown for respective CSF (green), GM (blue) and WM (orange) ROIs taken from a single slice to illustrate the quality of the T1 inversion recovery data. ROIs are overlaid on the corresponding T1 map (bottom panel) which was obtained during a PetO2 target of 350 mmHg.
Statistical analysis
The average and standard deviation of median T1 values were calculated for all subjects in each GM, WM, and CSF ROI. Median values were chosen to alleviate the effect of outlying T1 values and also due to the fact that regional T1 values were not normally distributed. Other measured data is reported as mean ± standard deviation. T1 changes in response to hyperoxic challenges from each ROI were tested for significance using a one-way ANOVA with three degrees of freedom.
Results
Subjects reported no discomfort relating to the hyperoxic breathing challenges. Aside from the mean inter-subject baseline PetO2 (mean ± standard deviation: 109 ± 2 mmHg), achieved PetO2 values averaged across all 10 subjects were 247 ± 2 mmHg, 349 ± 1 mmHg, and 487 ± 1 mmHg for the three respective hyperoxic challenges. Each subjects PetCO2 were maintained at their individual baseline value. The average PetCO2 across all subjects was 36 ± 2.5 mmHg and the average intra-individual standard deviation (of baseline PetCO2 over the duration of a hyperoxic challenge) was 1.4 ± 0.5 mmHg.
In general, the data quality associated with the T1 fitting procedure was high (Figure 2). This facilitated robust fitting of voxel-wise T1 values; average probability density histograms for whole brain at each O2 level are shown in Figure 4. Corresponding box plots generated based on ROIs indicated in Figure 3(a) are shown in Figure 5. No significant differences were observed in GM (p = 0.98, F(3) = 0.06) or WM (p = 0.99, F(3) = 0.01) T1 (Table 1). T1 values in CSFTotal were significantly different (p < 1 × 10⁻⁶, F(3) = 15.9) and became shorter with increasing PetO2. This shortening was mainly due to T1 changes in CSFS (p < 1 × 10⁻¹⁰, F(3) = 24.19), as limited changes were seen in CSFV (p = 0.7, F(3) = 0.28). The fitted r1 of O2 in CSFS and CSFV were 3.3e−5 s−1/mmHg (adj. R2 = 0.97, RMSE = 1.2e−3) and 3.8e−6 s−1/mmHg (adj. R2 = 0.35, RMSE = 6.1e−4), respectively (Table 1, Figure 5). The average number of voxels included in the CSFS and CSFV masks across all subjects and O2 levels were 12854 and 2476, respectively.
Figure 4.

Whole brain probability density histograms (bin-width = 7 ms) created by averaging T1 data across 10 subjects. The mean and standard deviation of T1 probability values are provided. No changes were detected in GM or WM (inset: top left and right). T1 shortening was observed in CSF (inset: bottom). This was the case in all subjects.
Figure 3.

(a) Left is a single slice from a T1 map obtained at baseline PetO2. T1 values are thresholded (tissue specific intensity peaks are shown in Figure 3(b)) to obtain tissue/region specific masks (right). These include GM and WM parenchymal tissue as well as CSF. The CSF mask is manually divided into ventricle and sulci CSF. Figure 3(b): Whole probability density histograms (bin-width = 16 ms) from a single subject for all different PetO2 levels are overlaid. No observable change in GM or WM parenchymal T1 are apparent (middle and top inset: 3(b)). CSF T1 values become shorter as a function of PetO2 (bottom inset: 3(b)). Two additional T1 maps were obtained at a targeted PetO2 of 500 mmHg (5001 and 5002 mmHg) which illustrate a time-dependence on T1 changes in the CSF, confirming results presented in (11).
Figure 5.

Box plots generated from median T1 values across all subjects based on ROIs depicted in Figure 2(a). No significant changes were observed in GM, WM or CSFV. The observed T1 shortening in total CSF was mainly determined by changes measured in the CSFS. The red bars indicate median values, the whiskers define the range of the data while red crosses represent outliers. The boxes top and bottom of each box represent the 75th and 25th percentile for the dataset, respectively.
Table 1.
Average regional T1 values at each PetO2 level. Results of fitting relaxivity (r1) for CSFV is provided (left).
| Average median T1 ± Standard deviation (ms) |
Fitted relaxivity (r1) |
|||||
|---|---|---|---|---|---|---|
| Region | Baseline | 247 mmHg | 349 mmHg | 487 mmHg | Slope (s−1/mmHg) | Offset (s−1) |
| CSFS* | 4183 ± 54 | 4070 ± 54 | 4032 ± 64 | 3970 ± 57 | 3.31e-05 | 0.2363 |
| CSFVns | 4391 ± 63 | 4366 ± 61 | 4380 ± 68 | 4358 ± 72 | Na | NA |
| GMns | 1634 ± 11 | 1635 ± 11 | 1633 ± 13 | 1633 ± 9 | NA | NA |
| WMns | 1083 ± 27 | 1082 ± 26 | 1083 ± 25 | 1082 ± 26 | NA | NA |
GM: gray matter; WM: white matter; CSF: cerebrospinal fluid.
Whole brain probability density histograms of T1 values calculated at each O2 level are shown for a single subject in Figure 3(b). Comparison of intra-subject T1 histograms highlights the robustness of the T1 mapping procedure. T1 values associated with GM and WM tissue appear unchanged, while those of CSF were notably shortened. In this particular subject, an additional two T1 maps were acquired during the 500 mmHg PetO2 target in order to investigate potential delays in O2-induced T1 effects. While a further decrease in CSF T1 was observed in the second T1 map, limited changes were observed in the third T1 map (Figure 3(b): inset bottom). The baseline (105.7 ± 2 mmHg) and actual PetO2 measured in the single subject during the 500 mmHg target (actual PetO2: 493.8 ± 0.8 mmHg), along with the corresponding median CSFS R1 values of 0.2521 s−1 (baseline PetO2) and 0.2571 s−1 (average of CSFS R1 between second and third T1 maps) yielded a r1 for dissolved O2 of 1.306 × 10⁻⁵ s−1/mmHg (see Figure 6). The fit offset was 0.2507 s−1, which corresponds to an O2-free CSFS T1 of approximately 3851 ms in this particular subject.
Figure 6.
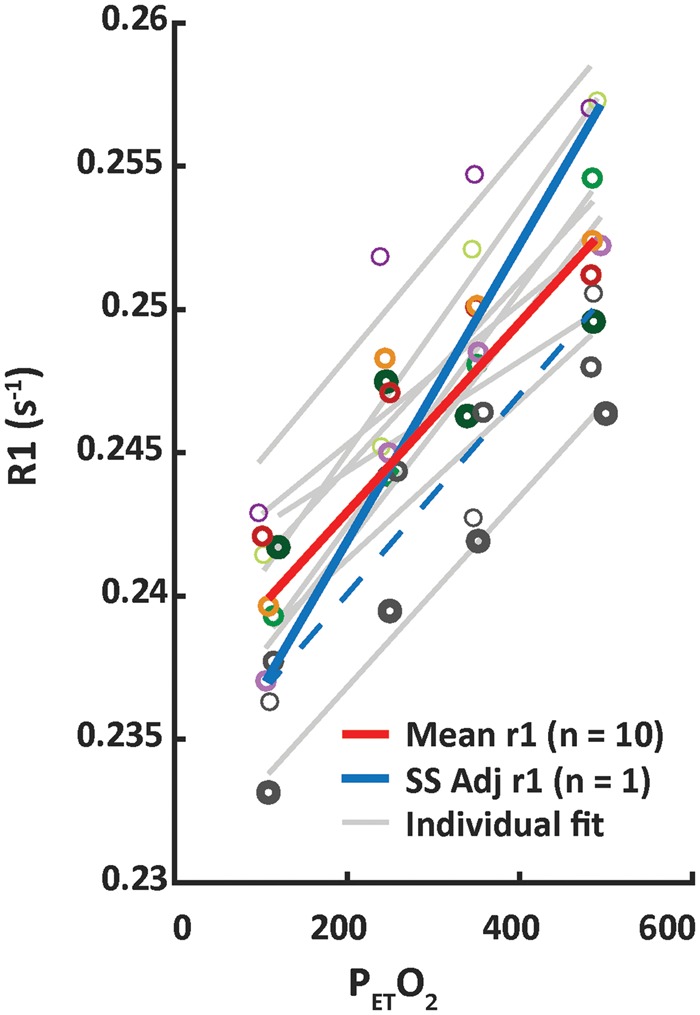
The solid red line depicts the CSFS relaxivity (r1–s−1/mmHg PetO2) fitted based on the median T1 values averaged across 10 subjects in CSFS (adj R2 = 0.94). For reference, individual subject data points and associated fit results for individual subjects are shown in grey. Additional T1 maps were acquired at high PetO2 in a single subject to investigate whether there was a time dependency on T1 changes. An additional relaxivity calculated based on single subject (Figure 3(b)) T1 values at baseline and after approximately 10 min of hyperoxia with PetO2 targeted at 500 mmHg is depicted by the solid blue line. The fit result based on this single subject across the increasing PetO2 values is highlighted by the dashed blue line (rather than solid grey as with the remaining 9 subjects). Changes in CSFV were not significant, and are not shown.
Discussion
Main findings
We did not observe significant changes in either GM, WM T1 values as a function of PetO2. There was an inverse relationship between PetO2 and T1 in the CSFS, however. Reductions in T1 of the ventricles were not significant, confirming previous results from the literature.3,11,12 However, baseline T1 in the CSFV was higher than in the CSFS. CSFTotal T1 values were in line with those reported by Hopkins et al.,22 who found an average T1 in CSF (including CSFV and CSFS) of approximately 4.3 s for measurements made between 0.15 and 1.4 T. Furthermore, our CSFTotal T1 results follow those reported by Rooney et al.23 who measured a CSFTotal T1 at 7T of 4425 ± 137, thus lending further support to the observation that CSF T1 is relatively field strength independent. This does not seem to be the case for the r1 of dissolved oxygen, however. Our fitted r1 of O2 in CSFS (3.3e−5 s−1/mmHg) was an order of magnitude smaller than that found by Zaharchuk et al.24 for the r1 of dissolved O2 in distilled water (2.49 e−4 s−1/mmHg)24 and artificial CSF (2.7 e−4 s−1/mmHg)11 measured at 1.5 T. This discrepancy is likely due to the fact that we used a surrogate measure of oxygenation changes in PetO2, and that our measurements were performed in vivo at a higher field strength. Finally, the time required to reach peak CSFTotal T1 changes in response to the most prolonged hyperoxic step used in our experiments was on the order of 10–12 min. These time-to-peak values are in agreement with those reported in literature25–27 of approximately 10–15 minutes.
Potential factors, in addition to baseline pO2, which could lead to variations in CSF T1 include differences in temperature or CSF protein content. It is unlikely, however, that significant temperature variations exist between peripheral and central regions of the head. Furthermore, the T1 relaxivity of proteins contained within the CSF, along with their concentrations, is low. Variations in CSF protein content large enough to cause significant signal effects are only likely in disease situations.25 Thus, we do not expect variations in temperature or protein content to explain the regional T1 differences measured in our healthy subject group. Variation between CSFS and CSFV may be partially attributed to differences in O2 content. The CSF compartment provides a considerable reservoir of unbound water, into which plasma O2 is able to diffuse from the vasculature. Due to the large network of vessels located on the cortical surface, effectively increasing the surface area through which O2 can diffuse, it stands to reason that the amount of O2 diffusing into the CSFS is higher than that to the CSFV. Conclusions drawn from previous animal studies have indicated direct diffusion of O2 between arteries and CSF,26,28 and this mechanism has also been discussed in the context of T1 changes in human studies by Mehemed et al.12 The large volume occupied by the ventricles may also explain the elevated baseline T1 in CSFV. It is likely CSFS mask erosion did not completely eliminate partial volume effects between CSFS and the surrounding vasculature and tissues that have much lower T1 values; especially since our volunteer group consisted of young subjects. Thus, CSFS voxels may have contained a larger tissue/vasculature fraction than those selected in the CSFV. Small changes in blood volume fraction due to hyperoxia-mediated vasoconstriction could lead to a local reduction in CBV which may raise intra-voxel T1 via a higher fractional CSF T1 contribution. However, this effect was not observed in our data. Subsequent studies using varying voxels size can aid elucidating what the exact contribution is of partial volume effects of CSFS with the pial vasculature and adjacent tissues. The lack of T1 changes in CSFV may be explained by the ratio of CSF to vessel density in that region compared to CSFS. The ventricles compose a large reservoir of CSF where the slow dilution of O2 could mitigate O2-dependent T1 reduction.
An interesting result in our study was the absence of detectable T1 changes in the brain parenchyma despite studies reporting tissue pO2 increases under hyperoxia directly using oxygen probes in the healthy brain tissue of comatose patients29 or those suffering from severe traumatic brain injury.30,31 In these cases, changes in cerebral hemodynamics may have played a role in the tissue response to hyperoxia. Our results support findings in healthy subjects which are reported in Anzai et al.,3 where comparison of FLAIR image signal intensity changes under hyperoxia did not identify O2-related effects in the brain parenchyma or in the lateral ventricles. Our findings are also in line with the work of Zaharchuk et al.,11 who also failed to identify O2-dependent tissue T1 changes, reporting only changes in the sulci and basilar cisterns. It should be noted, however, that the sequences used in these studies were optimized for sensitivity to changes at the higher T1 values of CSF than those typically found in tissues.
For the levels of O2 used in our study, arterial oxygen saturation in our healthy volunteers was presumably between 98 and100%.32 Notwithstanding potential vasoactive effects, it is known that hyperoxia results in a BOLD signal due to increased venous hemoglobin saturation.33 This suggests that, under hyperoxia, the extravascular tissue O2 demand is partially satisfied by a larger proportion of plasma-dissolved O2 rather than O2 that would normally have been released from hemoglobin. If we also consider the amount of O2 that diffuses into the CSF,26 it could be that the blood-tissue O2 gradient is simply not as large as might be expected. For this reason, no significant increases in O2 diffusion across the blood–brain barrier would occur and extravascular tissue T1 would remain largely unchanged. Or, the increased O2 which enters the tissues is immediately metabolized and does not contribute to T1 shortening. This would mean CMRO2 would slightly increase under hyperoxia. Direct measurements of tissue CMRO2 under hyperoxia, for instance using PET or O17 imaging, seem warranted to unequivocally rule out this effect.
This interpretation of our results challenges the results presented in literature;10,13 however, these studies did not employ quantitative imaging methods or precise gas control. It is conceivable that in-flow effects as well as residual BOLD T2* weighting at short TE, partial volume effects with CSF or global susceptibility effects relating to increasing oxygen gas concentration17 may have resulted in apparent tissue-O2-related signal changes. Note, however, that inflow effects by vasoconstriction or a drop in end-tidal pCO2 under hyperoxia and global susceptibility effects would result in an apparent T1 increase in T1-weighted sequences instead of the reported T1 decreases. This leaves residual BOLD T2* effects and partial volume effects with CSF as the most likely candidates for confounding apparent T1 reductions seen in tissue. Inversion recovery T1 mapping is insensitive to such confounds, since they are constant throughout the acquisition and are negated when fitting the T1 decay curve. On a voxel level, the error associated with T1 mapping method we have used is on the order of 1–1.5%.19 This translates to T1 variance of approximately 15–25 ms in GM. If tissue T1 does in fact shorten in response to hyperoxia, then changes must be under the threshold (∼15 ms) of our ability to detect them using our T1 mapping method. A similar conclusion can be made with regard to changes in blood water T1. Shortening of blood T1 due to dissolved O2 in the plasma is expected, however, since the blood fraction in a voxel is small (∼2–5%34), blood T1 changes are presumably diluted by extravascular tissue T1 contributions.
Direct measurement of pO2 in human CSF has been limited due to the invasive nature of the oxygenation measurements.35–37 Nevertheless, there is evidence that reduced CSF oxygen partial pressure in patients can be used as a possible biomarker to identify cerebral disease and brain injury. While we did not measure tissue T1 changes in response to hyperoxia, the changes observed in the CSF may serve as a benchmark from which to identify anomalies in CSF T1 stemming from cerebral metabolic dysfunction.
Considerations
Both animal26 and human11 studies have quoted time-to-peak delays of approximately 10–12 min for T1 changes in the CSF. This was also apparent in our study and is illustrated in Figure 3(b), where CSF T1 values continue to decrease during subsequent T1 map acquisitions at high PetO2. This indicates that T1 values were changing throughout our acquisition; this likely lead to an increased variance within our data. Furthermore, the relatively short scan-time (∼4 min) of our T1 mapping sequence has likely resulted in an underestimation of actual O2-dependent T1 changes. The extent of this effect can be inferred based on the additional single subject relaxivity estimations provided in Figure 6. Ideally, future experiments should allow for up to 15 min for pO2 levels in the CSF to equilibrate.
Notwithstanding the normal inter-subject variation in baseline values, the variance in PetCO2 remained minimal throughout the hyperoxic challenges. Thus, potential arterial oxygenation changes due to vasodilatory increases in CBF were minimal. This may not be true in experiments relying on free-breathing gas delivery methods that do not clamp arterial CO2. The potential vasoconstrictive effect of hyperoxia remains a topic of debate and it is uncertain how small reductions in CBF would affect our results given that oxygen saturation and the concentration of plasma-dissolved O2 will nevertheless remain high.
Conclusion
Despite the fact that we did not detect tissue T1 changes, we provided a reference point for T1 values is CSF as a function of PetO2. Future human studies examining potential tissue T1 changes under targeted hyperoxia in tissues with metabolic disorder are required. Moreover, care should be taken to distinguish actual parenchymal tissue T1 changes from those which may be related to partial volume effects with CSF or regions with increased fluid content such as edema.
Funding
This study was part of the EU Artemis High Profile Project and supported by the European Research Council, ERC grant agreement n°337333 (JJMZ).
Declaration of conflicting interests
The author(s) declared no potential conflicts of interest with respect to the research, authorship, and/or publication of this article.
Authors’ contributions
AAB: designed the protocol, acquired the data, analyzed the data, interpreted the data, and drafted the manuscript; JCW: acquired the data, interpreted the data, and revised the manuscript; PRL; revised the manuscript; JZ, MEPP, and HH interpreted the data and revised the manuscript.
References
- 1.Deliganis AV, Fisher DJ, Lam AM, et al. Cerebrospinal fluid signal intensity increase on FLAIR MR images in patients under general anesthesia: the role of supplemental O2. Radiology 2001; 218: 152–156. [DOI] [PubMed] [Google Scholar]
- 2.Goetz GF, Hecker H, Haeseler G, et al. Hyperintense cerebrospinal fluid on FLAIR images induced by ventilation with 100% oxygen. Clin Neuroradiol 2007; 17: 108–115. [Google Scholar]
- 3.Anzai Y, Ishikawa M, Shaw DW, et al. Paramagnetic effect of supplemental oxygen on CSF hyperintensity on fluid-attenuated inversion recovery MR images. AJNR Am J Neuroradiol 2004; 25: 274–279. [PMC free article] [PubMed] [Google Scholar]
- 4.Tadamura E, Hatabu H, Li W, et al. Effect of oxygen inhalation on relaxation times in various tissues. J Magn Reson Imag 1997; 7: 220–225. [DOI] [PubMed] [Google Scholar]
- 5.O'Connor JP, Jackson A, Buonaccorsi GA, et al. Organ-specific effects of oxygen and carbogen gas inhalation on tissue longitudinal relaxation times. Magn Reson Med 2007; 58: 490–496. [DOI] [PubMed] [Google Scholar]
- 6.Jones RA, Ries M, Moonen CTW, et al. Imaging the changes in renal T1 induced by the inhalation of pure oxygen: a feasibility study. Magn Reson Med 2002; 47: 728–735. [DOI] [PubMed] [Google Scholar]
- 7.Silvennoinen MJ, Kettunen MI, Kauppinen RA. Effects of hematocrit and oxygen saturation level on blood spin-lattice relaxation. Magn Reson Med 2003; 49: 568–571. [DOI] [PubMed] [Google Scholar]
- 8.Siero JC, Strother MK, Faraco CC, et al. In vivo quantification of hyperoxic arterial blood water T1. NMR Biomed 2015; 28: 1518–1525. [DOI] [PMC free article] [PubMed] [Google Scholar]
- 9.Zhang X, Petersen ET, Ghariq E, et al. In vivo blood T(1) measurements at 1.5 T, 3 T, and 7T. Magn Reson Med 2013; 70: 1082–1086. [DOI] [PubMed] [Google Scholar]
- 10.Haddock B, Larsson HB, Hansen AE, et al. Measurement of brain oxygenation changes using dynamic T(1)-weighted imaging. Neuroimage 2013; 78: 7–15. [DOI] [PubMed] [Google Scholar]
- 11.Zaharchuk G, Martin AJ, Rosenthal G, et al. Measurement of cerebrospinal fluid oxygen partial pressure in humans using MRI. Magn Reson Med 2005; 54: 113–121. [DOI] [PubMed] [Google Scholar]
- 12.Mehemed TM, Fushimi Y, Okada T, et al. Dynamic oxygen-enhanced MRI of cerebrospinal fluid. PloS One 2014; 9(6): e100723. [DOI] [PMC free article] [PubMed] [Google Scholar]
- 13.Remmele S, Sprinkart AM, Muller A, et al. Dynamic and simultaneous MR measurement of R1 and R2* changes during respiratory challenges for the assessment of blood and tissue oxygenation. Magn Reson Med 2013; 70: 136–146. [DOI] [PubMed] [Google Scholar]
- 14.O'Connor JP, Boult JK, Jamin Y, et al. Oxygen-enhanced MRI accurately identifies, quantifies, and maps tumor hypoxia in preclinical cancer models. Cancer Res 2016; 76: 787–795. [DOI] [PMC free article] [PubMed] [Google Scholar]
- 15.Brizel DM, Sibley GS, Prosnitz LR, et al. Tumor hypoxia adversely affects the prognosis of carcinoma of the head and neck. Int J Radiat Oncol Biol Phys 1997; 38: 285–289. [DOI] [PubMed] [Google Scholar]
- 16.Vergis R, Corbishley CM, et al. Intrinsic markers of tumour hypoxia and angiogenesis in localised prostate cancer and outcome of radical treatment: a retrospective analysis of two randomised radiotherapy trials and one surgical cohort study. Lancet Oncol 2008; 9: 342–351. [DOI] [PubMed] [Google Scholar]
- 17.Van de Moortele P-F, Pfeuffer J, Glover GH, et al. Respiration-induced B0 fluctuations and their spatial distribution in the human brain at 7 Tesla. Magn Resonan Med 2002; 47: 888–895. [DOI] [PubMed] [Google Scholar]
- 18.Slessarev M, Han J, Mardimae A, et al. Prospective targeting and control of end-tidal CO2 and O2 concentrations. J Physiol 2007; 581(Pt 3): 1207–1219. [DOI] [PMC free article] [PubMed] [Google Scholar]
- 19.Polders DL, Leemans A, Luijten PR, et al. Uncertainty estimations for quantitative in vivo MRI T1 mapping. J Magn Reson 2012; 224: 53–60. [DOI] [PubMed] [Google Scholar]
- 20.Ordidge RJ, Gibbs P, Chapman B, et al. High-speed multislice T1 mapping using inversion-recovery echo-planar imaging. Mag Reson Med 1990; 16: 238–245. [DOI] [PubMed] [Google Scholar]
- 21.Clare S, Jezzard P. Rapid T(1) mapping using multislice echo planar imaging. Magn Reson Med 2001; 45: 630–634. [DOI] [PubMed] [Google Scholar]
- 22.Hopkins AL, Yeung HN, Bratton CB. Multiple field strength in vivo T1 and T2 for cerebrospinal fluid protons. Magn Reson Med 1986; 3: 303–311. [DOI] [PubMed] [Google Scholar]
- 23.Rooney WD, Johnson G, Li X, et al. Magnetic field and tissue dependencies of human brain longitudinal 1H2O relaxation in vivo. Magn Reson Med 2007; 57: 308–318. [DOI] [PubMed] [Google Scholar]
- 24.Zaharchuk G, Busse RF, Rosenthal G, et al. Noninvasive oxygen partial pressure measurement of human body fluids in vivo using magnetic resonance imaging. Acad Radiol 2006; 13: 1016–1024. [DOI] [PubMed] [Google Scholar]
- 25.Melhem ER, Jara H, Eustace S. Fluid-attenuated inversion recovery MR imaging: identification of protein concentration thresholds for CSF hyperintensity. AJR Am J Roentgenol 1997; 169: 859–862. [DOI] [PubMed] [Google Scholar]
- 26.Kazemi H, Klein RC, Turner FN, et al. Dynamics of oxygen transfer in the cerebrospinal fluid. Respir Physiol 1968; 4: 24–31. [DOI] [PubMed] [Google Scholar]
- 27.Skinhoj E. Cisternal fluid oxygen tension in man. Acta Neurol Scand Suppl 1965; 13(Pt 1): 313–317. [PubMed] [Google Scholar]
- 28.Halmagyi DFJ, Gillett DJ. Cerebrospinal fluid oxygen tension at different levels of oxygenation. Respir Physiol 1967; 2: 207–212. [Google Scholar]
- 29.Kiening KL, Schneider GH, Bardt TF, et al. Bifrontal measurements of brain tissue-PO2 in comatose patients. Acta Neurochir Suppl 1998; 71: 172–173. [DOI] [PubMed] [Google Scholar]
- 30.Sarrafzadeh AS, Kiening KL, Bardt TF, et al. Cerebral oxygenation in contusioned vs. nonlesioned brain tissue: monitoring of PtiO2 with licox and paratrend. Acta Neurochir Suppl 1998; 71: 186–189. [DOI] [PubMed] [Google Scholar]
- 31.Hlatky R, Valadka AB, Gopinath SP, et al. Brain tissue oxygen tension response to induced hyperoxia reduced in hypoperfused brain. J Neurosurg 2008; 108: 53–58. [DOI] [PubMed] [Google Scholar]
- 32.Mutch WA, Patel SR, Shahidi AM, et al. Cerebral oxygen saturation: graded response to carbon dioxide with isoxia and graded response to oxygen with isocapnia. PloS One 2013; 8: e57881. [DOI] [PMC free article] [PubMed] [Google Scholar]
- 33.Kennan RP, Scanley BE, Gore JC. Physiologic basis for BOLD MR signal changes due to hypoxia/hyperoxia: separation of blood volume and magnetic susceptibility effects. Magn Reson Med 1997; 37: 953–956. [DOI] [PubMed] [Google Scholar]
- 34.Ogawa S, Menon RS, Tank DW, et al. Functional brain mapping by blood oxygenation level-dependent contrast magnetic resonance imaging. A comparison of signal characteristics with a biophysical model. Biophys J 1993; 64: 803–812. [DOI] [PMC free article] [PubMed] [Google Scholar]
- 35.Rossanda M, Gordon E. The oxygen tension of cerebrospinal fluid in patients with brain lesions. Acta Anaesthesiol Scand 1970; 14: 173–181. [DOI] [PubMed] [Google Scholar]
- 36.Venkatesh B, Boots R, Tomlinson F, et al. The continuous measurement of cerebrospinal fluid gas tensions in critically ill neurosurgical patients: a prospective observational study. Intens Care Med 1999; 25: 599–605. [DOI] [PubMed] [Google Scholar]
- 37.Charbel FT, Hoffman WE, Misra M, et al. Cerebral interstitial tissue oxygen tension, pH, HCO3, CO2. Surg Neurol 1997; 48: 414–417. [DOI] [PubMed] [Google Scholar]