Abstract
Surface-enhanced Raman scattering (SERS) provides a unique non-destructive spectroscopic fingerprint for chemical detection. However, intrinsic differences in affinity of analyte molecules to metal surface hinder SERS as a universal quantitative detection tool for various analyte molecules simultaneously. This must be overcome while keeping close proximity of analyte molecules to the metal surface. Moreover, assembled metal nanoparticles (NPs) structures might be beneficial for sensitive and reliable detection of chemicals than single NP structures. For this purpose, here we introduce thin silica-coated and assembled Ag NPs (SiO2@Ag@SiO2 NPs) for simultaneous and quantitative detection of chemicals that have different intrinsic affinities to silver metal. These SiO2@Ag@SiO2 NPs could detect each SERS peak of aniline or 4-aminothiophenol (4-ATP) from the mixture with limits of detection (LOD) of 93 ppm and 54 ppb, respectively. E-field distribution based on interparticle distance was simulated using discrete dipole approximation (DDA) calculation to gain insight into enhanced scattering of these thin silica coated Ag NP assemblies. These NPs were successfully applied to detect aniline in river water and tap water. Results suggest that SiO2@Ag@SiO2 NP-based SERS detection systems can be used as a simple and universal detection tool for environment pollutants and food safety.
Introduction
Surface-enhanced Raman scattering (SERS) is a sensitive optical detection tool. It is popular for identifying and detecting chemical and biological species due to its single molecular sensitivity and non-destructive feature [1–6]. Therefore, many researchers have extensively explored direct and label-free SERS detection strategies based on distinguished SERS peaks of molecules in biomedicine field for multiplex high-throughput screening and pollutant monitoring [7–10].
When SERS technique is used for chemical detection, only target molecules located close to the metal surface can be analyzed [11–13]. However, the observed SERS intensity is affected by the affinity of functional group to the metal surface rather than by the quantity of targets. For instance, molecules with stronger metal affinity such as thiol group-containing molecules can be adsorbed more strongly to the metal surface than those with weaker metal affinity, thus limiting simultaneous and quantitative detection of analytes with different metal-affinities. This remains a challenge to achieve universal and direct detection using SERS technique.
Metal nanostructures play important roles in generating SERS signals [14,15]. Up to date, single nanoparticle (NP) based structures such as gold NPs, silver NPs, and other metal-based structures have been widely used [16–29]. However, single NPs hinder broad application due to their low SERS activities [14,30,31]. To overcome this problem, aggregated Au or Ag NPs structures and anisotropic NPs such as gold nanochain and gold nanostar have been introduced to further enhance SERS signals [14,32–35]. they have also been used to detect various molecules [36–39]. Nanostructure containing Ag NPs on a silica NP core can produce intense SERS signals with a narrow intensity distribution for immunoassay and multiplexed bio-molecule detection [39–43].
Recently, Au NPs coated with thin and optically transparent silica shell have been used for food safety assessments and detecting environmental pollutants [44,45]. Although thin silica shell coated Au NPs have been used as SERS probes for detecting such chemicals, the problem of affinity differences of functional groups to the metal surface has not been solved. In addition, single Au NPs hinder broad application due to their low SERS sensitivity.
Assembled Au or Ag NPs with thin silica coating might exhibit intense SERS activity due to their many hot spots caused by assembled structure. Using a thin silica shell might solve the problem of affinity differences of various functional groups to the metal surface [14,31].
Recently, our group developed a nanostructure by assembling Ag NPs onto surface of silica NP. These structures have intense SERS activity due to their many hot spots, they have utilized highly sensitive SERS nanoprobe with several advantages such as easy handling and reproducibility of preparation [5,6,46]. Due to its sensitivity (up to single particle SERS measurement), the problem of affinity differences of various functional groups to the metal surface is solved. It can be used to detect various kinds of SERS signals of small molecules.
Here, we introduce thin silica shell coated Ag for assembled silica NPs (SiO2@Ag@SiO2 NPs). These SiO2@Ag@SiO2 NPs can generate several higher orders of magnitude in intensity of Raman scattering between hot junctions of Ag NPs in thin silica shell and Raman label compounds adjacent to the shell. These SiO2@Ag@SiO2 NPs could simultaneously detect a mixture of aniline (amine group containing chemical) and 4-aminothiophenol (thiol group containing chemical) by SERS. Limits of detection (LOD) for aniline and 4-aminothiophenol (4-ATP) were compared to test the feasibility of having a universal SERS substrate to quantify analytes. Optical properties of this structure were characterized using theoretical discrete dipole approximation (DDA) calculations. Their practical feasibility for detecting aniline in river water and tap water was also determined.
Experimental details
Chemicals and materials
Tetraethylorthosilicate (TEOS), 3-mercaptopropyl trimethoxysilane (MPTS), ethylene glycol, silver nitrate (AgNO3, 99.999%), octylamine, 4-aminothiophenol (4-ATP), and aniline were purchased from Sigma-Aldrich (St. Louis, MO, USA). Absolute ethanol (99.8%), ammonium hydroxide (NH4OH, 27%), oleic acid, and ethanol (98%) were purchased from Daejung (Siheung, Korea).
Preparation of Ag NPs assembled silica NPs
TEOS (1.6 mL) was dissolved in 40 mL of absolute ethanol containing 3 mL NH4OH and stirred vigorously at 25°C for 20 h. Resulting silica NPs were centrifuged at 8,500 rpm for 15 min, and washed with ethanol several times to remove the excess reagent. These silica NPs were functionalized with a thiol group. Briefly, 200 mg of silica NPs, 200 μL MPTS and 40 μL NH4OH were dispersed in 8 mL of ethanol. After the mixture was stirred at 25°C for 6 h, these MPTS-treated silica NPs were centrifuged at 8,500 rpm for 15 min, and washed several times with ethanol. After that, 25 mL aliquot of AgNO3 solution in ethylene glycol was mixed with MPTS-treated silica NPs thoroughly. Then 41.24 μL of 5 mM octylamine was added rapidly to this solution. The resulting dispersion was stirred at 25°C for 1 h. These silica Ag NPs were then centrifuged at 8,500 rpm for 15 min, and washed several times with ethanol. Oleic acid (1 mM) was then mixed with 10 mg of Ag NPs with stirring at 25°C overnight. The resulting surface modified NPs were recovered by centrifugation (13,000 rpm for 10 min) and washed several times with ethanol.
Thin silica coating of Ag NPs assembled silica NPs
MPTS (20 mM) and 3.71 μL NH4OH (27%) were added to the reaction mixture under vigorous stirring followed by shaking while adding TEOS (1:25 dilution with 27% NH4OH). The mixture was allowed to react at 25°C for 20 h. The prepared thin silica coating of Ag NPs assembled silica NPs were then centrifuged at 8,500 rpm for 15 min, and washed with ethanol five times, and re-dispersed in ethanol.
Raman instrument and measurements
Raman measurements were conducted using a confocal micro Raman system (LabRam 300, JY-Horiba) equipped with an optical microscope (Olympus, Tokyo, Japan). Raman scattered signals were collected in a back-scattering geometry and detected using a spectrometer equipped with a thermoelectrically cooled (−70°C) CCD detector. The excitation laser was focused. Raman signals were collected using a 10× objective lens (NA 0.25, Olympus). LOD of the thin shell NP system for detecting aniline was calculated based on standard deviation (SD) of the response and the slope of the calibration curve (S) at levels approximating the LOD [LOD = (SD/S)] using a laser beam with diameter of 2.6 μm. SiO2@Ag@SiO2 NPs were dispersed in aniline mixed 4-ATP in deionized water with EtOH for SERS measurements. 4-ATP was dispersed in water with pH 8. This was mainly caused by a dilution effect and the addition of HCl or NaOH. After 15 min of shaking, SiO2@Ag@SiO2 NPs were injected into a capillary tube. A similar process was applied to measuring LODs of aniline, 4-ATP, and aniline in river water and tap water. SERS spectra of all samples were measured using ×10 objective lens (NA 0.25) with photoexcitation at 532 nm, laser power of 10 mW, and acquisition time of 10 s.
Theoretical E-field calculation
E-fields of SiO2 encapsulated Ag NP monomer and Ag NP dimers with different inter-particle distances were calculated using DDA (DDSCAT 7.1) to support SERS enhancement of SiO2@Ag@SiO2 NPs [47]. Each dimension of the calculated structure was obtained from HR-TEM analysis. The diameter of an Ag NP was 16 nm. The thickness of the SiO2 shell was measured at 3 nm. The medium surrounding calculated structures was set to vacuum with a refractive index of 1.00+0i. The irradiated wavelength was at 532 nm.
Results and discussion
Preparation of thin shell coated Ag NPs
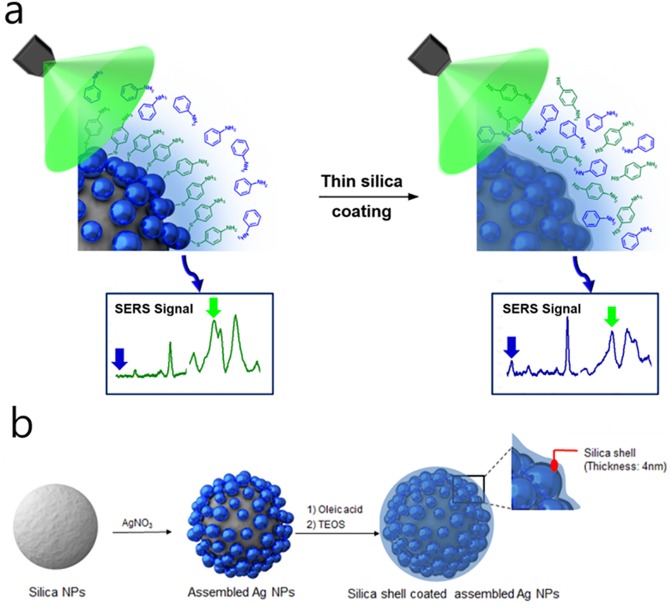
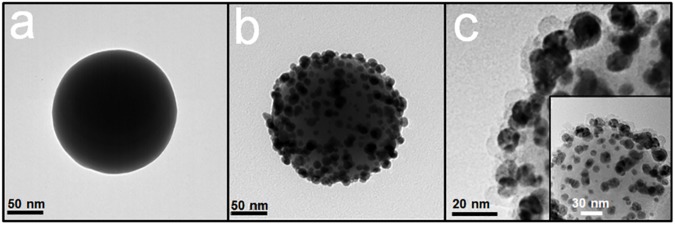
Fig 1 shows the fabrication flow for the proposed thin shell coated Ag NPs assembled on silica cores (SiO2@Ag@SiO2 NPs). These SiO2@Ag@SiO2 NPs had 4–5 nm of silica shell on Ag NPs assembled silica cores. Briefly, 180 nm silica core NPs were prepared using the Stӧber method (Fig 2A) [48–50]. These silica particles were functionalized with 3-mercaptopropyl-trimethoxysilane (MPTS) to introduce thiol group with high affinity for Ag NPs. These Ag NPs were then introduced onto thiol-modified silica core NPs using the modified polyol method [51–53]. Silver nitrate was dissolved in ethylene glycol as a reducing agent and solvent. They were then mixed with MPTS-treated silica NPs dispersion. After stirring, Ag NPs with diameter of 10 nm formed on the surface of silica cores (SiO2@Ag NPs; Fig 1B). Oleic acid was then added to these Ag NPs for fine control of the silica coating step to fabricate thin silica shell on the surface of these Ag NPs. A 4–5 nm of thin silica shell formed on these Ag NPs after adding MPTS and tetraethylorthosilicate (TEOS) to NPs dispersion under vigorous stirring (Fig 2C).
Fig 1. Schematic illustration of detection concept and fabrication process.
(a) Simultaneous quantitative detection of aniline and 4-aminothiophenol with thin silica shell coated Ag NP assembled structure (SiO2@Ag@SiO2 NP), (b) Overall fabrication scheme of desired structure.
Fig 2. Transmission electron microscopic images of fabricated nanostructure.
(a) Silica nanoparticle (NP), (b) SiO2@Ag NPs, and (c) SiO2@Ag@SiO2 NPs.
Comparison of silica coated SiO2@Ag NPs and SiO2@Ag NPs without silica coating
Occasionally, SERS signal can be affected by the affinity of an analyte functional group for the metal surface rather than by the quantity of targets [54,55]. In particular, metal has a strong affinity for thiol groups. Thus, available target molecules for SERS detection are highly limited. Aniline is widely used in dye, drug, and organic chemical industries. The toxicity of aniline is generally associated with methemoglobin formation and damage to red blood cells [56–60]. Aniline was chosen in this study as a non-thiol-containing model toxic chemical to show that these SiO2@Ag@SiO2 NPs could be used in broader applications using SERS for label-free detection. SiO2@Ag NPs and SiO2@Ag@SiO2 NPs were compared using aniline and 4-ATP containing thiol moiety.
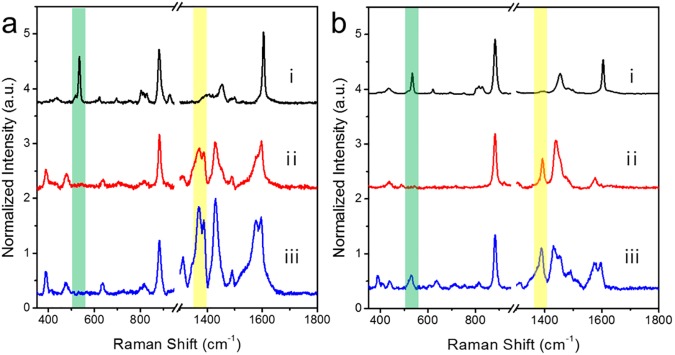
SiO2@Ag NPs and SiO2@Ag@SiO2 NPs were dispersed in 4-ATP or aniline solution. Both NPs exhibited unique aniline and 4-ATP SERS peaks at 520 and 1,390 cm−1, respectively (Fig 3A(i), 3A(ii), 3B(i) and 3B(ii)). This result indicates that SiO2@Ag@SiO2 NPs with a thin silica shell can be used for SERS-based chemical detection. In general, molecules with thiol-group have stronger affinity to the surface of gold and silver nanostructures than molecules with other functional groups such as amine. Therefore, in a mixture of various molecules, SERS intensity is dominated by molecules with thiol-groups. This phenomenon will reduce the generality of SERS detection, even though it is highly sensitive to single molecule level detection. However, such affinity propensity can be overcome by using thin shell of silica on SERS active surface. As shown in Fig 1, localized optical field was still strong at the surface of silica shell with thickness of 2–3 nm from the metal surface. Such surface prevented predominant interaction of thiol-groups with the surface, allowing other molecules such as aniline to be adsorbed onto silica surface. Their SERS intensities and thiolated molecules can be quantitatively measured. Ag NPs on a silica sphere have strong affinity for the thiol group in 4-ATP. Therefore, 4-ATP is dominantly adsorbed onto the Ag surface [61–63]. On the other hand, when a mixture of aniline and 4-ATP was added to SiO2@Ag@SiO2 NPs, 4-ATP and aniline SERS bands showed similar intensities (Fig 3B(iii)), indicating that both chemicals could be detected by SERS regardless of thiol content. Therefore, such SiO2@Ag@SiO2 SERS substrate can detect analytes regardless of their silver affinities.
Fig 3. Comparison of surface-enhanced Raman scattering (SERS) spectra of a non-thiol analyte (i; aniline), a thiol analyte (ii; 4-ATP) and their mixture (iii; same quantities of aniline and 4-ATP).
(a) Raman spectra of SiO2@Ag NPs and (b) SiO2@Ag@SiO2 NPs. Raman spectra were obtained by 532 nm photoexcitation and 10s acquisition. Intensities were normalized to Raman intensity of the ethanol peak at 882 cm−1. The characteristic aniline peaks were not detected in the spectrum of the mixture when the SiO2@Ag NP SERS substrate was used. However, both peaks of aniline and 4-ATP were detected at similar intensities when the SiO2@Ag@SiO2 NPs was used as SERS substrate. Baselines were adjusted for the clarity of comparison.
Detection of chemicals at various concentrations by SiO2@Ag@SiO2 NPs
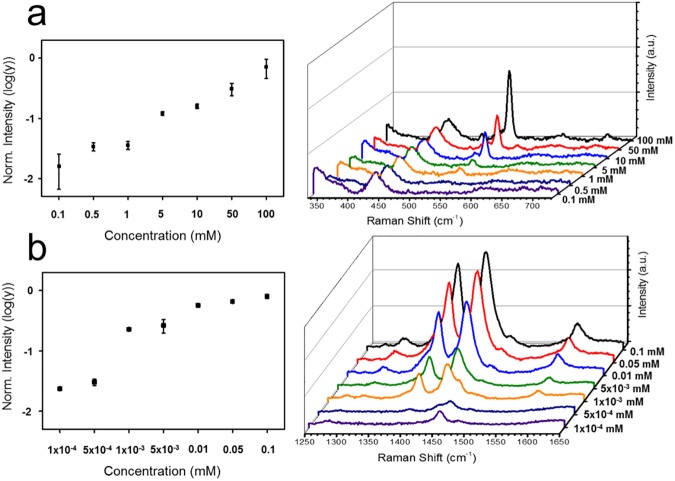
A control experiment was performed to demonstrate the sensitivity of thin shell-coated Ag NPs based SERS detection probe. SiO2@Ag@SiO2 NPs were added to ethanol solution containing various concentrations of aniline (0.1–100 mM). Fig 4A shows SERS signals of aniline at each concentration. It illustrates that these SiO2@Ag@SiO2 NPs are active SERS substrates suitable for quantifying analytes. Using the intensity at 520 cm−1 for Raman band characteristic of aniline, the LOD of SiO2@Ag@SiO2 NPs for aniline was found to be 93 ppm. Its dynamic range of detection was increased to 100 mM.
Fig 4. Limit of detection analysis with two different molecule.
Limit of detection of (a) aniline, (b) 4-ATP at various concentrations based on their corresponding surface-enhanced Raman scattering (SERS) signals using SiO2@Ag@SiO2 NPs. All Raman spectra were measured at laser power of 10 mW with acquisition time of 10 s. Intensities were normalized to Raman intensity of ethanol peak at 882 cm−1.
Fig 4B shows 4-ATP SERS signals at various concentrations (0.1 nM–0.1 mM). Using the intensity of 1390 cm−1 Raman band characteristic of 4-ATP, the LOD of SiO2@Ag@SiO2 NPs for 4-ATP was found to be 54 ppb. Its dynamic range of detection was increased to 0.1 mM. These results suggest that these SiO2@Ag@SiO2 NPs can be utilized for SERS detection of these chemicals.
Simulation of Raman signal enhancement by SiO2@Ag@SiO2 NPs
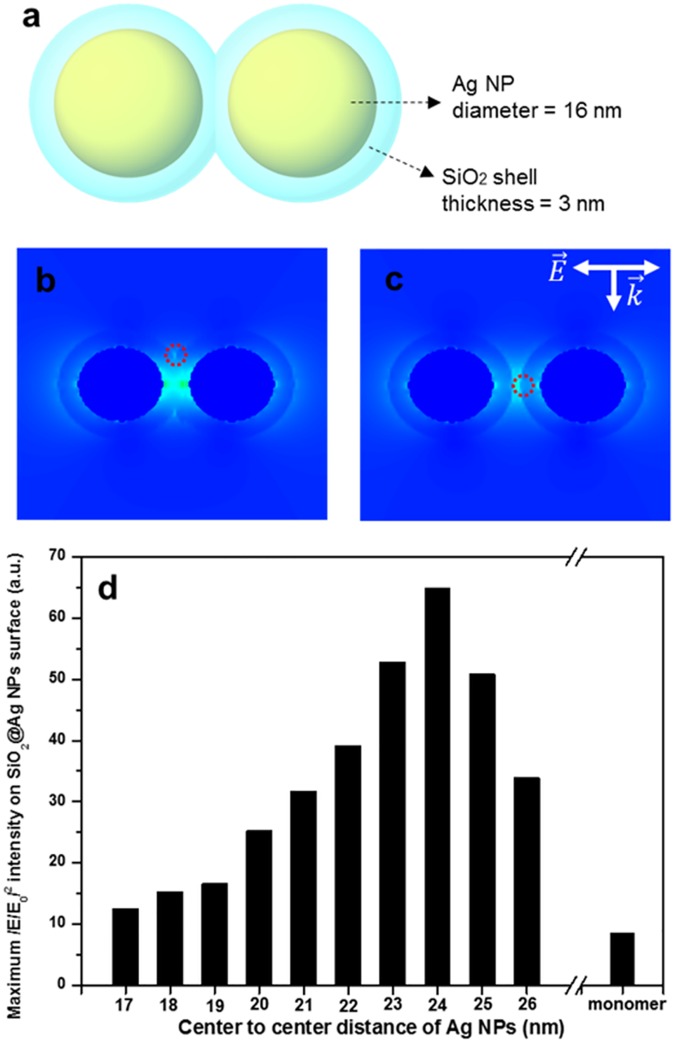
To gain insight into SERS enhancement of SiO2@Ag@SiO2 NPs, theoretical E-field distribution of SiO2@Ag NP monomer and dimers with different inter-particle distance was calculated by discrete dipole approximation (DDA). E-field distribution maps around the nanostructure and a plot of (E/E0)2 at the brightest spot on silica shell surface vs the center-to-center distance of Ag NPs are shown in Fig 5. As shown in the HR-TEM image (Fig 2C), the measured SERS intensity of SiO2@Ag@SiO2 NPs was an ensemble average of enhanced Raman scattered light by numerous Ag NP monomers and dimers on these SiO2@Ag@SiO2 NPs. As Ag NPs formed dimers, E-field intensity of dimers was increased compared to that of monomer due to E-field concentration between Ag NPs. Furthermore, the E-field intensity of Ag NP dimers was the highest when the distance between Ag NPs was at 8 nm. In this case, we took the value of optical field at the surface of silica shell rather than the center of inter-particle axis since molecules were assumed to be adsorbed onto the shell surface. These results indicate that SERS signals of Raman chemicals located on the silica surface of SiO2@Ag@SiO2 NPs can be enhanced compared to the same sized Ag NP monomer regardless of binding properties to the noble metal surface.
Fig 5. Theoretical simulation of optical fields for SiO2@Ag NPs with different inter-particle distance.
The wavelength of incident light was at 532 nm. (a) An illustrated model for the nanostructure used for calculation. (b) An E-field distribution map around the nanostructure when the center-to-center distance of two spheres is smaller than the outer diameter of a sphere. The area depicted in red circle is the brightest area on silica shell surface. (c) The same as in (b) when the center-to-center distance of two spheres is larger than the outer diameter of a sphere. The area depicted in red circle is the brightest area on silica shell surface. The area depicted in red circle of (b) and (c) is the maximum (E/E0)2 of silica shell surface and same region of interest (d). A plot of (E/E0)2 at the brightest spot on silica shell surface versus the center-to-center distance of Ag NPs.
Detecting aniline in river water and tap water using SiO2@Ag@SiO2 NPs
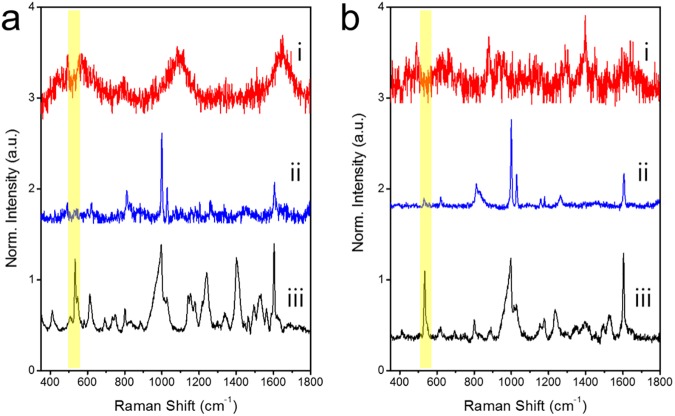
The efficacy of the SiO2@Ag@SiO2 NP method for detecting aniline in river or tap water samples was evaluated. Han River (South Korea) or tap water containing 1 drop of 100 mM aniline was aliquoted into 42 μm3 capillary tube which was calculated from the laser beam diameter of a Raman microscope system (×10 objective lens). The tube was filled with solvent. Approximately 0.5 mL of 1 mg/mL ethanol suspension containing the silica coated assembled Ag NPs was then added into the tube to allow interaction with aniline. SERS spectra were obtained using a micro Raman system. Fig 6A shows Raman spectra of the river water (i), river water containing aniline without silica coated assembled Ag NPs (ii), and river water containing aniline with silica coated assembled Ag NPs (iii). Only the mixture of river water and silica coated assembled Ag NPs exhibited a strong aniline peak. Aniline in the river water sample was detectable based on a 520 cm−1 peak. Fig 6B shows Raman spectra of tap water (i), tap water containing aniline without silica coated assembled Ag NPs (ii), and tap water containing aniline with silica coated assembled Ag NPs (iii). Tap water by itself did not contain an aniline signal which was evident as a Raman shift in the 520 cm−1 peak. Only tap water with aniline and silica coated assembled Ag NPs exhibited a strong aniline peak (Fig 6Biii).
Fig 6. Comparison of surface-enhanced Raman scattering (SERS) spectra.
(a) Raman spectra of river water. (i) River water only, (ii) aniline in river water with SiO2@Ag NPs, and (iii) aniline in river water with SiO2@Ag@SiO2 NPs. (b) Raman spectra of tap water. (i) Tap water only, (ii) aniline in tap water with SiO2@Ag NPs, (iii) aniline in tap water with SiO2@Ag@SiO2 NPs. All Raman spectra were measured at laser power of 10 mW with acquisition time of 10 s. Intensities were normalized to Raman intensity of ethanol peak at 882 cm−1.
Conclusion
In conclusion, thin silica shell coated Ag NPs assembled on silica NPs were fabricated in this study to detect aniline. Silica shell of SiO2@Ag@SiO2 NPs was finely controlled at a thickness of 4–5 nm. These SiO2@Ag@SiO2 NPs could detect SERS of aniline/4-ATP mixture, indicating that they could be used to detect non-thiol moiety within a thiol-based molecular mixture. LODs of these SiO2@Ag@SiO2 NPs for aniline and 4-ATP were 93 ppm and 54 ppb, respectively. E-field distribution of these assembled Ag NPs encapsulated in a silica shell was calculated by DDA. Such SiO2@Ag@SiO2 NP-based aniline detection system was successfully applied to river water and tap water. SiO2@Ag@SiO2 NP-based detection is a simple practical tool that expands the flexibility of SERS for useful applications in material science and life science. It can also be used for detection chemicals associated with food safety, drugs, explosives, and environmental pollutants.
Supporting information
(a) Ethylene glycol (upper layer) separated from the Ag NPs suspension; (b) oleic acid treated NPs (upper layer) separated from ethylene glycol; (c) dispersion of SiO2@Ag@SiO2 NPs in EtOH.
(TIF)
Detection limit of SERS spectra of (a) aniline (at 550 cm−1) and (b) 4-ATP (at 1,390 cm−1) using SiO2@Ag@SiO2 NPs. All spectra were measured by 532 nm photoexcitation of 10 mW laser power and 10 s acquisition. The aniline peaks were normalized to the ethanol peak at 882 cm−1. The pH of 4-ATP sample solution was maintained at 8.
(TIF)
Raman spectra of (a) Han river and (b) tap water. Both spectra were measured by 532 nm photoexcitation of 10 mW laser power and 10 s acquisition.
(TIF)
(a-j) E-field distribution of the SiO2@Ag NPs dimer with different inter-particle distances from 17–26 nm of center-to-center distances and (k) E-field distribution of SiO2@Ag NP monomer.
(TIF)
Acknowledgments
This work was supported by a grant (2016-A423-0045) of Bio & Medical Technology Development Program of the National Research Foundation (NRF) funded by the Korean government (MSIP & MOHW), and grant of the Korean Health Technology R&D Project, Ministry of Health & Welfare (HI17C1264)
Data Availability
All relevant data are within the paper and its Supporting Information file.
Funding Statement
This work was supported by the Bio & Medical Technology Development Program of the National Research Foundation (NRF) & funded by the Korean government (MSIP & MOHW) (2016-A423-0045), Korean Health Technology R&D Project, Ministry of Health & Welfare (HI17C1264). The funders had no role in study design, data collection and analysis, decision to publish, or preparation of the manuscript.
References
- 1.Hering K, Cialla D, Ackermann K, Doerfer T, Moeller R, Schneidewind H, et al. SERS: a versatile tool in chemical and biochemical diagnostics. Analytical and Bioanalytical Chemistry. 2008;390(1):113–24. doi: 10.1007/s00216-007-1667-3 [DOI] [PubMed] [Google Scholar]
- 2.Kudelski A. Analytical applications of Raman spectroscopy. Talanta. 2008;76(1):1–8. doi: 10.1016/j.talanta.2008.02.042 [DOI] [PubMed] [Google Scholar]
- 3.Zhao B, Xu W-Q, Ruan W-D, Han X-X. Advances in Surface-enhanced Raman Scattering—Semiconductor Substrates. Chemical Journal of Chinese Universities-Chinese. 2008;29(12):2591–6. [Google Scholar]
- 4.Alvarez-Puebla RA, Liz-Marzan LM. Traps and cages for universal SERS detection. Chemical Society Reviews. 2012;41(1):43–51. doi: 10.1039/c1cs15155j [DOI] [PubMed] [Google Scholar]
- 5.Kim H- M, Jeong S, Hahm E, Kim J, Cha MG, Kim K- M, et al. Large scale synthesis of surface-enhanced Raman scattering nanoprobes with high reproducibility and long-term stability. Journal of Industrial and Engineering Chemistry. 2016;33:22–7. [Google Scholar]
- 6.Kang H, Jeong S, Koh Y, Cha MG, Yang J-K, Kyeong S, et al. Direct identification of on-bead peptides using surface-enhanced Raman spectroscopic barcoding system for high-throughput bioanalysis. Scientific reports. 2015;5. [DOI] [PMC free article] [PubMed] [Google Scholar]
- 7.Kim H-M, Kang Y-L, Chung W-J, Kyeong S, Jeong S, Kang H, et al. Ligand immobilization on polydiacetylene-coated and surface-enhanced Raman scattering-encoded beads for label-free detection. J Ind Eng Chem. 2015;21:158–62. [Google Scholar]
- 8.Kneipp J, Kneipp H, Kneipp K. SERS-a single-molecule and nanoscale tool for bioanalytics. Chemical Society Reviews. 2008;37(5):1052–60. doi: 10.1039/b708459p [DOI] [PubMed] [Google Scholar]
- 9.Qian XM, Nie SM. Single-molecule and single-nanoparticle SERS: from fundamental mechanisms to biomedical applications. Chemical Society Reviews. 2008;37(5):912–20. doi: 10.1039/b708839f [DOI] [PubMed] [Google Scholar]
- 10.Jeong S, Kim Y-i, Kang H, Kim G, Cha MG, Chang H, et al. Fluorescence-Raman Dual Modal Endoscopic System for Multiplexed Molecular Diagnostics. Scientific reports. 2015;5. [DOI] [PMC free article] [PubMed] [Google Scholar]
- 11.Liang H, Li Z, Wang W, Wu Y, Xu H. Highly Surface-roughened "Flower-like" Silver Nanoparticles for Extremely Sensitive Substrates of Surface-enhanced Raman Scattering. Advanced Materials. 2009;21(45):4614–8. [Google Scholar]
- 12.Ngo HT, Wang H-N, Fales AM, Nicholson BP, Woods CW, Vo-Dinh T. DNA bioassay-on-chip using SERS detection for dengue diagnosis. Analyst. 2014;139(22):5655–9. doi: 10.1039/c4an01077a [DOI] [PubMed] [Google Scholar]
- 13.Shanmukh S, Jones L, Driskell J, Zhao Y, Dluhy R, Tripp RA. Rapid and sensitive detection of respiratory virus molecular signatures using a silver nanorod array SERS substrate. Nano Letters. 2006;6(11):2630–6. doi: 10.1021/nl061666f [DOI] [PubMed] [Google Scholar]
- 14.Wang Y, Yan B, Chen L. SERS Tags: Novel Optical Nanoprobes for Bioanalysis. Chem Rev. 2013;113(3):1391–428. doi: 10.1021/cr300120g [DOI] [PubMed] [Google Scholar]
- 15.Jones MR, Osberg KD, Macfarlane RJ, Langille MR, Mirkin CA. Templated Techniques for the Synthesis and Assembly of Plasmonic Nanostructures. Chem Rev. 2011;111(6):3736–827. doi: 10.1021/cr1004452 [DOI] [PubMed] [Google Scholar]
- 16.Jin X, Deng M, Kaps S, Zhu X, Hölken I, Mess K, et al. Study of Tetrapodal ZnO-PDMS Composites: A Comparison of Fillers Shapes in Stiffness and Hydrophobicity Improvements. PLOS ONE. 2014;9(9):e106991 doi: 10.1371/journal.pone.0106991 [DOI] [PMC free article] [PubMed] [Google Scholar]
- 17.Avasthi DK, Mishra YK, Kabiraj D, Lalla NP, Pivin JC. Synthesis of metal–polymer nanocomposite for optical applications. Nanotechnology. 2007;18(12):125604. [Google Scholar]
- 18.Tripathy SK, Mishra A, Jha SK, Wahab R, Al-Khedhairy AA. Microwave assisted hydrothermal synthesis of mesoporous SnO2 nanoparticles for ethanol sensing and degradation. Journal of Materials Science: Materials in Electronics. 2013;24(6):2082–90. [Google Scholar]
- 19.Mishra YK, Mohapatra S, Kabiraj D, Mohanta B, Lalla NP, Pivin JC, et al. Synthesis and characterization of Ag nanoparticles in silica matrix by atom beam sputtering. Scripta Materialia. 2007;56(7):629–32. [Google Scholar]
- 20.Wahab R, Tripathy SK, Shin H- S, Mohapatra M, Musarrat J, Al-Khedhairy AA, et al. Photocatalytic oxidation of acetaldehyde with ZnO-quantum dots. Chemical Engineering Journal. 2013;226:154–60. [Google Scholar]
- 21.Singhal R, Agarwal DC, Mohapatra S, Mishra YK, Kabiraj D, Singh F, et al. Synthesis and characterizations of silver-fullerene C70 nanocomposite. Applied Physics Letters. 2008;93(10):103114. [Google Scholar]
- 22.Tripathy SK, Mishra A, Jha SK, Wahab R, Al-Khedhairy AA. Synthesis of thermally stable monodispersed Au@SnO2 core-shell structure nanoparticles by a sonochemical technique for detection and degradation of acetaldehyde. Analytical Methods. 2013;5(6):1456–62. [Google Scholar]
- 23.Mishra YK, Chakravadhanula VSK, Hrkac V, Jebril S, Agarwal DC, Mohapatra S, et al. Crystal growth behaviour in Au-ZnO nanocomposite under different annealing environments and photoswitchability. Journal of Applied Physics. 2012;112(6):064308. [Google Scholar]
- 24.Singhal R, Agarwal DC, Mishra YK, Singh F, Pivin JC, Chandra R, et al. Electronic excitation induced tuning of surface plasmon resonance of Ag nanoparticles in fullerene C 70 matrix. Journal of Physics D: Applied Physics. 2009;42(15):155103. [Google Scholar]
- 25.Mohapatra S, Mishra YK, Avasthi DK, Kabiraj D, Ghatak J, Varma S. Synthesis of gold-silicon core-shell nanoparticles with tunable localized surface plasmon resonance. Applied Physics Letters. 2008;92(10):103105. [Google Scholar]
- 26.Mishra YK, Mohapatra S, Avasthi DK, Kabiraj D, Lalla NP, Pivin JC, et al. Gold–silica nanocomposites for the detection of human ovarian cancer cells: a preliminary study. Nanotechnology. 2007;18(34):345606. [Google Scholar]
- 27.Im Y-B, Wahab R, Ameen S, Kim Y-S, Yang OB, Shin H-S. Synthesis and Characterization of High-Purity Silica Nanosphere from Rice Husk. Journal of Nanoscience and Nanotechnology. 2011;11(7):5934–8. [DOI] [PubMed] [Google Scholar]
- 28.Papavlassopoulos H, Mishra YK, Kaps S, Paulowicz I, Abdelaziz R, Elbahri M, et al. Toxicity of Functional Nano-Micro Zinc Oxide Tetrapods: Impact of Cell Culture Conditions, Cellular Age and Material Properties. PLOS ONE. 2014;9(1):e84983 doi: 10.1371/journal.pone.0084983 [DOI] [PMC free article] [PubMed] [Google Scholar]
- 29.Wahab R, Hwang I, Kim Y-S, Shin H-S. Photocatalytic activity of zinc oxide micro-flowers synthesized via solution method. Chemical engineering journal. 2011;168(1):359–66. [Google Scholar]
- 30.Jun B- H, Kim G, Jeong S, Noh MS, Pham X-H, Kang H, et al. Silica Core-based Surface-enhanced Raman Scattering (SERS) Tag: Advances in Multifunctional SERS Nanoprobes for Bioimaging and Targeting of Biomarkers#. Bulletin of the Korean Chemical Society. 2015;36(3):963–78. [Google Scholar]
- 31.Driskell JD, Lipert RJ, Porter MD. Labeled Gold Nanoparticles Immobilized at Smooth Metallic Substrates: Systematic Investigation of Surface Plasmon Resonance and Surface-Enhanced Raman Scattering. J Phys Chem B. 2006;110(35):17444–51. doi: 10.1021/jp0636930 [DOI] [PubMed] [Google Scholar]
- 32.Wahab R, Dwivedi S, Khan F, Mishra YK, Hwang IH, Shin H- S, et al. Statistical analysis of gold nanoparticle-induced oxidative stress and apoptosis in myoblast (C2C12) cells. Colloids and Surfaces B: Biointerfaces. 2014;123:664–72. doi: 10.1016/j.colsurfb.2014.10.012 [DOI] [PubMed] [Google Scholar]
- 33.Mishra YK, Adelung R, Kumar G, Elbahri M, Mohapatra S, Singhal R, et al. Formation of Self-organized Silver Nanocup-Type Structures and Their Plasmonic Absorption. Plasmonics. 2013;8(2):811–5. [Google Scholar]
- 34.Kumar M, Sandeep CSS, Kumar G, Mishra YK, Philip R, Reddy GB. Plasmonic and Nonlinear Optical Absorption Properties of Ag:ZrO2 Nanocomposite Thin Films. Plasmonics. 2014;9(1):129–36. [Google Scholar]
- 35.Jun B-H, Kim G, Baek J, Kang H, Kim T, Hyeon T, et al. Magnetic field induced aggregation of nanoparticles for sensitive molecular detection. Physical Chemistry Chemical Physics. 2011;13(16):7298–303. doi: 10.1039/c0cp02055a [DOI] [PubMed] [Google Scholar]
- 36.Shiohara A, Langer J, Polavarapu L, Liz-Marzan LM. Solution processed polydimethylsiloxane/gold nanostar flexible substrates for plasmonic sensing. Nanoscale. 2014;6(16):9817–23. doi: 10.1039/c4nr02648a [DOI] [PubMed] [Google Scholar]
- 37.Jiang C, Guan Z, Rachel Lim SY, Polavarapu L, Xu Q-H. Two-photon ratiometric sensing of Hg2+ by using cysteine functionalized Ag nanoparticles. Nanoscale. 2011;3(8):3316–20. doi: 10.1039/c1nr10396b [DOI] [PubMed] [Google Scholar]
- 38.Polavarapu L, Xu Q-H. Water-Soluble Conjugated Polymer-Induced Self-Assembly of Gold Nanoparticles and Its Application to SERS. Langmuir. 2008;24(19):10608–11. doi: 10.1021/la802319c [DOI] [PubMed] [Google Scholar]
- 39.Kang H, Yim J, Jeong S, Yang J-K, Kyeong S, Jeon S-J, et al. Polymer-Mediated Formation and Assembly of Silver Nanoparticles on Silica Nanospheres for Sensitive Surface-Enhanced Raman Scattering Detection. ACS Appl Mater Interfaces. 2013;5(24):12804–10. doi: 10.1021/am404435d [DOI] [PubMed] [Google Scholar]
- 40.Polavarapu L, Pérez-Juste J, Xu Q-H, Liz-Marzán LM. Optical sensing of biological, chemical and ionic species through aggregation of plasmonic nanoparticles. Journal of Materials Chemistry C. 2014;2(36):7460–76. [Google Scholar]
- 41.Noh MS, Jun B-H, Kim S, Kang H, Woo M-A, Minai-Tehrani A, et al. Magnetic surface-enhanced Raman spectroscopic (M-SERS) dots for the identification of bronchioalveolar stem cells in normal and lung cancer mice. Biomaterials. 2009;30(23–24):3915–25. doi: 10.1016/j.biomaterials.2009.03.059 [DOI] [PubMed] [Google Scholar]
- 42.Jun B-H, Noh MS, Kim J, Kim G, Kang H, Kim M-S, et al. Multifunctional Silver-Embedded Magnetic Nanoparticles as SERS Nanoprobes and Their Applications. Small. 2010;6(1):119–25. doi: 10.1002/smll.200901459 [DOI] [PubMed] [Google Scholar]
- 43.Polavarapu L, Perez-Juste J, Xu Q-H, Liz-Marzan LM. Optical sensing of biological, chemical and ionic species through aggregation of plasmonic nanoparticles. Journal of Materials Chemistry C. 2014;2(36):7460–76. [Google Scholar]
- 44.Vo-Dinh T, Wang H-N, Scaffidi J. Plasmonic nanoprobes for SERS biosensing and bioimaging. Journal of Biophotonics. 2010;3(1–2):89–102. doi: 10.1002/jbio.200910015 [DOI] [PMC free article] [PubMed] [Google Scholar]
- 45.Li JF, Huang YF, Ding Y, Yang ZL, Li SB, Zhou XS, et al. Shell-isolated nanoparticle-enhanced Raman spectroscopy. Nature. 2010;464(7287):392–5. doi: 10.1038/nature08907 [DOI] [PubMed] [Google Scholar]
- 46.Hahm E, Jeong D, Cha MG, Choi JM, Pham X-H, Kim H-M, et al. β-CD Dimer-immobilized Ag Assembly Embedded Silica Nanoparticles for Sensitive Detection of Polycyclic Aromatic Hydrocarbons. Scientific Reports. 2016;6:26082 http://www.nature.com/articles/srep26082#supplementary-information. doi: 10.1038/srep26082 [DOI] [PMC free article] [PubMed] [Google Scholar]
- 47.Draine BT, Flatau PJ. Discrete-Dipole Approximation For Scattering Calculations. J Opt Soc Am A. 1994;11(4):1491–9. [Google Scholar]
- 48.Graf C, Vossen DLJ, Imhof A, van Blaaderen A. A general method to coat colloidal particles with silica. Langmuir. 2003;19(17):6693–700. [DOI] [PubMed] [Google Scholar]
- 49.Rossi LM, Shi LF, Quina FH, Rosenzweig Z. Stober synthesis of monodispersed luminescent silica nanoparticles for bioanalytical assays. Langmuir. 2005;21(10):4277–80. [DOI] [PubMed] [Google Scholar]
- 50.Costa CAR, Leite CAP, Galembeck F. Size dependence of Stober silica nanoparticle microchemistry. Journal of Physical Chemistry B. 2003;107(20):4747–55. [Google Scholar]
- 51.Park BK, Jeong S, Kim D, Moon J, Lim S, Kim JS. Synthesis and size control of monodisperse copper nanoparticles by polyol method. Journal of colloid and interface science. 2007;311(2):417–24. doi: 10.1016/j.jcis.2007.03.039 [DOI] [PubMed] [Google Scholar]
- 52.Tsuji M, Nishizawa Y, Matsumoto K, Kubokawa M, Miyamae N, Tsuji T. Effects of chain length of polyvinylpyrrolidone for the synthesis of silver nanostructures by a microwave-polyol method. Materials Letters. 2006;60(6):834–8. [Google Scholar]
- 53.Tsuji M, Nishizawa Y, Matsumoto K, Miyamae N, Tsuji T, Zhang X. Rapid synthesis of silver nanostructures by using microwave-polyol method with the assistance of Pt seeds and polyvinylpyrrolidone. Colloids and Surfaces a-Physicochemical and Engineering Aspects. 2007;293(1–3):185–94. [Google Scholar]
- 54.Jun B-H, Kim G, Noh MS, Kang H, Kim Y-K, Cho M-H, et al. Surface-enhanced Raman scattering-active nanostructures and strategies for bioassays. Nanomedicine. 2011;6(8):1463–80. doi: 10.2217/nnm.11.123 [DOI] [PubMed] [Google Scholar]
- 55.Wachsmann-Hogiu S, Weeks T, Huser T. Chemical analysis in vivo and in vitro by Raman spectroscopy-from single cells to humans. Current Opinion in Biotechnology. 2009;20(1):63–73. doi: 10.1016/j.copbio.2009.02.006 [DOI] [PMC free article] [PubMed] [Google Scholar]
- 56.Di Girolamo F, Campanella L, Samperi R, Bachi A. Mass spectrometric identification of hemoglobin modifications induced by nitrosobenzene. Ecotoxicology and environmental safety. 2009;72(5):1601–8. doi: 10.1016/j.ecoenv.2008.09.006 [DOI] [PubMed] [Google Scholar]
- 57.Khan MF, Wu XH, Kaphalia BS, Boor PJ, Ansari GAS. Nitrotyrosine formation in splenic toxicity of aniline. Toxicology. 2003;194(1–2):95–102. [DOI] [PubMed] [Google Scholar]
- 58.Abe T, Saito H, Niikura Y, Shigeoka T, Nakano Y. Embryonic development assay with Daphnia magna: application to toxicity of aniline derivatives. Chemosphere. 2001;45(4–5):487–95. [DOI] [PubMed] [Google Scholar]
- 59.Khan MF, Wu X, Ansari GAS. Contribution of nitrosobenzene to splenic toxicity of aniline. Journal of Toxicology and Environmental Health-Part A. 2000;60(4):263–73. [PubMed] [Google Scholar]
- 60.Pauluhn J. Subacute inhalation toxicity of aniline in rats: Analysis of time-dependence and concentration-dependence of hematotoxic and splenic effects. Toxicological Sciences. 2004;81(1):198–215. doi: 10.1093/toxsci/kfh187 [DOI] [PubMed] [Google Scholar]
- 61.Jiang X, Zeng Q, Yu A. Thiol-frozen shape evolution of triangular silver nanoplates. Langmuir. 2007;23(4):2218–23. doi: 10.1021/la062797z [DOI] [PubMed] [Google Scholar]
- 62.Li G, Zhao Z, Liu J, Jiang G. Effective heavy metal removal from aqueous systems by thiol functionalized magnetic mesoporous silica. Journal of hazardous materials. 2011;192(1):277–83. doi: 10.1016/j.jhazmat.2011.05.015 [DOI] [PubMed] [Google Scholar]
- 63.Hewage HS, Anslyn EV. Pattern-Based Recognition of Thiols and Metals Using a Single Squaraine Indicator. Journal of the American Chemical Society. 2009;131(36):13099–106. doi: 10.1021/ja904045n [DOI] [PubMed] [Google Scholar]
Associated Data
This section collects any data citations, data availability statements, or supplementary materials included in this article.
Supplementary Materials
(a) Ethylene glycol (upper layer) separated from the Ag NPs suspension; (b) oleic acid treated NPs (upper layer) separated from ethylene glycol; (c) dispersion of SiO2@Ag@SiO2 NPs in EtOH.
(TIF)
Detection limit of SERS spectra of (a) aniline (at 550 cm−1) and (b) 4-ATP (at 1,390 cm−1) using SiO2@Ag@SiO2 NPs. All spectra were measured by 532 nm photoexcitation of 10 mW laser power and 10 s acquisition. The aniline peaks were normalized to the ethanol peak at 882 cm−1. The pH of 4-ATP sample solution was maintained at 8.
(TIF)
Raman spectra of (a) Han river and (b) tap water. Both spectra were measured by 532 nm photoexcitation of 10 mW laser power and 10 s acquisition.
(TIF)
(a-j) E-field distribution of the SiO2@Ag NPs dimer with different inter-particle distances from 17–26 nm of center-to-center distances and (k) E-field distribution of SiO2@Ag NP monomer.
(TIF)
Data Availability Statement
All relevant data are within the paper and its Supporting Information file.


