Abstract
Encoding of reward valence has been shown in various brain regions, including deep structures such as the substantia nigra as well as cortical structures such as the orbitofrontal cortex. While the correlation between these signals and reward valence have been shown in aggregated data comprised of many trials, little work has been done investigating the feasibility of decoding reward valence on a single trial basis. Towards this goal, one non-human primate (macaca radiata) was trained to grip and hold a target level of force in order to earn zero, one, two, or three juice rewards. The animal was informed of the impending result before reward delivery by means of a visual cue. Neural data was recorded from primary somatosensory cortex (S1) during these experiments and firing rate histograms were created following the appearance of the visual cue and used as input to a variety of classifiers. Reward valence was decoded with high levels of accuracy from S1 both in the post-cue and post-reward periods. Additionally, the proportion of units showing significant changes in their firing rates was influenced in a predictable way based on reward valence. The existence of a signal within S1 cortex that encodes reward valence could have utility for implementing reinforcement learning algorithms for brain machine interfaces. The ability to decode this reward signal in real time with limited data is paramount to the usability of such a signal in practical applications.
I. Introduction
A neural representation of reward has long been known to exist within ‘reward neurons’ in deep structures of the brain such as the substantia nigra [1]. The effects of reward delivery in the form of liquid or food items was shown to increase the firing rate of these reward neurons immediately following the delivery of reward [1]. Further, this elevation in firing rate was found to shift its activity temporally to the presentation of a conditioned stimulus in a manner predictive of impending reward delivery [1]. This signal is modulated by progressively higher levels of reward in the orbitofrontal cortex [2]. These variants of reward-associated signals have the potential to augment the control of brain machine interfaces (BMI) via reinforcement learning algorithms capable of updating the BMI’s behavior based on the intent of the user [3,9]. Because most BMI implementations utilize signals recorded from the cortex, the use of substantia nigra for reward decoding and cortical structures for kinematic decoding is less attractive than using a single implant to decode both [3]. A reward-associated signal has been found to exist in several cortical structures, including orbitofrontal cortex, premotor cortices, and the primary motor cortex [2,3,4]. Further, a neural representation of reward valence, the positive or negative feelings associated with an outcome, has been shown in orbitofrontal cortex [4]. These signals in cortical structures, especially those found in premotor and primary motor cortices, could be especially useful in a BMI utilizing reinforcement learning algorithms to dynamically update its parameters [3]. The additional ability to decode reward magnitude and valence could be useful in deciding between multiple potential targets during BMI operation, one of which may be of a higher value to the user than others. II. Methods
A. Description of Psychophysical Task
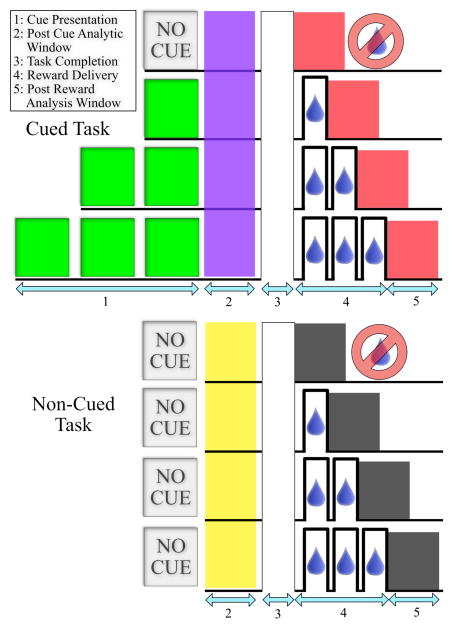
All animal manipulations described in this work were approved by the State University of New York, Downstate Medical Center’s Institutional Animal Care and Use Committee (IACUC). One non-human primate (macaca radiata) was trained to match and hold its applied grip force within a target force zone displayed on a screen in order to receive either 0, 1, 2, or 3 juice rewards (0 sec, 0.5 sec, 1.0 sec, or 1.5 sec of juice delivery delivered in discrete 0.5 second bursts of solenoid valve on time) for correctly completing a trial. Two variations of this task were used in these experiments. In the first, the animal was informed at the beginning of the trial of the level of reward to be delivered upon successful completion of that trial via a visual cue. In the second variation, the animal was not informed of a trial’s outcome before successful trial completion, and the level of reward delivered for successful trial completion was a surprise. In both trial types the probability of all reward levels was equal, and randomly selected to prevent the animal from predicting reward level before trial initiation (when a visual cue was present) or trial completion (when no visual cue was present). In both trial types described in this work, all aspects of the task from initiation to completion were identical with the exception of the presentation of the visual cue. If the animal attempted to touch the grip force sensor at any time before the target zone appeared, the trial would be aborted and no juice would be delivered. Additionally, once the animal’s grip force entered the target zone, the trial would be considered a failure and restart if the applied force exceeded or dropped out of the acceptable bounds before trial completion. To further prevent the animal from purposely failing in an attempt to quickly skip low reward value trials, any failed trial resulted in the subsequent trial being of the same reward value as the failed trial. Trials lasted a variable length of time and the animal was given the reward following a visual cue to release the grip force sensor. The specifics of both tasks are shown in Fig. 1.
Figure 1.
Cued and non-cued behavioral tasks
B. Data Acquisition
Following successful training the animal was implanted in primary somatosensory (S1) cortex with a microelectrode array (96-channel Utah array, 1.0mm length, Blackrock Microsystems) [5,6]. Following a healing period of two weeks, neural activity was recorded using a multi-acquisition processor system (MAP, Plexon Inc., Dallas, TX) controlled by a Windows PC. The task logic including all visual representations of the task, control of reward delivery, and coordination between force sensors built into the manipulandum and the visual representation of applied grip force were controlled via a PC running Ubuntu Linux using the Robot Operating System (ROS). Both systems were synchronized via a continuous 2kHz signal and all relevant task-related variables were sent to the MAP system from the ROS system via a data acquisition card (National Instruments). Neural spike waveforms were sorted offline (Offline Sorter, Plexon Inc, Dallax, TX).
C. Neural Data Analytic Methods
Firing rate histograms were generated for each successful trial in a 500ms time windows using 50ms bins immediately following the presentation of the final visual cue or delivery of the final reward for both tasks. In the non-cued task, the equivalent period of time in the task was used as a post-cue period for comparison to the cued version of the task. The combined rate histograms for all units were scaled and combined for all trials performed by the animal and subsequently reduced in dimension by transforming the data via principal component analysis (PCA) and retaining the first 25 components. The data was subsequently transformed further via linear discriminant analysis (LDA) and all 3 possible components were retained. As the LDA method can generate a maximum number of dimensions one fewer than the number of categories in a given dataset, and the number of reward states in this work was 4 (0,1,2, and 3), the maximum number of dimensions returned by LDA in this case was 3. Detailed descriptions of these methods can be found in [7,8]. The resulting final projected data were then used as features for classification. A Naive Bayes classifier was implemented to establish classification accuracy of the impending level of reward delivery in the post-cue period or the level of reward that was delivered in the post-reward period [10]. To compare accuracy of classification in terms of the number of true positives (tp), true negatives (tn) the number of false positives (fp), and the number of false negatives (fn), the true positive rate and true negative rate was calculated as shown below in (1) & (2).
| (1) |
| (2) |
In order to determine the percentage of units modulated by the reward state, comparisons were made for each unit between all possible reward combinations using a paired t-test. This comparison allowed the calculation of the percentage of units that were depressed or excited by higher levels of reward in each possible reward scenario combination.
III. Results
A. S1 Cortex Encodes Reward Valence
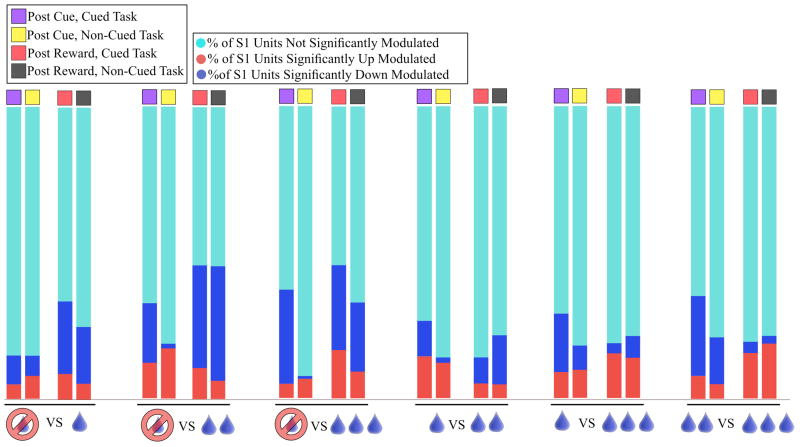
In general, as the difference between compared reward levels became greater, a higher percentage of units significantly changed their firing rates following presentation of a visual cue informing the animal of potential reward delivery level for successful task completion. The same effect was found to exist in the post-reward delivery period, but was strongest when comparing zero reward trials to some other level of reward (1, 2, or 3) in both post cue and post reward delivery periods. Additionally, the percentage of units showing a depressed firing rate for higher levels of reward as a percentage of all significant units increased in the post-cue but not the post-reward period as the difference between reward conditions increased. These effects are shown in Fig. 2. The number of neural units sorted from each experimental paradigm as well as the number of successful trials completed by the animal are presented in table 1 below.
Figure 2.
Percentage of units significantly modulated compared across reward states.
TABLE I.
Number of neural units recorded and number of trials performed by the animal in each experimental paradigm
| Experiment | Number of Units | Number of Trials |
|---|---|---|
| [0,1,2,3] Reward, Cued | 140 | 122 |
| [0,1,2,3] Reward, Non-Cued | 189 | 114 |
B. Reward Valence Can be Decoded Following Presentation of an Informative Visual Cue
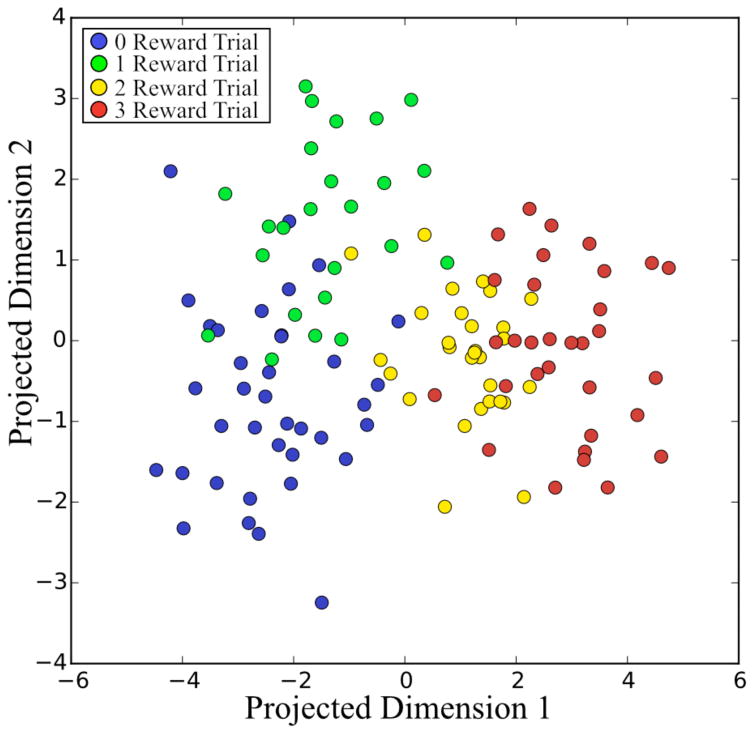
In the post-visual cue period, decoding accuracy was excellent in the task containing a visual cue and approached chance levels in the task lacking a visual cue for the same period. As a control, classification was repeated using randomly shuffled target values assigned to the neural data taken from the task containing a visual cue. In this case decoding accuracy also approached chance. A summary of these results including the false positive rate (1 - true negative rate) and false negative rate (1 – true positive rate) is shown in Table 2 and a spatial representation of the data in its final projected dimensions is presented in Fig. 3. The distribution of the trials in the final projected space shown in in Fig. 3 confirms the patterns shown in Fig. 2, namely that the separability between zero-reward trials and one-reward trials in the post-cue period is low and are further are very similar both in terms of the number of significant units as well as the percentage of those units increasing or decreasing their firing rates.
TABLE II.
Decoding reward value in the post cue period
| Condition | Mean True Positive Rate | Mean True Negative Rate | Mean False Positive Rate | Mean False Negative Rate |
|---|---|---|---|---|
| Cued | .81 | .94 | .06 | .19 |
| Non-Cued | .38 | .79 | .21 | .62 |
| Cued - Shuffled Targets | .35 | .83 | .17 | .65 |
Figure 3.
Final projected visualization of single trials in the post-cue period.
C. Reward Valence Can be Decoded Following Delivery of Reward
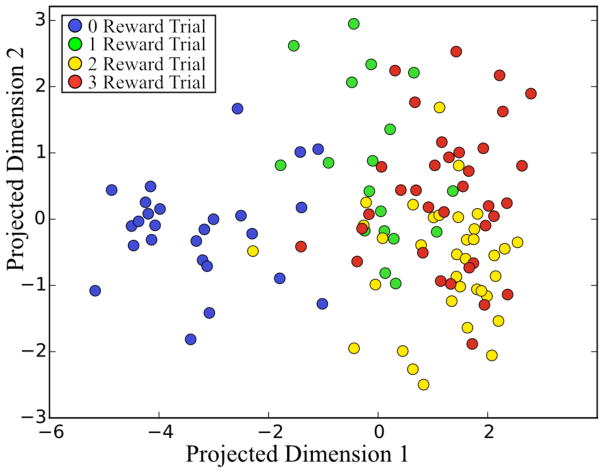
In the post-reward delivery period decoding accuracy was excellent in both cued and non-cued tasks. Decoding accuracy using randomly shuffled targets produced classification accuracy above chance, however, this is most likely due to either a low number of trials or higher variance in the neural data during this time window. These results are summarized in Table 3 and Fig. 4 below. Although the percentage of significant units found in the post-reward period was found to be variable as compared to the clear patterns found in the post-cue period the classification accuracy remains roughly the same. Further, the presence or absence of a visual cue in these experiments seems to have no bearing on the decoding accuracy obtainable from this post-reward analytic window. The data in its final projected space also confirms the results shown in Fig. 2; specifically, that the greatest differentiability in the post reward period is between the zero reward trials and trials delivering either one, two, or three rewards. Similar to the case in the post cue period, the spatial separation of two-reward trials and three-reward trials is low and the number of units significantly modulated by these different levels of reward are very similar to each other.
TABLE III.
Decoding reward value in the post reward period
| Condition | Mean True Positive Rate | Mean True Negative Rate | Mean False Positive Rate | Mean False Negative Rate |
|---|---|---|---|---|
| Cued | .65 | .89 | .11 | .35 |
| Non-Cued | .77 | .93 | .07 | .23 |
| Cued - Shuffled Targets | .35 | .83 | .17 | .65 |
Figure 4.
Projected visualization of single trials in the post-reward period.
IV. Conclusion
Much recent effort in the BMI field has been towards “closing the loop” - the provision of somatosensory feedback via electrical microstimulation along the sensory pathway during operation [11–14]. We have shown that S1 can also be used to decode reward state information. Utilizing this signal has potential application in the implementation of a reinforcement learning BMI (RL-BMI) [3]. Further, it has been shown that decoder accuracy for such a system to function can be as low as 70% [3]. Such a system would utilize reward state as critic in an RL-BMI; this technique has been described using reward state as decoded from M1 [3]. The work presented here raises the possibility of alternative implementations of this generic framework modified to include S1 cortex as another possible source of reward state information to be used either as an adjunct to decoding the signal from M1 or as a means of boosting reward state decoder accuracy. Ultimately this schema could be combined to both provide dynamic somatosensory feedback via microstimulation in S1 while simultaneously using both S1 and M1 for extraction of reward related information. Towards improving the characterization of reward representation within a broader area of the brain, this work shows an interesting effect of a drop in classifier performance in the post reward delivery period in experiments that made explicit the outcome of a given trial via a visual cue. This effect is suggestive of an effect characterized by Schultz in dopamine neurons in which a conditioned stimuli predictive of reward delivery attenuated the previously robust response of these units to reward delivery and shifted the response to the period immediately following presentation of the conditioned stimuli [1].
Acknowledgments
Research supported by DARPA Contract N66001-10-C-2008, NIH 1 R01 NS092894-01, NYS DOH Spinal Cord Injury Research C30838GG.
Contributor Information
David B. McNiel, State University of New York, Downstate Medical Center, Brooklyn, NY-11203, Department of Physiology and Pharmacology
John S. Choi, State University of New York, Downstate Medical Center, Brooklyn, NY-11203, Department of Physiology and Pharmacology
John P. Hessburg, State University of New York, Downstate Medical Center, Brooklyn, NY-11203, Department of Physiology and Pharmacology
Joseph T. Francis, University of Houston, Houston, TX 77204-6022, USA, Department of Biomedical Engineering, Cullen College of Engineering.
References
- 1.Schultz W, Dayan P, Montague P. A Neural Substrate of Prediction and Reward. Science. 1997;275(5306):1593–1599. doi: 10.1126/science.275.5306.1593. [DOI] [PubMed] [Google Scholar]
- 2.Tremblay L, Schultz W. Relative reward preference in primate orbitofrontal cortex. Nature. 1999;398(6729):704–708. doi: 10.1038/19525. [DOI] [PubMed] [Google Scholar]
- 3.Marsh B, Tarigoppula V, Chen C, Francis J. Toward an Autonomous Brain Machine Interface: Integrating Sensorimotor Reward Modulation and Reinforcement Learning. Journal of Neuroscience. 2015;35(19):7374–7387. doi: 10.1523/JNEUROSCI.1802-14.2015. [DOI] [PMC free article] [PubMed] [Google Scholar]
- 4.Roesch M, Olson C. Neuronal Activity Related to Reward Value and Motivation in Primate Frontal Cortex. Science. 2004;304(5668):307–310. doi: 10.1126/science.1093223. [DOI] [PubMed] [Google Scholar]
- 5.Chhatbar P, von Kraus L, Semework M, Francis J. A bio-friendly and economical technique for chronic implantation of multiple microelectrode arrays. Journal of Neuroscience Methods. 2010;188(2):187–194. doi: 10.1016/j.jneumeth.2010.02.006. [DOI] [PubMed] [Google Scholar]
- 6.Maynard E, Nordhausen C, Normann R. The Utah Intracortical Electrode Array: A recording structure for potential brain-computer interfaces. Electroencephalography and Clinical Neurophysiology. 1997;102(3):228–239. doi: 10.1016/s0013-4694(96)95176-0. [DOI] [PubMed] [Google Scholar]
- 7.Jolliffe I. Principal component analysis. New York: John Wiley & Sons, Ltd; 2002. [Google Scholar]
- 8.Balakrishnama S, Ganapathiraju A. Linear discriminant analysis: A brief tutorial. Institute for Signal and information Processing. 1998;18 [Google Scholar]
- 9.Sutton R, Barto A. Reinforcement learning. Cambridge, Mass: MIT Press; 1998. [Google Scholar]
- 10.Pedregosa F, Varoquaux G, Gramfort A, Michel V, Thirion B, Grisel O, Blondel M, Prettenhofer P, Weiss R, Dubourg V, Vanderplax J, Passos A, Cournapeau D, Brucher M, Perrot M, Duchesnay E. Scikit-learn: Machine learning in Python. The Journal of Machine Learning Research. 2011;12:2825–2830. [Google Scholar]
- 11.Choi J, DiStasio M, Brockmeier A, Francis J. An Electric Field Model for Prediction of Somatosensory (S1) Cortical Field Potentials Induced by Ventral Posterior Lateral (VPL) Thalamic Microstimulation. IEEE Trans Neural Syst Rehabil Eng. 2012;20(2):161–169. doi: 10.1109/TNSRE.2011.2181417. [DOI] [PubMed] [Google Scholar]
- 12.Weber D, Stein R, Everaert D, Prochazka A. Decoding Sensory Feedback From Firing Rates of Afferent Ensembles Recorded in Cat Dorsal Root Ganglia in Normal Locomotion. IEEE Trans Neural Syst Rehabil Eng. 2006;14(2):240–243. doi: 10.1109/TNSRE.2006.875575. [DOI] [PubMed] [Google Scholar]
- 13.Song W, Kerr C, Lytton W, Francis J. Cortical Plasticity Induced by Spike-Triggered Microstimulation in Primate Somatosensory Cortex. PLoS ONE. 2013;8(3):e57453. doi: 10.1371/journal.pone.0057453. [DOI] [PMC free article] [PubMed] [Google Scholar]
- 14.O’Doherty J, Lebedev M, Hanson T, Fitzsimmons N, Nicolelis M. A brain-machine interface instructed by direct intracortical microstimulation. Frontiers in Integrative Neuroscience. 2009;3 doi: 10.3389/neuro.07.020.2009. [DOI] [PMC free article] [PubMed] [Google Scholar]


