Abstract
We have designed an electrochemical assay to rapidly diagnose influenza viruses. Exposure of a glucose bearing substrate to influenza viruses or its enzyme, Neuraminidase (NA) releases glucose, which was detected amperometrically. We used two methods to detect released glucose. First, we used a standard glucose blood meter to detect two viral NAs and three influenza strains. We also demonstrated drug susceptibility of two antivirals, Zanamivir and Oseltamivir, using the assay. Second, we used disposable test strips to detect nineteen H1N1 and H3N2 influenza strains using this assay in 1 hour. The limit and range of detection of this first generation assay is 102 and 102–108 plaque forming units (pfu), respectively. Existing, ubiquitous, user friendly glucose meters can be repurposed to detect influenza viruses.
Keywords: Biosensors, influenza virus, carbohydrates, electrochemistry, glycosides
Influenza virus is a highly contagious virus. The Centers for Disease Control, Atlanta, GA, US (CDC) estimates that seasonal influenza is responsible for over 200,000 hospitalizations and 30,000 deaths in the US.[1] Pandemics, although infrequent, can cause significant devastation, the recent 2009 H1N1 “swine flu” infected people in >200 countries within weeks of the initial outbreak.[2] Measuring drug susceptibility is equally important since antivirals are most efficacious when administered before onset of infection[3] and the virus has a high mutation rate, ~ 1.5 × 10⁻⁵ mutations per nucleotide per infectious cycle[4]
Diagnostics for influenza viruses include nucleic acid amplification tests (NAAT), antibody and fluorescence tests. NAATs like the Xpert® Flu tests are highly selective and sensitive, but require sophisticated instruments, the correct primers and can be cost prohibitive for use in primary care facilities, resource poor areas and homes.[5] Chemiluminescence based tests like the Amplex Red Neuraminidase kit require a laboratory setting.[6] Antibody based tests can be variable as it is highly dependent on antibody purification, bioconjugation and the quality controls established by the manufacturer. Indeed, the CDC does not recommend the use of these tests unless it is supported by more accurate techniques.[7] Colorimetric tests like the ZstatFlu test provide a visual readout, but as is the case with several optical tests, the readout is prone to human error and is not sensitive.[8] All these tests are expensive and none of them can measure drug susceptibility rapidly in a point of care setting. The lack of good rapid diagnostic tests leads to asymptomatic treatment and overuse of drugs, which increases drug resistance. Indeed, reports of resistance to Oseltamivir, the preferred antiviral for influenza have been reported. [9].
Influenza has two major surface glycoproteins, Hemagluttinin (HA) and Neuraminidase (NA); the former is implicated in viral entry and the latter is the enzyme that cleaves N-acetyl neuraminic acid (sialic acid) from the surface of host cells to release viral progeny.[10] There are approximately 50–100 copies of NA on the viral surface as determined by immunogold labeling and cryoelectron tomography.[11] Since NA is present as a tetramer, there are approximately 200–400 individual units capable of cleaving sialic acids, which makes it a suitable target for biosensing applications.
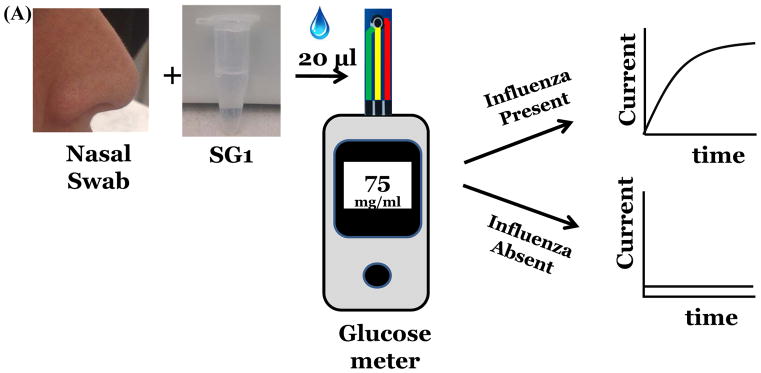
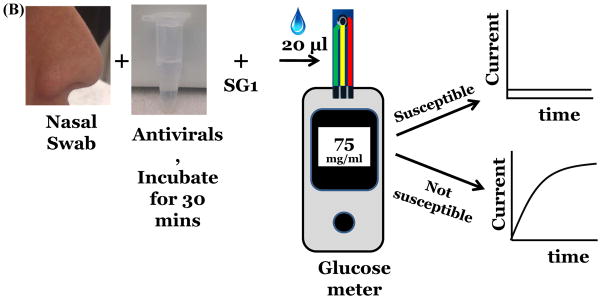
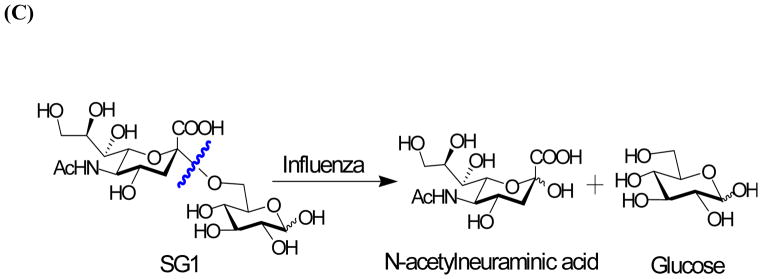
Our strategy was to develop and expose substrates that would release glucose upon action of NA. (Figure 1a). The released glucose can be measured amperometrically. A similar approach has been used to detect other enzymes e.g. beta-galactosidase[12], α-amylase[13]. Here, we demonstrate detection of viral NA, nineteen unique strains of influenza and demonstrate drug susceptibility of the two antivirals, Zanamivir and Oseltamivir. (Figure 1b) These results were validated using rRT-PCR and plaque assays. We choose to measure glucose concentration after 1 hour of incubation using disposable test strips, however, a continuous measurement system can also be designed.
Figure 1.
Detection of influenza virus using SG1 (A) Workflow and scheme for electrochemical detection of influenza virus. (B) Measurement of drug susceptibility. (C) Influenza NA cleaves SG1 to release glucose.
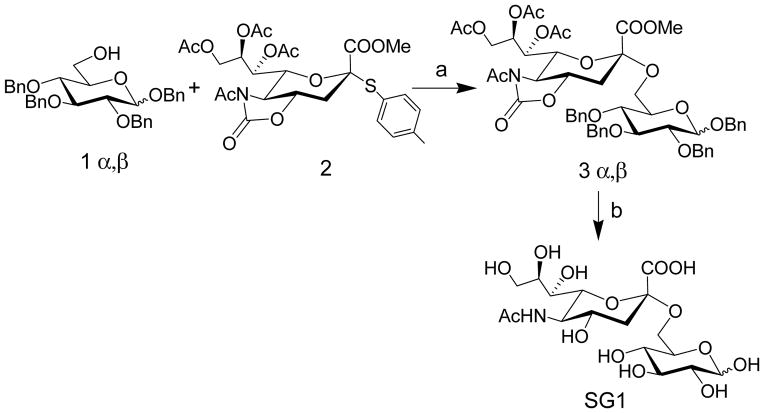
We synthesized a sialic acid derivative, (SG1) where sialic acid is attached to the 6 position of glucose. (Scheme 1). Briefly, Benzyl 2,3,4-tri-O-benzyl-α/β-D-glucopyranoside, 1α/β was synthesized using a modified procedure and reacted with the known N-Acetyl-5-N,4-O-carbonyl protected thiosialoside donor, 2[14] to yield 3α/β to yield exclusive α product, which was confirmed by NMR spectroscopy.[14a, 15] Next, a 3 step procedure was performed. First, Zemplén deacetylation conditions were used to remove the acetates and regioselectively open the oxazolidinone ring to obtain the N-acetamido group. This was followed by hydrogenation to remove the benzyl groups and the resulting product was saponified to produce SG1 in excellent yield. To measure glucose, we developed a three electrode electrochemical cell comprising of a reference, working and counter electrode and used this electrochemical cell to develop a standard curve.[16] (Figure S1, Supporting information).
Scheme 1.
Synthesis of SG1. Reagents and Conditions: a) TfOH, NIS, DCM, −60 °C, 2h, 75%; c) i) NaOMe, MeOH, rt, 30 min.; ii) Pd(OH)2/C/H2, EtOH, rt, 12h.; iii) 0.05 N NaOH in H2O, rt, 4h, 93% over three steps.
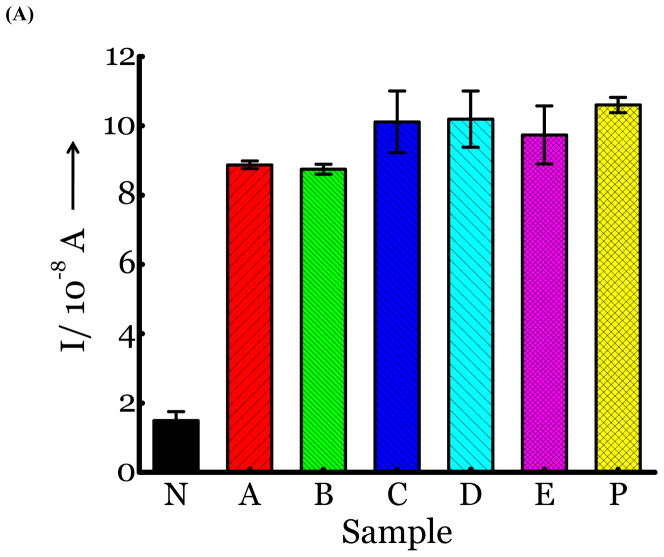
SG1 (0.5 mM) was dissolved in PBS buffer and tested for the presence of glucose. In the absence of enzymes, there is no glucose released. (Figure 2a, sample N, negative control, no NA or virus added). Membrane free influenza viral NA from two different strains (N1 from H5N1 A/Anhui/1/2005 and N2 from A/Babol/36/2005) was incubated for 2 hours at rt with SG1. The sample was analyzed for the presence of glucose directly without further sample preparation. Glucose was released as determined by the current measured amperometrically, which indicated that complete cleavage of SG1 had occurred. (Figure 2a, samples A, B). The positive control (Figure 2a, sample P) was glucose as the only analyte in PBS buffer. Next, we tested three influenza strains, H1N1 A/Brisbane/59/2007, H3N2 A/Aichi/2/1968, and H3N2 A/HongKong/8/68, which were quantified by plaque assays and rRT-PCR. (Figure S2, Supporting information). Introduction of 100 μL of UV inactivated virus to SG1 and incubation for 2 hours, releases glucose. (Figure 2a, Samples C,D,E). The cleavage was confirmed by mass spectral analysis. The mass spectra of the control where there is no virus or NA revealed a peak at m/z 494.1497 (M+Na, positive ion) corresponding to uncleaved SG1. A new peak emerges at m/z, 181.0711 (M+1, positive ion) corresponding to glucose when virus or NA is added.
Figure 2.
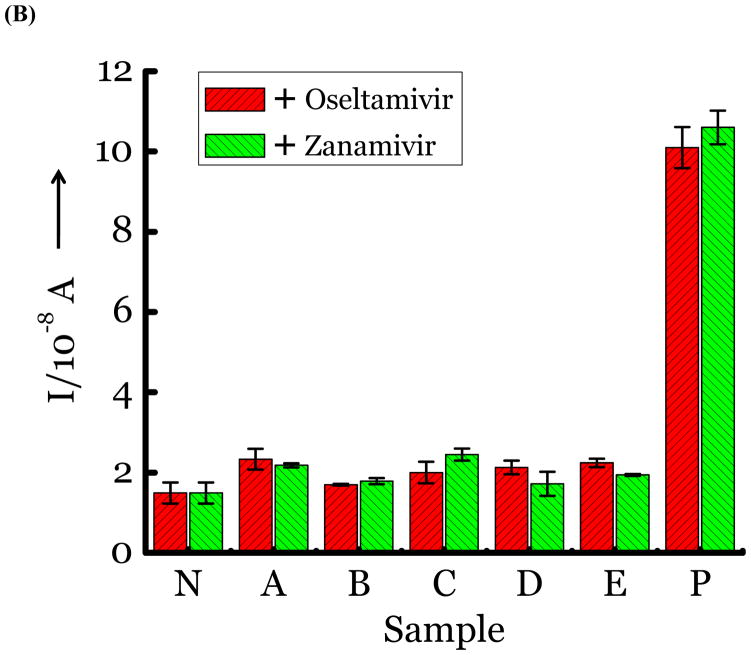
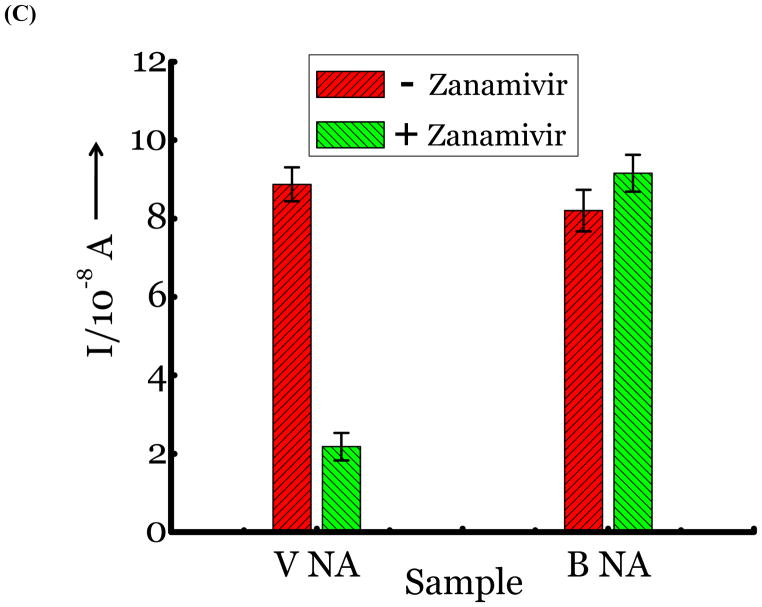
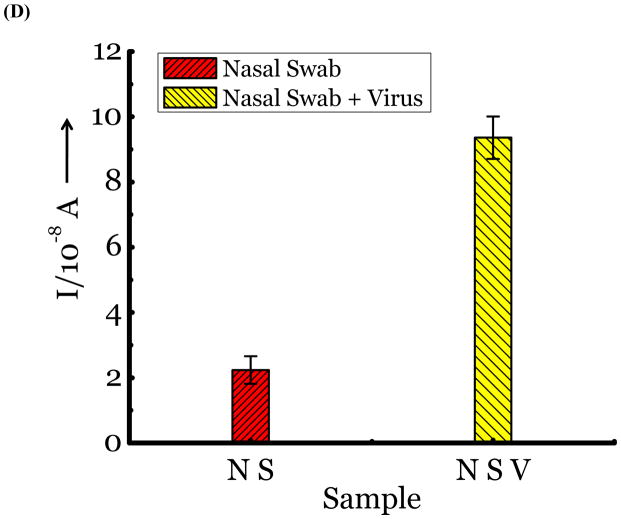
(A) Detection of Influenza virus or viral NA. SG1 (0.5 mM) was incubated with membrane free soluble N1 NA (Sample A, strain H5N1 A/Anhui/1/2005) or N2 NA (Sample B, strain H3N2 A/Babol/36/2005) or three different UV inactivated influenza strains, H3N2 A/Aichi/2/1968 (Sample C) or H1N1 A/Brisbane/59/2007 (Sample D), H3N2 A/HongKong/8/68 (Sample E) for two hours. Glucose was released in all samples. The negative control where no virus or NA was added (Sample N) did not show any noticeable current and the positive control was D-glucose (Sample P) at 0.5 mM. (B) Drug Susceptibility Studies. 10 ng of FDA approved antiviral Zanamivir or Oseltamivir (Carbosynth, USA, San Diego, CA) Zanamivir® or Oseltamivir® were premixed with the strains for 30 min at rt before addition of SG1. Glucose was not released because these strains are susceptible to the drugs. (C) Studies with bacterial NA. Bacterial NA cleaves SG1 to release glucose, however, Zanamivir does not inhibit bacterial NA and glucose is released when BNA was premixed with Zanamivir and incubated with SG1. (D) Studies with human samples. A. Nasal Swab only. There is no glucose present. B. Nasal swab spiked with 105 pfu of H1N1 A/Brisbane/59/2007 and added to SG1. The positive signal indicates there are no matrix effects. The y axis represents current, I, in amperes measured after 100 s using an amperometric i-t curve at a working potential of 0.00 V, and the x-axis represents different samples. All experiments were performed in triplicate independently on different days to demonstrate robustness of the assay.
To test for drug susceptibility, we premixed FDA approved NA inhibitors, Zanamivir or Oseltamivir to virus or NA for 30 minutes before introducing SG1. If the strains are not resistant to the antivirals, they are expected to block the action of NA and a signal for glucose should not be observed. As seen in Figure 2b, the three strains and NA are completely inhibited by the antivirals. Thus, we determined drug susceptibility of these strains within a sample to result test time of less than 2 hours. This is highly significant because drug susceptibility for influenza viruses using genotypic and/or phenotypic methods requires sophisticated instruments, trained personnel and several hours to complete.[17]
To differentiate between bacteria/human NA that are also expected to cleave SG1, we exploited known differences in the binding pocket of NAs. Bacteria/human NA possess a smaller binding pocket and cannot accommodate larger groups at the four position of sialic acid, as confirmed by X-ray structures and functional assays with Zanamivir and Oseltamivir.[10] We and others have exploited this feature to develop inhibitors [10, 18] and substrates [19] that are highly specific for influenza NA. As expected, bacterial NA (BNA) from Clostridium perfringens and viral NA cleave SG1. (Figure 2c, sample BNA). However, when Zanamivir was premixed with both NAs, only BNA cleaves SG1 and not the viral NA because the antiviral is specific for viral NA. (Figure 2c, sample BNA + Z). Therefore, we can distinguish between BNA and viral NA using the antivirals. An alternate approach is to introduce larger groups at the four position of sialic acid to make the substrate highly specific for viral NA instead of using Zanamivir; the syntheses of these next generation substrates are ongoing.
Next, we were interested in determining if nasal or throat swabs, the standard source of clinical samples for influenza viruses, have a background level of glucose. We found glucose is absent in the nose or throat by testing samples obtained from healthy human volunteers. Glucose is released when the samples are spiked with known concentrations of the virus. (Figure 2d) Thus, this assay could be used to test influenza in nasal and/or throat swabs.
To improve assay performance, we used disposable printed electrodes (CH instruments, Austin, Texas) for the next set of experiments. (Figure S3, Supporting information) This experimental setup requires only 20 μL of solution, similar to commercial disposable test strips used to in blood glucose meters. We obtained nineteen H1N1 and H3N2 influenza strains that spanned eighty years, from 1933 to 2011, including strains from the most recent 2009 pandemic. All strains were detected in one hour, which demonstrates broad specificity. These results were validated using rRT-PCR and plaque assays. (Table 1) Some strains cleaved SG1 slowly; we corroborated the results by measuring the slow release using a fluorescence substrate, 2′-(4-methylumbelliferyl)-α-D-N-acetylneuraminic acid (MUNANA). (Figure S4, Supporting information). As expected, the rate of cleavage of A/PuertoRico/8/1934 (H1N1), A/California/07/2009 (H1N1) and A/New Caledonia/20/1999 (H1N1) strains are slower than the A/Beijing/262/1995 (H1N1) strain. We note that, despite variations in printed electrodes from different manufacturer or different batches from the same manufacturer, the assay detects all strains. We also determined the analytical sensitivity using one of the strains using this rudimentary setup. (Figure S3, Supporting information) This limit of detection and range is 102 and 102–108 pfu, respectively. Since multiple studies have reported that patients (n>50) suffering from influenza typically harbor 103–108 pfu/ml in the nose/throat,[20] this assay could be useful for rapid detection in a primary care setting.
Table 1.
Electrochemical detection of nineteen influenza strains and validation with rRT-PCR and cell culture plaque assays.
| Influenza strains | Plaque Assaya | rRT-PCR (CT)b | Electrochemical assay. (x 10−8 A)c |
|---|---|---|---|
| No virus + SG1 | N/A | N/A | 3.6 ± 2.2 |
| No glucose | N/A | N/A | 3.4 ± 1.4 |
| β-Galactosidase | N/A | N/A | 4.2±1.9 |
| α-Mannosidase | N/A | N/A | 4.7±1.6 |
| Glucose (1mM) | N/A | N/A | 124.9 ± 2.3 |
| A/Wilson-Smith/1933 (H1N1) | 4.2 ×10⁶ | 18 | 99.5 ± 4.4 |
| A/PuertoRico/8/1934 (H1N1) | 1.4 ×10⁴ | 15 | 13.4 ± 2.0 |
| A/HongKong/8/1968 (H3N2) | 1.5 × 10⁵ | 22 | 64.4 ± 5.2 |
| A/Aichi/2/1968 (H3N2) | 1.0 × 10⁵ | 15 | 31.3 ± 5.3 |
| A/Beijing/262/1995 (H1N1) | 3.5 × 10⁵ | 21 | 118.1 ± 11.6 |
| A/Nanchang/933/1995 (H3N2) | 7.0 × 10⁵ | 18 | 15.1 ± 2.8 |
| A/Sydney/5/1997 (H3N2) | 8.0 × 10³ | 29 | 115.7 ± 4.3 |
| A/NewCaledonia/20/1999 (H1N1) | 4.4 × 10⁷ | 12 | 17.7 ± 2.6 |
| A/SolomonIslands/3/2006 (H1N1) | 1.1 × 10⁹ | 11 | 79.7 ± 5.0 |
| A/Uruguay/716/2007 (H3N2) | 1.2 ×10⁷ | 20 | 132.4 ± 6.3 |
| A/Brisbane/59/2007 (H1N1) | 2.5 × 10⁷ | 12 | 106.2 ± 5.1 |
| A/Brisbane/10/2007 (H3N2) | 2.2 × 10⁶ | 21 | 78.6 ± 4.9 |
| A/California/07/2009 (H1N1) | 3.6 × 10⁶ | 13 | 13.4 ± 1.5 |
| A/New York/18/2009 (H1N1) | 3.5 × 10⁵ | 17 | 74.4 ±5.6 |
| A/San Diego/1/2009 (H1N1) | 1.2 × 10⁵ | 19 | 108.5 ± 12.0 |
| A/Wisconsin/629-D02452/2009 (H1N1) | 6.0 × 10⁴ | 13 | 98.9 ± 5.7 |
| A/Wisconsin/15/2009 (H3N2) | 5.0 × 10³ | 26 | 107.8 ± 5.9 |
| A/Brownsville/31H/2009 (H1N1) | 4.0 × 10³ | 22 | 91.7 ± 9.7 |
| A/Victoria/361/2011 (H3N2) | 7.0 × 10⁶ | 26 | 94.5 ± 2.3 |
Reported in pfu/ml.
rRT-PCR was performed using 100 μL of virus.
100 μL of virus was mixed with 100 μL of PBS buffer with SG1 for 1 hour at 37 °C. Glucose concentration was determined using 20 μL of this solution.
To summarize, we developed an electrochemical assay that releases glucose upon introduction of influenza viruses. We successfully detected nineteen influenza strains. The assay can be used to measure drug susceptibility rapidly, a significant advantage over current genotypic and phenotypic methods that take time, resources, and a laboratory environment [17]. The assay can be integrated into current glucose meters by repurposing the instruments to test nasal or throat swabs for influenza. Since glucose meters with disposable test strips are user friendly, ubiquitous, and inexpensive, this method has great potential to improve clinical decisions and minimize disease burden. Further optimization of the lead compound, developing conditions to maximize enzyme cleavage rate, constructing disposable strips with better quality control and integrating the assay into existing glucose meters is ongoing.
Experimental Section
The synthesis of SG1, characterization data of intermediates and final compound are provided in the Supporting information. Also provided are details of the assays.
Supplementary Material
Acknowledgments
We are grateful for NIH-NIAID (R01-AI089450) for funding. We thank BEI Resources, NIAID, Manassas, VA for the viral strains and Dr. Didier Merlin for kind use of his instruments.
Footnotes
This work is dedicated to Professor Malcolm Chisholm on the occasion of his 69th birthday.
Supporting information for this article is given via a link at the end of the document
References
- 1.Fiore AE, Shay DK, Broder K, Iskander JK, Uyeki TM, Mootrey G, Bresee JS, Cox NJ. MMWR Recomm Rep. 2009;58:1–52. [PubMed] [Google Scholar]
- 2.Zarocostas J. British Medical Journal. 2009;338:b2425. [Google Scholar]
- 3.Fiore AE, Fry A, Shay D, Gubareva L, Bresee JS, Uyeki TM. MMWR Recomm Rep. 2011;60:1–24. [PubMed] [Google Scholar]
- 4.Parvin JD, Moscona A, Pan WT, Leider JM, Palese P. J Virol. 1986;59:377–383. doi: 10.1128/jvi.59.2.377-383.1986. [DOI] [PMC free article] [PubMed] [Google Scholar]
- 5.Novak-Weekley SM, Marlowe EM, Poulter M, Dwyer D, Speers D, Rawlinson W, Baleriola C, Robinson CC. J Clin Microbiol. 2012;50:1704–1710. doi: 10.1128/JCM.06520-11. [DOI] [PMC free article] [PubMed] [Google Scholar]
- 6.Nayak DP, Reichl U. J Virol Methods. 2004;122:9–15. doi: 10.1016/j.jviromet.2004.07.005. [DOI] [PubMed] [Google Scholar]
- 7.Balish A, Warnes CM, Wu K, Barnes N, Emery S, Berman L, Shu B, Lindstrom S, Xu X, Uyeki T, Shaw M, Klimov A, Villanueva J. MMWR Wkly Rep. 2009;58:826–829. [Google Scholar]
- 8.Rodriguez WJ, Schwartz HR, Thorne MM. The Pediatric Infectious Disease Journal. 2002;21:193–196. doi: 10.1097/00006454-200203000-00006. [DOI] [PubMed] [Google Scholar]
- 9.a) Mai-Phuong HV, Hang Nle K, Phuong NT, Mai le Q. Western Pac Surveill Response J. 2013;4:25–29. doi: 10.5365/WPSAR.2013.4.1.010. [DOI] [PMC free article] [PubMed] [Google Scholar]; b) Hay AJ, Hayden FG. Lancet. 2013;381:2230–2232. doi: 10.1016/S0140-6736(13)61209-X. [DOI] [PubMed] [Google Scholar]
- 10.von Itzstein M. Nat Rev Drug Discov. 2007;6:967–974. doi: 10.1038/nrd2400. [DOI] [PubMed] [Google Scholar]
- 11.Wasilewski S, Calder LJ, Grant T, Rosenthal PB. Vaccine. 2012;30:7368–7373. doi: 10.1016/j.vaccine.2012.09.082. [DOI] [PMC free article] [PubMed] [Google Scholar]
- 12.a) Mohapatra H, Phillips ST. Chem Commun (Camb) 2013;49:6134–6136. doi: 10.1039/c3cc43702g. [DOI] [PubMed] [Google Scholar]; b) Chavali R, Gunda NSK, Naicker S, Mitra SK. Anal Methods-Uk. 2014;6:6223–6227. [Google Scholar]
- 13.Wang Q, Wang H, Yang X, Wang K, Liu R, Li Q, Ou J. Analyst. 2015;140:1161–1165. doi: 10.1039/c4an02033b. [DOI] [PubMed] [Google Scholar]
- 14.a) Crich D, Li W. J Org Chem. 2007;72:2387–2391. doi: 10.1021/jo062431r. [DOI] [PMC free article] [PubMed] [Google Scholar]; b) Zhang XT, Gu ZY, Xing GW. Carbohydr Res. 2014;388:1–7. doi: 10.1016/j.carres.2014.02.006. [DOI] [PubMed] [Google Scholar]
- 15.Dabrowski U, Dabrowski H, Friebolin R, Brossmer M. Supp, Tetrahedron letters. 1979;20:4637–4640. [Google Scholar]
- 16.Wu S, Liu G, Li P, Liu H, Xu H. Biosens Bioelectron. 2012;38:289–294. doi: 10.1016/j.bios.2012.06.001. [DOI] [PubMed] [Google Scholar]
- 17.Okomo-Adhiambo M, Sheu TG, Gubareva LV. Influenza and other respiratory viruses. 2013;7(Suppl 1):44–49. doi: 10.1111/irv.12051. [DOI] [PMC free article] [PubMed] [Google Scholar]
- 18.a) Kim JH, Resende R, Wennekes T, Chen HM, Bance N, Buchini S, Watts AG, Pilling P, Streltsov VA, Petric M, Liggins R, Barrett S, McKimm-Breschkin JL, Niikura M, Withers SG. Science. 2013;340:71–75. doi: 10.1126/science.1232552. [DOI] [PubMed] [Google Scholar]; b) Yang Y, He Y, Li X, Dinh H, Iyer SS. Bioorg Med Chem Lett. 2014;24:636–643. doi: 10.1016/j.bmcl.2013.11.077. [DOI] [PMC free article] [PubMed] [Google Scholar]
- 19.Shimasaki CD, Achyuthan KE, Hansjergen JA, Appleman JR. Philos Trans R Soc Lond B Biol Sci. 2001;356:1925–1931. doi: 10.1098/rstb.2001.10006. [DOI] [PMC free article] [PubMed] [Google Scholar]
- 20.a) Lee N, Chan PK, Hui DS, Rainer TH, Wong E, Choi KW, Lui GC, Wong BC, Wong RY, Lam WY, Chu IM, Lai RW, Cockram CS, Sung JJ. J Infect Dis. 2009;200:492–500. doi: 10.1086/600383. [DOI] [PMC free article] [PubMed] [Google Scholar]; b Suess T, Remschmidt C, Schink SB, Schweiger B, Heider A, Milde J, Nitsche A, Schroeder K, Doellinger J, Braun C, Haas W, Krause G, Buchholz U. PLoS ONE. 2012;7:e51653. doi: 10.1371/journal.pone.0051653. [DOI] [PMC free article] [PubMed] [Google Scholar]
Associated Data
This section collects any data citations, data availability statements, or supplementary materials included in this article.


